Emergency Department Utilization by HIV-Infected South Carolina Residents, 1996-2015
*Corresponding Author(s):
Kent J StockLowcountry Infectious Diseases And Infusion Center, 1938 B Charlie Hall Boulevard, Charleston, SC 29414, United States
Tel:+1 8434020227,
Email:kstock@lcids.com
Abstract
Emergency Department (ED) utilization by HIV-infected patients in the United States (US) exceeds that of the general population. The demographic characteristics of HIV-infected South Carolina (SC) residents who make ED visits in this state are important to delineate because ED visits are costly and potentially avoidable. Identifying high utilizer groups will allow for the better allocation of limited resources and prevent the costly and unnecessary use of EDs in SC.
Materials/Methods
A retrospective, twenty-year cohort study was conducted to examine the demographic characteristics of ED utilization on behalf of HIV-infected SC residents. The SC Uniform Billing database (UB-40 All Payer Hospital data) maintained by the SC Revenue and Fiscal Affairs Office was used for the study.
Results
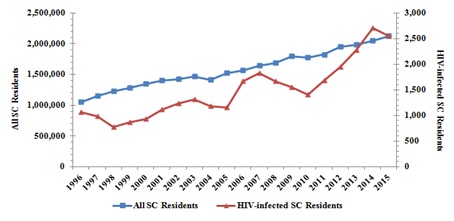
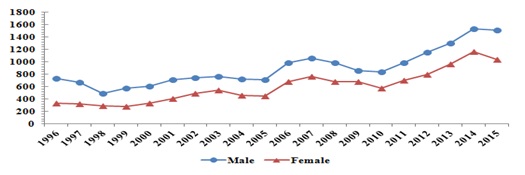
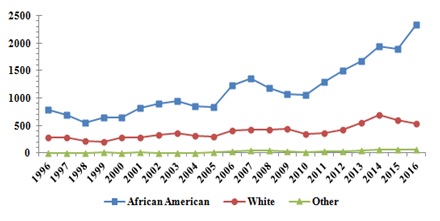
A total of 29,909 ED visits were made by HIV-infected SC residents between 1996 and 2015. The total number of annual ED visits made by HIV-infected residents increased 246.5%, whereas ED visits made on behalf of all SC residents increased only 100.7% over the same period of time. HIV-infected males comprised 60.0% of the total ED visits. The annual ED visits made by HIV-infected males increased 211.8% compared to 309.1% for HIV-infected females in this state. The majority (73.3%) of HIV-infected SC residents making ED visits were African-American. African-Americans experienced a 250.8% increase in annual ED visits over time compared to a 238.2% increase in whites and a 1,300% increase among other minorities. The majority (58.92%) of ED visits occurred in the 18-44 year old age group. This age group realized a 96.8% increase in annual ED visits over time. Annual ED visits made by the 45-64 year old age group and the 65 and older age group increased 883.7% and 2,850.0%, respectively. The 0-17 year old age group was the only age group to experience a decrease (600%) during this period of time. The majority of SC counties with the highest total annual ED visit rates were rural.
Conclusion
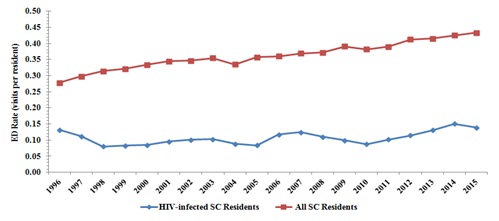
Despite the introduction of cART HIV-infected SC residents make ED visits at a higher rate than the general population. Certain demographic groups appear to be disproportionately represented in the ED setting. By targeting these high utilizer groups, the state may better allocate resources and prevent the unnecessary and costly use of EDs in South Carolina.
INTRODUCTION
MATERIALS AND METHODS
This retrospective, twenty-year cohort study was conducted to examine the demographic characteristics of ED utilization on behalf of HIV-infected SC residents. The SC Uniform Billing database (UB-04 All Payer Hospital Data) maintained by the SC Revenue and Fiscal Affairs Office was used for the study. Acute care facilities in SC (N=70) collected the data. Specialty rehabilitation centers were excluded. Both HIV-infected and non-infected SC residents were included in the study. The data set was limited to HIV-infected and non-infected SC residents who made ED visits between the years 1996-2015. Inclusion criteria stipulated HIV or AIDS be listed as a top ten ED visit diagnosis. HIV-infected SC residents who made ED visits in neighboring states were excluded. The data inquiry was performed on June 7, 2017.
The data included white and African-American residents. Alternative racial/ethnic groups are included in the designation “Other” due to small representation in the data set. Age was organized into groups consistent with those traditionally reported by the Center for Disease Control in Atlanta, Georgia. Additional variables included in the study were County of Origin and Gender. County of Origin is indicative of a patient’s county of residence rather than ED visit location.
The annual ED visit rate for HIV-infected SC residents was calculated by dividing the total number of ED visits made annually on behalf of HIV-infected residents by the total number of HIV-infected residents documented that year. The annual ED visit rate for all SC residents was calculated by using the number of ED visits made annually divided by the total state population documented that year. Annual ED visit rates for HIV-infected SC residents were calculated by County of Origin using similar, region-specific calculations in order to account for population disparities between counties. The total number of HIV-infected SC residents was obtained from the HIV surveillance report monitored by the STD/HIV Division, SC Department of Health and Environmental Control. Only SC residents were included. In 1981, the state of SC mandated that all AIDS cases be reported. A mandate was instituted in 1986 that all HIV cases be reported. The data inquiry used in the study was performed on September 27, 2017.
The total number of SC residents was obtained from data published by the US Census Bureau. For years that the total state or county population was unknown projections were formulated from data sets based on acceptable estimated rates of growth. The data inquiry used in the study was performed on September 27, 2017. Counties were designated as rural based on criteria established by the Office of Rural Health Policy, Health Resources and Service Administration in Rockville, Maryland. The information was based on US Census data from 2010. The data inquiry was made on October, 5, 2017.
RESULTS
General trends
Gender
Race/Ethnicity
The racial/ethnic composition of HIV-infected SC residents making ED visits has changed over time. In 1996, African-Americans comprised 73.50% of total ED visits, whites 26.03% and other racial/ethnic groups 0.47%. In 2015, African-Americans comprised 74.47% of total ED visits, whites 23.34% and other racial/ethnic groups 2.19%.
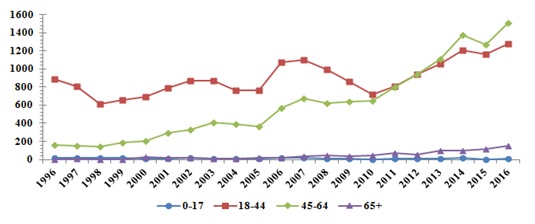
Age groups
The distribution of HIV-infected SC residents who made annual ED visits within specific age groups has changed over time. In 1996, the 18-44 year old age group comprised 83.27% of annual ED visits, the 45-64 year old age group, 14.94%, the 65 and older age group, 0.38% and the 0-17 year old age group, 1.41%. In 2015, the 18-44 year old age group comprised 45.38% of annual ED visits, the 45-64 year old age group, 49.84%, the 65+ year old age group, 4.62%, and the 0-17 year old age group, 0.16%.
County of origin
The sixteen counties with the highest total annual ED visit rates made by HIV-infected county residents were Allendale, Bamberg, Chesterfield, Dillon, Fairfield, Florence, Georgetown, Greenwood, Laurens, Lexington, Marlboro, Newberry, Oconee, Saluda, Union and Williamsburg. Ten of these sixteen counties are considered rural (Figure 6). Several counties realized a decrease in their annual ED visit rate from 1996 to 2015. These counties were Aiken, Allendale, Anderson, Bamberg, Barnwell, Beaufort, Calhoun, Clarendon, Darlington, Dillon, Dorchester, Edgefield, Fairfield, Florence, Greenville, Greenwood, Jasper, Laurens, Lexington, Marion, Marlboro, Oconee, and Richland.
|
|
Total ED Visits 1996 |
Total ED Visits 2015 |
Total ED Visits 1996-2015 |
Annual ED Visit Rate 1996 (per 1,000 Residents) |
Annual ED Visit Rate 2015 (per 1,000 Residents) |
Average Annual ED Visit Rate 1996-2015 (per 1,000 Residents) |
|
Abbeville |
1 |
9 |
76 |
53 |
196 |
112 |
|
Aiken |
12 |
19 |
233 |
65 |
46 |
38 |
|
Allendale |
8 |
14 |
224 |
364 |
286 |
272 |
|
Anderson |
27 |
30 |
397 |
162 |
83 |
75 |
|
Bamberg |
13 |
10 |
282 |
217 |
99 |
174 |
|
Barnwell |
10 |
5 |
215 |
161 |
40 |
115 |
|
Beaufort |
20 |
41 |
519 |
121 |
97 |
78 |
|
Berkeley |
2 |
66 |
969 |
10 |
134 |
133 |
|
Calhoun |
3 |
3 |
81 |
143 |
60 |
100 |
|
Charleston |
62 |
288 |
3652 |
61 |
144 |
118 |
|
Cherokee |
7 |
36 |
224 |
156 |
387 |
143 |
|
Chester |
6 |
26 |
79 |
150 |
277 |
54 |
|
Chesterfield |
1 |
12 |
218 |
21 |
108 |
143 |
|
Clarendon |
17 |
15 |
214 |
165 |
84 |
69 |
|
Colleton |
13 |
42 |
271 |
137 |
228 |
85 |
|
Darlington |
40 |
37 |
460 |
328 |
136 |
121 |
|
Dillon |
27 |
18 |
358 |
474 |
122 |
191 |
|
Dorchester |
21 |
50 |
674 |
156 |
127 |
118 |
|
Edgefield |
1 |
2 |
35 |
16 |
14 |
18 |
|
Fairfield |
1 |
1 |
303 |
23 |
10 |
178 |
|
Florence |
119 |
97 |
1657 |
363 |
120 |
144 |
|
Georgetown |
15 |
49 |
713 |
124 |
187 |
175 |
|
Greenville |
124 |
200 |
1843 |
209 |
140 |
127 |
|
Greenwood |
21 |
17 |
548 |
183 |
70 |
157 |
|
Hampton |
1 |
27 |
321 |
22 |
185 |
140 |
|
Horry |
54 |
243 |
1769 |
144 |
245 |
126 |
|
Jasper |
6 |
9 |
89 |
130 |
88 |
54 |
|
Kershaw |
20 |
53 |
406 |
206 |
272 |
130 |
|
Lancaster |
4 |
128 |
427 |
58 |
472 |
94 |
|
Laurens |
30 |
29 |
574 |
330 |
155 |
205 |
|
Lee |
7 |
46 |
266 |
140 |
279 |
107 |
|
Lexington |
68 |
28 |
1762 |
209 |
36 |
149 |
|
McCormick |
0 |
0 |
56 |
0 |
0 |
132 |
|
Marion |
26 |
36 |
254 |
289 |
211 |
103 |
|
Marlboro |
19 |
15 |
437 |
229 |
112 |
199 |
|
Newberry |
3 |
79 |
716 |
65 |
681 |
351 |
|
Oconee |
20 |
7 |
179 |
500 |
81 |
152 |
|
Orangeburg |
18 |
101 |
909 |
61 |
201 |
105 |
|
Pickens |
5 |
21 |
179 |
79 |
135 |
80 |
|
Richland |
124 |
127 |
2984 |
85 |
38 |
58 |
|
Saluda |
0 |
1 |
83 |
0 |
26 |
143 |
|
Spartanburg |
36 |
220 |
1716 |
105 |
285 |
141 |
|
Sumter |
40 |
233 |
1417 |
113 |
345 |
119 |
|
Union |
1 |
10 |
164 |
37 |
182 |
198 |
|
Williamsburg |
5 |
26 |
642 |
57 |
103 |
180 |
|
York |
6 |
39 |
356 |
28 |
71 |
40 |
DISCUSSION
Males represent 49% of the total state population but comprise the majority (71%) of HIV infected residents [13]. Males also consistently make the majority of ED visits in this state, however, women have been shown to comprise a growing percentage of annual ED visits over time. This is contrasted by a 34% decrease in newly diagnosed HIV cases in women over the past ten years [13]. Prior authors have suggested HIV-infected women demonstrate increased health care utilization and are more likely to use the ED than their male counterparts [9,14-16]. This, paired with inadequate primary care engagement, may be contributing factors to this discrepancy [17,18].
African-Americans are disproportionately affected by HIV in the state of SC. They comprise 28% of the total state population but represent 69% of the total HIV cases in this state [19,13]. The majority of ED visits were made by African-Americans, reflecting high disease prevalence in this group. Unfortunately, an increasing percentage of annual ED visits are made by African-Americans or other minority groups. Racial disparities in care exist which may increase the need for minorities to utilize EDs to meet their health care needs [20,21]. Other variables that have been associated with higher ED utilization that are found commonly in minority groups include poverty, lack of insurance, cost barriers, poor access to medical care and inadequate testing [19,22-24].
The HIV population in SC is aging. HIV-infected residents age 50 and older represent 46.7% of the total infected patients compared to 37% of the total state population [13]. While the majority of ED visits from 1996-2015 were made by the 18-44 year old age group, the greatest increase in ED visits occurred in the 45-64 year old and 65 years and older age groups. This trend likely reflects the changing demographic characteristics of our state’s HIV population. In addition, the aging HIV population in our state is realizing an increase in age-related conditions that require additional medical care and services which likely contributes to ED utilization [25]. The only age group to realize a decrease in ED utilization over time was the 0-17 year old age group. This reflects the continued decrease in HIV incidence documented in this age group.
Finally, the majority (62.5%) of counties that were listed in the top third percentile for total annual ED visits rates from 1996-2015 are considered rural. Rural residents in the US face many health issues including physician or provider work shortages, a widening gap in life expectancy and a wave of hospital closures [26]. Rural residents tend to be less healthy than their urban counterparts in part because of poor lifestyle choices [27]. Medicaid covers a larger percentage of rural residents compared to urban dwellers and therefore inadequate insurance coverage and the lack of Medicaid expansion in SC may also be adversely affecting rural-based, HIV-infected residents’ access to preventative care [28]. Rural residents are more likely to have a low socioeconomic status and this has been shown to be associated with greater ED use for conditions that can be managed in the outpatient setting [12]. Rural counties are also less likely to receive HIV preventative services which are likely to unfavorably influence ED utilization [29].
Our study has several limitations. The uniform billing database does not contain ED visits made on behalf of HIV-infected South Carolina residents in other states. In addition the database does not include clinical information i.e., CD4 counts, use of cART, or whether they are currently in care. Despite the introduction of cART, SC HIV-infected residents make ED visits at a higher rate than the general population. Certain demographic groups appear to be disproportionately represented in the ED setting. By targeting these high utilizer groups, the state may begin to better allocate resources and prevent the unnecessary and costly use of EDs in South Carolina.
REFERENCES
- Weiss AJ, Wier LM, Stocks C, Blanchard J (2014) Overview of Emergency Department Visits in the United States, 2011. HCUP Statistical Brief #174. Agency for Healthcare Research and Quality, Rockville, Maryland, USA.
- Tang N, Stein J, Hsia RY, Maselli JH, Gonzales R (2010) Trends and Characteristics of US Emergency Department Visits, 1997-2007. JAMA 304: 664-670.
- Obamacare Facts (2015) “Study Shows ER Visits up Under ACA.” Obamacare Facts, New York, USA.
- Mohareb AM, Rothman RE, Hsieh YH (2013) Emergency Department (ED) Utilization by HIV-infected ED Patients in the United States in 2009 and 2010 - a national estimation. HIV Med 14: 605-613.
- Westmoreland TM (2016) The Affordable Care Act in the United States and HIV Disease: Past, Present, and Future. Top Antivir Med 24: 98-102.
- Ryan Ng, Kendall CE, Burchell AN, Bayoumi AM, Loutfy MR, et al. (2016) Emergency Department Use by People with HIV in Ontario: A Population-based Cohort Study. CMAJ Open 4: 240-248.
- Shih TY, Chen KF, Rothman RE, Hsieh YH (2011) US National Estimation of Emergency Department Utilization by Patients Given ‘HIV/AIDS-related Illness’ as their Primary Diagnosis. HIV Med 12: 343-351.
- Venkat A, Shippert B, Hanneman D, Nesbit C, Piontkowsky DM, et al. (2008) Emergency Department Utilization by HIV-positive Adults in the HAART Era. Int J Emerg Med 1: 287-296.
- Josephs JS, Fleishman JA, Korthuis PT, Moore RD, Gebo KA, et al. (2010) Network. Emergency Department Utilization Among HIV-infected Patients in a Multisite Multistate Study. HIV Med 11: 74-84.
- Lambert AA, Kirk GD, Astemborski J, Mehta SH, Wise RA, et al. (2015) HIV Infection is Associated With Increased Risk For Acute Exacerbation of COPD. J Acquir Immune Defic Syndr 69: 68-74.
- Kendall CE, Wong J, Taljaard M, Glazier RH, Hogg W, et al. (2014) A Cross-sectional, Population-based Study Measuring Comorbidity Among People Living With HIV in Ontario. BMC Public Health 14: 161.
- Khan Y, Glazier RH, Moineddin R, Schull MJ (2011) A Population-based Study of the Association Between Socioeconomic Status and Emergency Department Utilization in Ontario, Canada. Acad Emerg Med 18: 836-843.
- 13. SCDHEC (2017) South Carolina's STD/HIV/AIDS Data: Surveillance Report. SCDHEC, South Carolina, USA.
- Fleishman JA, Gebo KA, Reilly ED, Conviser R, Mathews WC, et al. (2005) Hospital and Outpatient Health Services Utilization Among HIV-infected Adults in Care 2000-2002. Med Care 43: 11140-11152.
- Shapiro MF, Morton SC, McCaffrey DF, Senterfitt JW, Fleishman JA, et al. (1999) Variations in the care of HIV-infected adults in the United States: Results from the HIV Cost and Services Utilization Study. JAMA 281: 24: 2305-2315.
- Gebo KA, Fleishman JA, Conviser R, Reilly ED, Korthuis PT, et al. (2005) Racial and gender disparities in receipt of highly active antiretroviral therapy persist in a multistate sample of HIV patients in 2001. J Acquir Immune Defic Syndr 38: 96-103.
- Gifford AL, Collins R, Timberlake D, Schuster MA, Shapiro MF, et al. (2000) Propensity of HIV Patients to Seek Urgent and Emergent Care. HIV Cost and Services Utilization Study Consortium. J Gen Intern Med 15: 833-840.
- Kerr J, Duffus WA, Stephens T (2014) Relationship of HIV care engagement to emergency department utilization. AIDS Care 26: 547-553.
- Proctor BD, Dalakor J (2002) Poverty in the US: 2001. Current Population Reports, US Census Bureau, Maryland, USA. Pg no: 60-219.
- Blanchard JC, Haywood YC, Scott C (2003) Racial and ethnic disparities in health: An emergency medicine perspective. Acad Emerg Med 10: 1289-1293.
- Bozzette SA, Joyce G, McCaffrey DF, Leibowitz AA, Morton SC, et al. (2001) Expenditures for the care of HIV-infected patients in the era of highly active antiretroviral therapy. N Engl J Med 344: 817-823.
- Ayanian JZ, Weissman JS, Schneider EC, Ginsburg JA, Zaslavsky AM (2000) Unmet health needs of uninsured adults in the United States. JAMA 284: 2061-2069.
- Oster A, Bindman AB (2003) Emergency department visits for ambulatory care sensitive conditions: insights into preventable hospitalizations. Med Care 41: 198-207.
- Marano M, Stein R, Song W, Patel D, Taylor-Aidoo N, et al. ( 2018) HIV Testing, Linkage to HIV Medical Care, and Interviews for Partner Services Among Black Men Who Have Sex with Men - Non-Health Care Facilities, 20 Southern U.S. Jurisdictions, 2016. MMWR Morb Mortal Wkly Rep 67: 778-781.
- Mills EJ, Bernighausen T, Negin J (2012) HIV and aging--preparing for the challenges ahead. N Engl J Med 366: 1270-1273.
- Iglehart JK (2018) The Challenging Quest to Improve Rural Health Care. N Engl J Med 378: 473-479.
- Moy E, Garcia MC, Bastian B, Rossen LM, Ingram DD, et al. (2017) Leading Causes of Death in Nonmetropolitan and Metropolitan Areas - United States, 1999-2014. MMWR Surveill Summ 66: 1-8.
- Hoadley J, Alker J, Wagnerman K, Holmes M (2017) Medicaid in Small Towns and Rural America: A Lifeline for Children, Families and Communities. Georgetown University Health Policy Institute Center for Children and Families, New York, USA.
- Evans M, Labuda SM, Hogan V, Agnew-Brune C, Armstrong J, et al. (2018) Notes from the Field: HIV Infection Investigation in a Rural Area - West Virginia, 2017. MMWR Morb Mortal Wkly Rep 67: 257-258.
Citation: Gruber EM, Stock AG, Gitter AA, Stock KJ (2019) Emergency Department Utilization by HIV-Infected South Carolina Residents, 1996-2015. J AIDS Clin Res Sex Transm Dis 6: 022.
Copyright: © 2019 Elise M Gruber, et al. This is an open-access article distributed under the terms of the Creative Commons Attribution License, which permits unrestricted use, distribution, and reproduction in any medium, provided the original author and source are credited.