Analysis of an Anesthesia and Intensive Care Ventilators during Suctioning through a Fiber-optic Bronchoscope
*Corresponding Author(s):
Gerardo TusmanDepartment Of Anesthesiology, Hospital Privado De Comunidad, Mar Del Plata, Argentina
Tel:+54 223 499 0074,
Email:gtusman@hotmail.com
Abstract
Background
The aim of this bench test was to compare the performance of an anesthesia and an intensive care ventilator during Fiber-optic Bronchoscopy (FOB) suctioning.
Methods
In a lung model, a 5.9 mm OD FOB was inserted into an endotracheal tube through a tight-fitting connector. Pressure and flow sensors were placed at the airways opening (Pao) and distal to the bronchoscope at the trachea (Ptr). This model was tested under pressure and volume controlled mandatory ventilation and during Continuous Positive Airway Pressure (CPAP) delivered by both, anesthesia and intensive care ventilators. End-expiratory pressure was set at 10 cm H2O. Measurements were performed during suctioning with a mean negative flow of -12 ± 0.2 L/min at the tip of the FOB.
Results
The anesthesia ventilator failed to keep end-expiratory pressure above zero at the trachea during FOB suctioning using both, continuous mandatory ventilation and CPAP. When using an intensive care ventilator, Ptr decreased below zero during FOB suctioning during volume controlled ventilation but remained slightly above zero under pressure controlled ventilation. When this ventilator delivered 10 cm H2O of CPAP, Pao remained constant while Ptr decreased by 2.5 cm H2O during suctioning.
Conclusion
During FOB suctioning, targeted Ptr could neither be maintained anesthesia nor intensive care ventilators used in mandatory modes of ventilation. Only CPAP administered by the intensive care ventilator kept Ptr reasonably stable during suctioning.
Keywords
Continuous Positive Airway Pressure (CPAP); Fiber-optic Bronchoscopy (FOB); Protective ventilation; Suctioning; Ventilator-Induced Lung Injury (VILI)
BACKGROUND
Fiber-optic Bronchoscopy (FOB) performed in patients under controlled mechanical ventilation is a common intervention in operating rooms and Intensive Care Units (ICU) [1-3] and it is known to be associated with severe cardio-respiratory complications [4-6].
FOB promotes lung collapse by the negative pressures created during suctioning. The subsequent loss of Functional Residual Capacity (FRC) induces atelectasis and potentiates Ventilator-Induced Lung Injury (VILI) any time partially collapsed lungs are ventilated with positive pressure [7-11]. This VILI is expected to be minimized if lungs were ventilated with a protective pattern and if FRC could be preserved during FOB suctioning [12-17]. Previous evidence created with closed system suctioning showed that ICU ventilators seem to be able to compensate at least partially the negative pressures of suctioning, especially under Continuous Positive Airways Pressure (CPAP) [18-21]. However, we observed that standard anesthesia machines failed to redo so during FOB performed in the operating room.
We hypothesized that intensive care ventilators are better than anesthesia machines to maintain tracheal pressure (Ptr) in FOB procedures. Thus, the aim of this bench test was to evaluate whether protective ventilatory settings delivered by standard anesthesia and intensive care ventilators in mandatory modes or CPAP could maintain tracheal pressure (Ptr) during FOB suctioning. We reasoned that the effects of FOB suctioning on Ptr would be compensated by CPAP as inspiratory flow is continuously delivered any time the actual circuit pressure decreases below the set pressure. This hypothesis was tested in two commercially available anesthesia and ICU ventilators.
MATERIALS AND METHODS
Setup
Measurements
The main parameters studied were Tidal Volume (VT), Peak Inspiratory (PIP) and Plateau (Pplat) Pressures, Peak Expiratory Flow (PEF), Dynamic Compliance (Cdyn) and expiratory airway resistances (Raw). Cdyn was calculated as measured VT divided by delta pressure (PIP-PEEP) and Raw as PIP minus Pplat divided by flow.
Suctioning system
Protocol
The system was pressurized with a constant pressure of 50 cm H2O for one minute to confirm the absence of air leaks. Afterward the following measurements were performed in random order:
• Step 1: Two minutes of baseline ventilation
• Step 2: Two minutes of ventilation with the FOB placed in the trachea
• Step 3: Suctioning trials through the FOB suction port in VC-CMV and PC-CMV
• Step 4: Suctioning trial through the FOB suction port using 10 cm H2O of CPAP
Two suctioning maneuvers were performed at steps 3 and 4: a) 30 seconds of Intermittent Suctioning (IS) - pushing and releasing the aspiration button every 2 seconds in a 1:1 ratio, and b) 15 seconds of Continuous Suctioning (CS). The sequence of those suctioning trials was randomized and separated by a recovery period of 20 seconds at baseline ventilation. Protocol steps were repeated 3 times with each one of the ventilators.
Statistical analysis
RESULTS
During steps 1 and 2 the coefficient of variation for 30 values of the studied parameters was ≤ 3 %. Tables 1 and 2 show the effect of FOB on the ventilatory parameters when compared to baseline ventilation. In general, such effects were similar for the anesthesia and ICU ventilator.
|
Parameter |
Anesthesia Ventilator |
|||||||
|
VC-CMV |
PC-CMV |
|||||||
|
Pao |
Ptr |
Pao |
Ptr |
|||||
|
B |
FOB |
B |
FOB |
B |
FOB |
B |
FOB |
|
|
PIP |
27 ± 0.3 |
37 ± 0.2* |
26 ± 0.2 |
25 ± 0.4 |
26 ± 1.1 |
33 ± 0.1* |
25 ± 1.0 |
25 ± 0.3 |
|
Pplat |
22 ± 0.3 |
27 ± 0.9* |
25 ± 0.1 |
25 ± 0.3 |
-- |
-- |
-- |
-- |
|
VT |
429 ± 5 |
418 ± 9 |
422 ± 7 |
424 ± 14 |
416 ± 10 |
426 ± 6 |
42 ± 19 |
428 ± 9 |
|
PEF |
25 ± 0.9 |
15 ± 0.3* |
27 ± 0.3 |
17 ± 2.0* |
25 ± 1.7 |
16 ± 0.3* |
26 ± 0.8 |
20 ± 0.2* |
|
Cdyn |
24 ± 0.6 |
19 ± 0.5* |
27 ± 0.3 |
30 ± 1.6 |
32 ± 0.6 |
25 ± 2.9 |
32 ± 0.3 |
30 ± 0.3 |
|
Raw |
7 ± 0.2 |
18 ± 0.4* |
6 ± 0.1 |
8 ± 0.5* |
7 ± 0.1 |
14 ± 0.3* |
6 ± 0.5 |
8 ± 0.7* |
Table 1: Test of anesthesia ventilator during steps 1 and 2. Pressures were recorded at the Airway Opening (Pao) and at the trachea (Ptr) during Volume Controlled (VC-CMV) and Pressure Controlled (PC-CMV) Continuous Mandatory Ventilation. Recordings were performed at Baseline (B) and with the Fiber-optic Bronchoscope (FOB) inserted into the artificial trachea. PIP = Peak Inspiratory Pressure, Pplat = Plateau Pressure, VT = expired tidal volume, PEF = Peak Expiratory Flow, Cdyn = dynamic compliance and Raw = expiratory airway resistances. Results are expressed as mean (SD). * = p < 0.05 FOB vs baseline values Student t test with Bonferroni's correction.
|
Parameter |
ICU Ventilator |
|||||||
|
VC-CMV |
PC-CMV |
|||||||
|
Pao |
Ptr |
Pao |
Ptr |
|||||
|
B |
FOB |
B |
FOB |
B |
FOB |
B |
FOB |
|
|
PIP |
30 ± 1.3 |
35 ± 0.7* |
27 ± 0.2 |
26 ± 0.8 |
27 ± 1.3 |
34 ± 0.3* |
24 ± 0.7 |
25 ± 0.4 |
|
Pplat |
24 ± 0.6 |
28 ± 0.4* |
26 ± 0.4 |
25 ± 0.5 |
-- |
- |
- |
- |
|
VT |
419 ± 6 |
421 ± 5 |
411 ± 10 |
414 ± 8 |
420 ± 8 |
411 ± 12 |
419 ± 11 |
415 ± 4 |
|
PEF |
31 ± 1.2 |
20 ± 0.9* |
29 ± 0.4 |
24 ± 0.6* |
31 ± 1.5 |
20 ± 1.1* |
28 ± 0.7 |
24 ± 0.4* |
|
Cdyn |
24 ± 1.6 |
19 ± 2.3* |
32 ± 0.5 |
29 ± 0.9 |
32 ± 1.3 |
24 ± 1.7* |
31 ± 0.6 |
29 ± 0.6 |
|
Raw |
6 ± 0.3 |
13 ± 1.2* |
6 ± 0.6 |
7 ± 0.6 |
6 ± 0.4 |
11 ± 0.4* |
6 ± 0.5 |
7 ± 0.2 |
Table 2: Test of ICU ventilator during steps 1 and 2. Pressures were recorded at the airway opening (Pao) and at the trachea (Ptr) during Volume Controlled (VC-CMV) and Pressure Controlled (PC-CMV) Continuous Mandatory Ventilation. Recordings were performed at Baseline (B) and with the Fiber-optic Bronchoscope (FOB) inserted into the artificial trachea. PIP = Peak Inspiratory Pressure, Pplat = Plateau Pressure, VT = expired tidal volume, PEF = Peak Expiratory Flow, Cdyn = dynamic compliance and Raw = expiratory airway resistances. Results are expressed as mean (SD). * = p < 0.05 FOB vs baseline values Student t test with Bonferroni’s correction.
FOB significantly increased PIP at the airways opening when compared to baseline ventilation using VC-CMV (+ 37% for the anesthesia ventilator and + 17% for the ICU ventilator) and PC-CMV (+ 27% for the anesthesia ventilator and + 26% for the ICU ventilator). This effect was not observed at the trachea where Ptr remained mostly unchanged. The obstruction generated by the FOB decreased PEF at the airway opening and trachea in VC-CMV and PC-CMV (all p < 0.05; tables 1-2).
Figure 2 shows a representative example of the effect of the inserted FOB on pressure and flow tracings. Auto PEEP never exceeded 0.5 cm H2O in all conditions. The changes in pressure and flow induced by the FOB were associated with a significant decrease in Cdyn and increase in Raw measured at the airway opening in VC-CMV and PC-CMV. This effect was observed in the anesthesia and ICU ventilator alike. Cdyn showed no significant changes at the trachea whether the FOB was in place or not. Raw at the trachea, on the other hand, showed a small but significant increase with the FOB inserted only in the anesthesia ventilator (Tables 1 and 2).

Figure 2:Effect of Fiber-optic Bronchoscopy on flows and pressures.
Representative mechanical breathing cycles for each of the conditions studied. Flow (V) and pressure (Paw) signals were recorded at the airway opening and at the distal trachea during Volume Controlled (VC-CMV) and Pressure Controlled (PC-CMV) Continuous Mandatory Ventilation. Measurements were performed at baseline and with the Fiber-optic Bronchoscope (FOB) inserted into the artificial trachea. These steps were repeated using both, an anesthesia and an Intensive Care Unit (ICU) ventilator.
The effect of suctioning on airway pressure during protective mandatory ventilation was similar to the one observed in figure 3. In the anesthesia ventilator both, intermittent and continuous suctioning decreased end-expiratory pressures at the airway opening and at the trachea, from 10 to 0 cm H2O within a few breaths until the bellows of the anesthesia system emptied completely. Thereafter, with collapsed bellows, a negative pressure was immediately transmitted to the whole lung model reaching values of around - 20 cm H2O. In the ICU ventilator, suctioning decreased pressures at the airway opening and the trachea, resulting in an end-expiratory pressure above 0 in PC-CMV and one close to zero or slightly negative in VC-CMV (Figure 3 and Table 3).
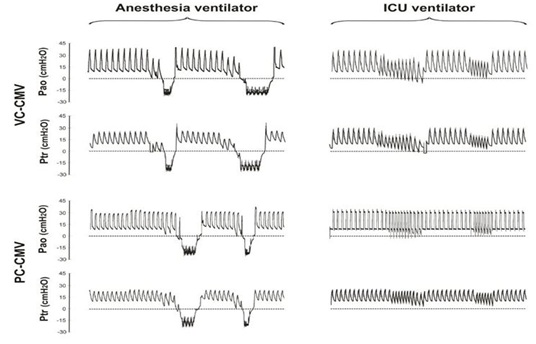
Figure 3: Fiber-optic Bronchoscopy suctioning during continuous mandatory ventilation.
Pressure time curves recorded during suctioning through the FOB during Volume Controlled (VC-CMV) and Pressure Controlled (PC-CMV) Continuous Mandatory Ventilation. Pressures were measured at the airway opening (Pao) and at the trachea (Ptr) during intermittent and continuous suctioning trials. During suctioning neither the anesthesia nor the Intensive Care Unit (ICU) ventilator could keep pressures at the target value. The suctioning effects were more pronounced with the anesthesia than the ICU ventilator.
FOB suctioning performed during CPAP applied by the anesthesia ventilator decreased pressures at the airway opening and the trachea until the bellows of the anesthesia system deflated completely (figure 4 and table 3). The ICU ventilator, however, kept the pressure at the airway opening unaltered while Ptr decreased by 2.5 cm H2O, only.
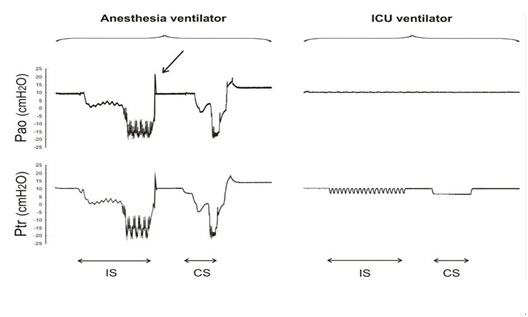
Pressures were measured at the airway opening (Pao) and at the trachea (Ptr) during CPAP at 10 cm H2O. The effect of Intermittent (IS) and Continuous (CS) Suctioning are depicted. The anesthesia ventilator was unable to keep CPAP at the target values during suctioning. The use of the O2 flush was necessary to restore the volume of the circular system and bellows prior to the CS trial (arrow). The intensive care ventilator (ICU) kept the set CPAP at the airway opening while tracheal pressures decreased by a mean value of 2.5 cm H2O during both suctioning trials.
|
Ventilator |
VC-CMV |
PC-CMV |
CPAP |
|
|
Anesthesia |
Pao (cm H20) |
-20.5 ± 1.3 |
-20.6 ± 1.6 |
-18.9 ± 0.4 |
|
Ptr (cm H20) |
-21.1 ± 1.0 |
-22.1 ± 0.6 |
-20.8 ± 0.7 |
|
|
ICU |
Pao (cm H20) |
2.0 ± 1.7 |
4.1 ± 1.0 |
9.9 ± 0.3 |
|
Ptr (cm H20) |
1.1 ± 1.1 |
3.0 ± 0.9 |
7.5 ± 0.4 |
|
Table 3: Lowest airway and tracheal pressure recorded during suctioning. Lowest expiratory pressures recorded at the airway opening (Pao) and at the trachea (Ptr) during Volume Controlled (VC-CMV) and Pressure Controlled (PC-CMV) Continuous Mandatory Ventilation as well as during Continuous Positive Airway Pressure (CPAP). Results are shown as mean (SD) values of six suctioning trials (intermittent and continuous suctioning repeated 3 times for each type of ventilation).
DISCUSSION
This bench test demonstrated that using an anesthesia machine FOB suctioning decreased Ptr to sub-atmospheric levels during both, continuous mandatory ventilation and CPAP modes. An ICU ventilator used during suctioning maintained Ptr slightly supra-atmospheric in PC-CMV but not in VC-CMV. Only the latter was capable of maintaining desired CPAP levels at the airway opening and the trachea within ± 2.5 cm H2O during FOB suctioning.
Published data demonstrate that the effect of suctioning depends on the net balance between the suctioning outflow and ventilator’s inspiratory inflow [18]. The pressure lost with VC-CMV and PC-CMV during FOB suctioning is an expiratory problem as the inspiratory valve is closed and the flow delivered by the ventilator is null [19].
CPAP, on the other hand, supplies gas flow any time airway pressure decreases thereby keeping airway pressures at the airway opening within the desired range. The principle of continuous gas insufflation during closed system suctioning in mechanically ventilated patients has previously been described [18,20,21]. Brochard et al., showed that a high O2 flow insufflation via small capillaries molded in the wall of a modified ETT prevented a fall in FRC and arterial oxygenation during suctioning in mechanically ventilated patients [20]. Reissmann et al., described in animals another approach in which a modified double-lumen tube allowed the tracheal suctioning via one lumen while keeping alveolar volume and pressure by applying CPAP though the other [21]. Our results on Ptr during CPAP were quite similar to the above studies but having the advantage of not requiring modifications of both, ETT and ICU ventilator. Similar to Stenqvist et al., [18] we found that Ptr decreased less than 3 cm H2O of the set pressure during FOB suctioning under CPAP delivered by an ICU ventilator.
The anesthesia and critical care ventilator performed unequally during FOB suctioning. These differences are explained by the technical features of both machines and the objectives of these different devices. The anesthesia workstation uses a microprocessor-driven flow control valve like many ICU ventilators. This work station is built around a multi-breaths standing bellows placed in series with the other components of the circular system. Flow and pressure sensors placed at the inspiratory and expiratory limbs determine the total flow rate and compensate for any deviation from the desired VT. This Smart Vent system (GE Healthcare, Madison, WI, US) allows optimum ventilation for small babies all the way up to morbid obese patients. Although this machine can deliver inspiratory flows of approximately 120 L/min, such flows depend on the amount of gas stored within the internal volume of the circular system and the bellows. Once FOB suctioning empties the bellows this machine is no longer able to deliver the set VT or to maintain the CPAP level, which allows the negative pressure to be transmitted directly to the lungs figures 3 and 4. Thus, our data demonstrate that an anesthesia machine with a bag in the box ventilatory system can easily fail during bronchoscopy.
The Taema Extend is an ICU ventilator capable of generating inspiratory flows of up to 200 L/min. During suctioning in controlled modes of ventilation, inspiratory VT is still delivered despite a progressive decrease in the expiratory VT and PEEP. Even though the performance of this ventilator was superior to that of the anesthesia machine, the progressive loss of tracheal pressure emptied the artificial lungs “FRC”. In the CPAP mode, however, this ICU ventilator maintained 10 cm H2O at the airway opening with a maximum drop in Ptr of 2.5 cm H2O. As the ventilator is controlled by the information received from the sensors placed within the device and not at the tracheal level the machine is not aware of the real Ptr. This technical limitation could be overcome simply by increasing the set CPAP by 2.5 cm H2O above the desired level of airway pressure (results not shown).
LIMITATIONS
We analyzed the performance of two standard anesthesia and ICU ventilators and, therefore, our results cannot be transferred to all ventilators in the market, which may have different technical and flow generation capabilities. We did not test different suctioning flows, ETTs or FOB sizes that would have change our results. Besides, this is a bench study where the effect of FOB suctioning on Ptr could be different than in real patients. For all these reasons the interpretation of our results should be done with caution.
CONCLUSIONS
During Fiber-optic Bronchoscopic suctioning both, standard anesthesia and ICU ventilators failed to maintain tracheal pressure with their continuous mandatory modes of ventilation. Only the ICU ventilator’s CPAP mode maintains tracheal pressure.
FUNDING
Departmental funding.
CONFLICT OF INTEREST
PK, ME, DL and SHB declare no conflict of interest; GT and FSS performed consultancy work for Getinge.
REFERENCES
- Snow N, Lucas AE (1984) Bronchoscopy in the critically ill surgical patient. Am Surg 50: 441-445.
- Dellinger RP, Bandi V (1992) Fiberoptic bronchoscopy in the intensive care unit. Crit Care Clin 8: 755-772.
- Sarkiss M (2011) Anesthesia for bronchoscopy and interventional pulmonology: from moderate sedation to jet ventilation. Curr Opin Pulm Med 17: 274-278.
- Lindholm CE, Ollman B, Snyder JV, Millen EG, Grenvik A (1978) Cardiorespiratory effects of flexible fiberoptic bronchoscopy in critically ill patients. Chest 74: 362-368.
- Jin F, Mu D, Chu D, Fu E, Xie Y, et al. (2008) Severe complications of bronchoscopy. Respiration 76: 429-433.
- Matsushima Y, Jones RL, King EG, Moysa G, Alton JDM (1984) Alterations in pulmonary mechanics and gas exchange during routine fiberoptic bronchoscopy. Chest 86: 184-188.
- Tusman G, Böhm SH, Warner DO, Sprung J (2012) Atelectasis and perioperative pulmonary complications in high-risk patients. Curr Opin Anaesthesiol 25: 1-10.
- Pavone LA, Albert S, Carney D, Gatto LA, Halter JM, et al. (2007) Injurious mechanical ventilation in the normal lung causes a progressive pathologic change in dynamic alveolar mechanics. Crit Care 11: 64.
- Slutsky AS, Ranieri VM (2013) Ventilator-induced lung injury. N Engl J Med 369: 2126-2136.
- Retamal J, Bergamini B, Carvalho AR, Bozza FA, Borzone G, et al. (2014) Non-lobar atelectasis generates inflammation and structural alveolar injury in the surrounding healthy tissue during mechanical ventilation. Crit Care 18: 505.
- Steinberg JM, Schiller HJ, Halter JM, Gatto LA, Lee HM, et al. (2004) Alveolar instability causes early ventilator-induced lung injury independent of neutrophils. Am J Respir Crit Care Med 169: 57-63.
- The National Heart, Lung, and blood Institute ARDS Clinical Trials Network. The Acute Respiratory Distress Syndrome Network (2000) Ventilation with lower tidal volumes as compared with traditional tidal volumes for acute lung injury and the acute respiratory distress syndrome. N Engl J Med 342: 1301-1308.
- Wolthuis EK, Choi G, Dessing MC, Dessing MC, Bresser P, et al. (2008) Mechanical ventilation with lower tidal volumes and positive end-expiratory pressure prevents pulmonary inflammation in patients without preexisting lung injury. Anesthesiology 108: 46-54.
- Serpa Neto A, Oliveira Cardoso S, Manetta JA, Pereyra VSM, Esposito DC, et al. (2012) Association between use of lung-protective ventilation with lower tidal volumes and clinical outcomes among patients without acute respiratory distress syndrome: a meta-analysis. JAMA 308: 1651-1659.
- Hemmes SNT, Serpa Neto A, Schultz MJ (2013) Intraoperative ventilator strategies to prevent postoperative pulmonary complications: a meta-analysis. Curr Opin Anesthesiol 26: 126-133.
- Neto AS, Hemmes SN, Barbas CS, Beiderlinden M, Fernandez-Bustamante A, et al. (2016) Association between driving pressure and development of postoperative pulmonary complications in patients undergoing mechanical ventilation for general anaesthesia: a meta-analysis of individual patient data. Lancet Respir Med 4: 272-280.
- Lachmann B (1992) Open up the lung and keep the lung open. Intensive Care Med 18: 319-321.
- Stenqvist O, Lindgren S, Kárason S, Sondergaard S, Lundin S (2001) Warning! Suctioning. A lung model evaluation of closed suctioning systems. Acta Anaesthesiol Scand 45: 167-172.
- Lindgren S, Odenstedt H, Olegard C, Sondergaard S, Lundin S, et al. (2007) Regional lung derecruitment after endotracheal suction during volume- or pressure-controlled ventilation: a study using electrical impedance tomography. Intensive Care Med 33: 172-180
- Brochard L, Mion G, Isabey D, Bertrand C, Messadi AA, et al. (1991) Constant-flow insuflation prevents arterial oxygen desaturation during endotracheal suctioning. Am Rev Respir Dis 144: 395-400.
- Reissmann H, Böhm SH, Suarez-Sipmann F, Tusman G, Buschmann C, et al. (2005) Suctioning through a double-lumen endotracheal tube helps to prevent alveolar collapse and to preserve ventilation. Intensive Care Med 31: 431-440.
Copyright: © 2019 Peter Kremeier, et al. This is an open-access article distributed under the terms of the Creative Commons Attribution License, which permits unrestricted use, distribution, and reproduction in any medium, provided the original author and source are credited.