Spiral Induced Epileptic Seizures
*Corresponding Author(s):
Rabinovitch ADepartment Of Physics, Ben-Gurion University Of The Negev, Beersheba, Israel
Tel:+972 6461172,
Email:avinoam@bgu.ac.il
Abstract
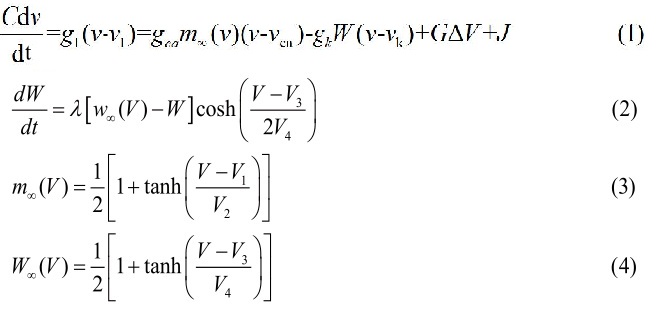
Comparing brain epilepsy to heart fibrillation and relying on the assumption that the latter is initiated by a rotor (spiral), we analyze a model of brain activity under spiral inducement. Existing mathematical models of neurological brain operation are rather complicated. Therefore, in agreement with Einstein’s razor, we use a model, based on the Morris-Lecar system of equations with diffusion. This model is relatively very simple but versatile enough to enable spatiotemporal responses and EEGs similar to the actual ones. The model is used to investigate brain response to an initial rotor and is shown to lead to epileptic-seizure like patterns.
Keywords
INTRODUCTION
Many models of spiral waves in brain tissues have appeared in the literature. Using nonlinear dynamics theory to explain the transition from normal behavior to epileptic one is already found in daSilve et al. [4]. A similar approach to ours appears in Ursino and La Cara [5], who used a simple integrate and fire model to simulate brain activity. See this reference also for a thorough review of previous attempts to explain epileptic brain activity. In rare cases, Ursino and La Cara [5] found the appearance of spiral waves under very strict conditions.
Most of the existing mathematical models of the brain function are rather complicated [6]. The models are classified by the authors of Wendling et al. [6], into the following categories: Neural mass models, neural field models, detailed networks and formal mathematical models. Most of the models use both high complexity and a relatively massive size of the interacting entities in the system, in an attempt to approach the natural situation. We have opted to use a relatively simple reaction-diffusion model based on a 2D Morris-Lecar system. This model was chosen in accordance with the Occam-Einstein Razor guide, namely to use the simplest approach which can explain the phenomena but not too simple, so that the important facts are not lost. We will show that our choice is indeed an effective one.
The model
Dynamics
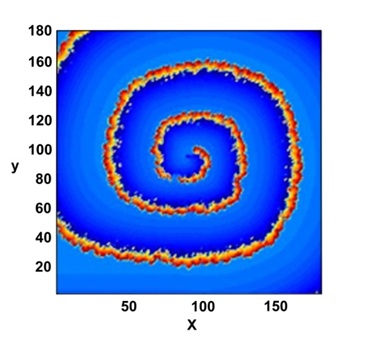
Figure 1: The lattice at time t=0. A rotating spiral is generated centered at x=y=0 2.

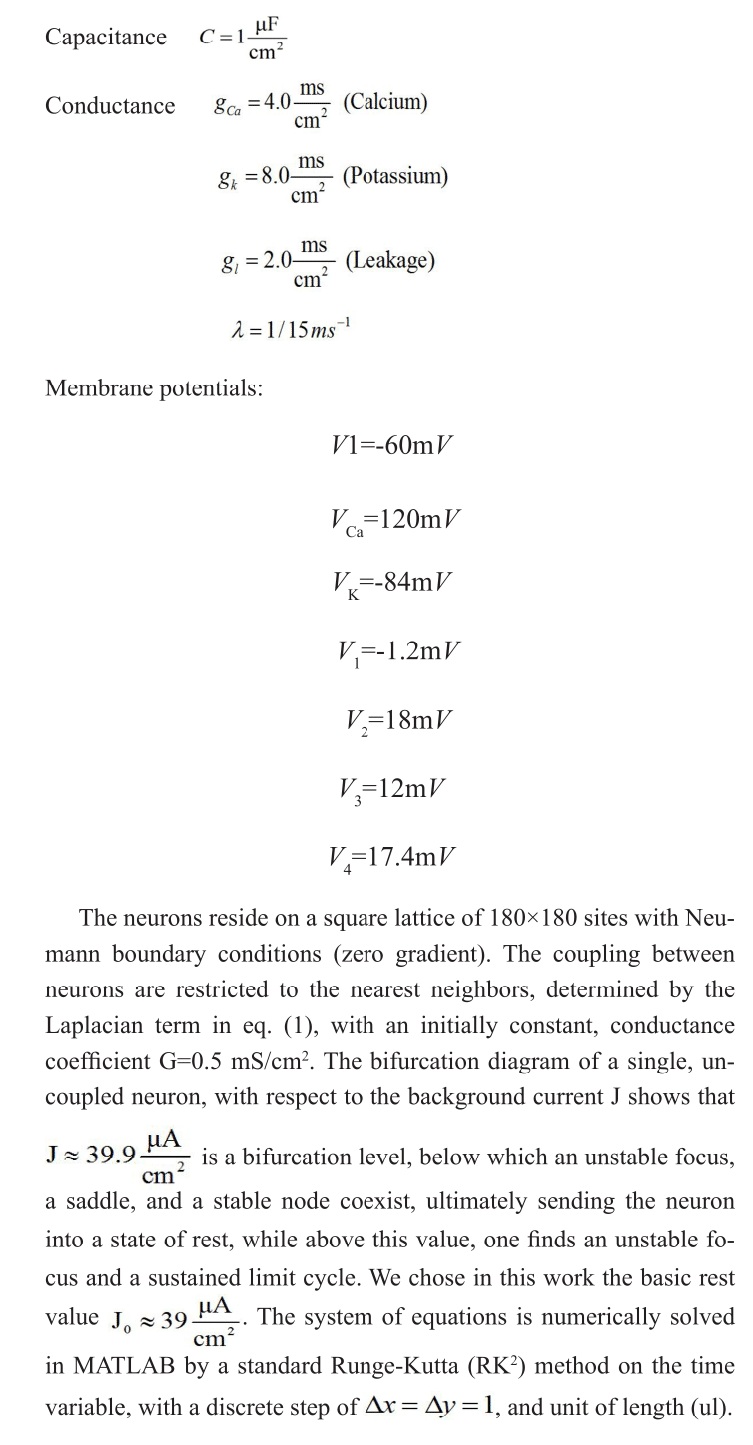
Figure 2: A set of selected, 2D maps of the potential V (x, y, t) observed a long time evolution. Probe center position marked by a cross.
After the spiral creation, the membrane stimulation current J=J0 is kept uniformly constant at all times.
The conductance G, defined above, is the only physical parameter to be modified several times on the run. The following random changes of conductance (G) are meant to simulate time changes of the brain activity. This is done here, every time, by two simultaneously operated, random procedures, as follows: one procedure uses 8 preset, equally spaced, time interval values in the range (100, 380) ms., while the other is based on a set of 10 conductance values G between 0.05 and 0.85mS/cm2. During the time evolution, each future time interval value is drawn randomly, at the end of the current one, from the uniform distribution of the elements in the interval set. Then, all 1802=32400 conductance values G are randomly reset in the following manner: Firstly draw uniformly one element from the set of G’s, which becomes the maximal G during this period of time. Next, construct a 180×180 matrix, containing randomly distributed positive numbers in (0,1). Finally, multiply this matrix by the drawn G, to obtain its distribution.
RESULTS AND DISCUSSION
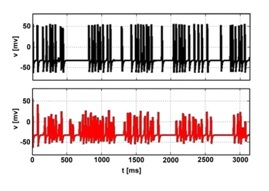
Figure 3: Time series of V (t) at the probe center x=150, y=24 single point (upper frame, black), and the averaged values in its 5×5 neighborhood (lower frame, red).
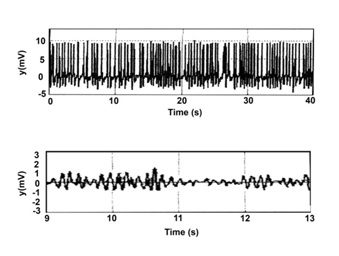
Figure 4: Time series of epileptic activities (modified from figure 3 c,d of Cao et al.) [10].
Note: similarity to forms of figure 3.
Regarding the possibility of a spiral being the epileptic driving force, we refer to the recent measurements reported by Viventi et al. [13], by using cortical surface electrodes recording from the exposed frontal lobes of cats in which electro graphic seizures were produced after GABA-mediated inhibition was inactivated by picrotoxin administration. These authors have shown that, at least for a limited period of time, spiral waves were observed on the brain surface during an epileptic ictal. Figure 5 compares the observed spiral to the core of the spiral of our model. Note that according to the present model the lifetime of the spiral is short which may explain its elusive behavior.
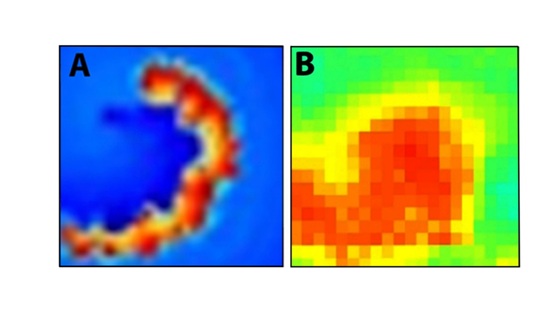
Figure 5: The core part of the model spiral. B: (adapted from figure 5b of Viventi et al. 2011) [13]. The snapshot of a spiral appearing during an epileptic seizure.
Also note that most of the recorded experimental results related to epilepsy rely on EEG measurements by a fixed number of electrical electrodes. Therefore, the spatial resolution of the outcomes is quite poor and observing a spiral or any other spatiotemporal phenomenon on the brain is almost impossible. Since using toxic voltage sensitive dyes on human brains is prohibited, it seems that direct measurement of spirals in human patients can be achieved only in the future. However, indirect effects as discussed here and animal models [13] do support our assumption.
The similarity of the obtained patterns here to those appearing in heart fibrillation is clear. Although our assumption was that these systems would behave in a similar manner, the actual results could not have been anticipated. Being based on such a crude model, these results should, of course, be taken with a grain of salt. Some inherent problems in using simple models to simulate the very intricate and complex brain behavior appear in Jun and Jun [14].
More experiments and calculations should be conducted in order to ascertain the validity of our assumption. For instance, it may be argued that spiral waves appear in the brain also during its regular function [15,16]; notably during a sleeping mode, not leading to a seizure; See also more recent spiral waves appearance in neural networks [17,18]. We think that a benign appearance of a spiral might be attributed to the existence of enough inhibitory neurons, which stop it in the bud in order to prevent malfunction.
In the heart, the havoc-causing spiral is thought to be initiated by a “reentry” or “re-entry circuit”, which deteriorates into a rotor. Some authors [19] postulate that a brain reentry circuit can by itself induce rapid oscillations in its vicinity, which are already the birthmarks of epileptic seizure. This assumption should be carefully investigated.
Finally, it is important to stress that the spiral action is the concluding driving force in the seizure genesis process. The necessary condition for the process is the reduction of the inhibitory neurons percentage [12].
SUMMARY
2. An initial spiral was introduced in the tissue and its neural connections were randomly changed according to several guidelines.
3. The ensuing 2D electronic patterns were calculated showing a breakup of the spiral and a recurrence of new shapes of local field potential on the tissue.
4. An “EEG” was detected at a specific location on the tissue both directly and as an average (“large” electrode) around the selected position.
5. The shapes of the “EEG’s” are shown to be similar to actual measurements in epileptic patients.
6. An actual spiral was experimentally observed during an epileptic seizure.
It is thus suggested that, under excitatory dominance, a spiral could be an initiator of an epileptic seizure.
ACKNOWLEDGEMENT
COMPETING INTERESTS
AUTHOR CONTRIBUTION
Dr.’s Aviram, Biton and Braunstein were responsible for the calculations.
REFERENCES
- Bonansco C, Fuenzalida M (2016) Plasticity of Hippocampal excitatory-inhibitory balance: Missing the synaptic control in the epileptic brain. Neural plasticity 2016: 8607038.
- Dehghani N, Peyrache A, Telenczuk B, Le Van Quyen M, Halgren E, et al. (2016) Dynamic balance of excitation and Inhibition in human and monkey neocortex. Scientific reports 6: 23176.
- Rodrigo M, Guillem MS, Climent AM, Pedron-Torrecilla J, Liberos A, et al. (2014) Body surface localization of left and right atrial high-frequency rotors in atrial fibrillation patients: A clinical-computational study. Heart rhythm 11: 1584-1591.
- Lopes da Silva F, Blanes W, Kalitzin SN, Parra J, Suffczynski P, et al. (2003) Epilepsies as dynamical diseases of brain systems: Basic models of the transition between normal and epileptic activity. Epilepsia 44: 72-83.
- Ursino M, La Cara GE (2006) Travelling waves and EEG patterns during epileptic seizure: Analysis with an integrate-and-fire neural network. J Theor Biol 242: 171-187.
- Wendling F, Benquet P, Bartolomei F, Jirsa V (2016) Computational models of epileptiform activity. J Neurosci Methods 260: 233-251.
- 7. Koch C, Segev I (1988) Methods in neuronal modeling: From ions to networks. MIT Press, Cambridge, USA.
- Ribeiro TL, Copelli M (2008) Deterministic excitable media under poisson drive: Power law responses, spiral waves, and dynamic range. Phys Rev E Stat Nonlin Soft Matter Phys 77: 051911.
- Yu-Ye L, Bing J, Hua-Guang G, Shu-Cheng A (2012) Parameter divesity induced multiple spatial coherence and spiral waves in neuronal network with and without Noise. Comm Theor Phys 57.
- Cao Y, Jin L, Su F, Wang J, Deng B (2016) Principal dynamic mode analysis of neural mass model for the identification of epileptic states. Chaos 26: 113118.
- Biton Y, Rabinovitch A, Braunstein D, Friedman M, Aviram I (2010) Sharp corners as sources of spiral pairs. Phys Lett A 374: 2248-2253.
- Wendling F, Bartolomei F, Bellanger JJ, Chauvel P (2002) Epileptic fast activity can be explained by a model of impaired GABAergic dendritic inhibition. Eur J Neurosci 15: 1499-1508.
- Viventi J, Kim DH, Vigeland L, Frechette ES, Blanco JA, et al. (2011) Flexible, foldable, actively multiplexed, high-density electrode array for mapping brain activity in vivo. Nat Neurosci 14: 1599-1605.
- Jun M, Jun T (2015) A review for dynamics of collective behaviors of network of neurons. Sci China Tech Sci 58: 2038-2045.
- Huang X, Troy WC, Yang Q, Ma H, Laing CR, et al. (2004) Spiral waves in disinhibited mammalian neocortex. J Neurosci 24: 9897-9902.
- Huang X, Xu W, Liang J, Takagaki K, Gao X, et al. (2010) Spiral wave dynamics in neocortex. Neuron 68: 978-990.
- Rostami Z, Jafari S (2018) Defects formation and spiral waves in a network of neurons in presence of electromagnetic induction. Cogn Neurodyn 12: 235-254.
- Wang P, Li QY, Tang GN (2018) Spontaneous generation of spiral wave in the array of Hindmarsh-rose neurons. Acta Physica Sinica 67: 030502.
- Simon A, Traub RD, Vladimirov N, Jenkins A, Nicholson C, et al. (2014) Gap junction networks can generate both ripple-like and fast ripple-like oscillations. Eur J Neurosci 39: 46-60.
Citation: Rabinovitch A, Aviram I, Biton Y, Braunstein D (2018) Spiral Induced Epileptic Seizures. J Brain Neursci 2: 003.
Copyright: © 2018 Rabinovitch A, et al. This is an open-access article distributed under the terms of the Creative Commons Attribution License, which permits unrestricted use, distribution, and reproduction in any medium, provided the original author and source are credited.