ABSTRACT
Background: Multifactorial liver cirrhosis leads to liver dysfunction and portal hypertension. Diagnosing the degree of disease is crucial for successful management; early diagnosis may reverse cirrhotic liver to normal architecture. Highly invasive liver biopsy is gold standard diagnostic tool with pain and complications. Components of Extra Cellular Matrix (ECM) may serve as indicator of severity of disease. Hence, the present study aimed to correlate serum levels of Hyaluronic Acid (HA), YKL-40 and uric acid with conventional markers of liver cirrhosis.
Methods: Blood samples were collected from cirrhotic liver (n=96) and age and gender matched healthy subjects (n=96) from Department of Medicine, RL Jalappa Hospital & Research Centre, Kolar, Karnataka, India. Serum was used to estimate HA, YKL-40, serum transaminases (Aspartate transaminase [AST] & Alanine Transaminase [ALT]), γ-Glutamyl Transferase (γGT), total protein, albumin, total bilirubin, uric acid, total antioxidant capacity and total oxidative stress. Plasma was used to estimate Prothrombin Time (PT) and International Normalized Ratio (INR) was calculated.
Results: Hyperuricemia with significant elevation of serum HA and YKL-40 levels in cirrhotic liver compared to healthy subjects were observed. There was an increase in total oxidative stress with decreased antioxidant capacity in liver cirrhotic compared to healthy subjects. Serum levels of HA and YKL-40 were positively correlated with activities of AST, ALT and γGT with concentrations of total bilirubin, total oxidative stress and PT INR. Negative correlation was observed between serum levels of uric acid, HA and YKL-40 to serum levels of total protein, albumin and total antioxidant capacity.
Conclusion: Components of ECM turn over viz., HA and YKL-40 expression increased during disease progression and can serve as direct biomarkers of liver cirrhosis which needs to be validated in diverse population. Hyperuricemia with elevated liver enzymes activity lead to poor prognosis.
KEYWORDS
Endothelial dysfunction; HMGB1/RAGE signaling pathway; Hyaluronic acid; Hyperuricemia; Inflammatory cytokines; YKL-40
Introduction
Liver cirrhosis is a natural wound healing response to chronic liver injury which leads to development of fibrotic scar surrounded by regenerative nodules results in portal hypertension and hepatic encephalopathy; end stage liver disease [1]. Despite multifactorial; the pathological characteristics which include degeneration, necrosis of hepatocytes, replacement of liver parenchyma by fibrotic tissue and regenerative nodular formation are common in cirrhosis. Defenestration and capillarization of liver sinusoidal endothelial cells are also major contributing factors for hepatic dysfunction [2]. In cirrhotic liver, the Extra Cellular Matrix (ECM) produced by myofibroblasts which are trans-differentiated from activated Hepatic Stellate Cells (HSCs) differs qualitatively and quantitatively compared to normal liver. An increase in fibril and non fibril forming collagens along with glycoproteins, proteoglycans and glycosaminoglycans reflects ECM turnover and serve as direct biomarkers for severity of cirrhosis [3].
Inflammatory factors [Tumor Necrosis Factor α (TNF- α) and interleukins] induced oxidative and apoptotic stress are important features for liver fibrosis/cirrhosis progression which results in uric acid production, an end product of purine metabolism [4]. Hyperuricemia, increased degradation of nuclear material cause endothelial dysfunction, insulin resistance, oxidative stress and systemic inflammation (metabolic syndrome) which are risk factors for hepatic damage [5]. High levels of uric acid lead to disease progression and elevation of liver enzymes activity in circulation resulting in poor prognosis of the disease [6].
Hyaluronic Acid (HA), a high molecular non-sulfated glycosaminoglycan is synthesized by synovial cells and HSCs by enzyme hyaluronic acid synthase and degraded by sinusoidal endothelial cells of liver [7]. HA plays a vital role in the formation of ECM during progression of cirrhosis. Inflammatory mediated cytokine transdifferentiation of HSCs into myofibroblasts during disease progression may alter serum HA levels which indicates severity of the disease [8].
YKL-40 (Chitinase-3-like protein 1, chondrex, breast regression protein-39 and human cartilage glycoprotein-39) is a secreted heparin binding glycoprotein [9]. It is one of the 18 glycosyl hydrolases, with no enzymatic activity due to mutations within active site. YKL-40 biological role still remains unclear but may play an important role in inflammation, proliferation and angiogenesis [10,11]. Levels of YKL-40 are enhanced in inflammation, increased extracellular remodeling, fibrosis, cancer, heart failure and ischemic cerebrovascular disease [9]. YKL-40 acts as a chemoattractant for endothelial cells which can modulate angiogenesis during tissue repair. It is secreted by activated macrophages mediated by proinflammatory cytokines and expressed in human liver [12].
Diagnosing the degree of hepatotoxicity is crucial for therapeutic management of cirrhosis; early diagnosis may help reversing cirrhotic liver to normal liver architecture. Liver biopsy is considered the gold standard method; it is an invasive procedure associated with pain and complications. Existing biomarkers for cirrhosis in clinical practice have narrow applicability; unable to predict etiology (specificity) and distinguish intermediate stages (sensitivity). Ideal biomarker should be organ specific, sensitive to indicate active damage, easily accessible in peripheral tissue, cost effective; should give insights for tailor made therapy for effective clinical management of the disease [3]. Hence, the present study aimed to correlate serum levels of uric acid, HA and YKL-40 with conventional markers of liver cirrhosis.
Materials and Methods
Samples
Blood samples were collected from clinically and diagnostically proven cirrhotic liver subjects with varying degree from the subjects registered in the Department of Medicine, RL Jalappa Hospital & Research Centre attached to Sri Devaraj Urs Medical College, A constituent of Sri Devaraj Urs Academy of Higher Education and Research, Kolar, Karnataka, India. Individuals diagnosed with cirrhosis caused by different etiologies viz., Alcoholic Liver Diseases (ALD), viral hepatitis caused by Hepatitis C and B (HCV & HBV) and Non-Alcoholic Fatty Liver Disease (NAFLD) based on clinical symptoms viz., ascites, encephalopathy, jaundice and altered biochemical parameters were included. Individuals with diabetes and/or its complications, myocardial infarction, acute and chronic renal failure, pneumonia and cancer and individuals on thrombolytic therapy were excluded from the study.
Collection of blood samples from cirrhotic liver (n=96) and age and gender matched healthy subjects (n=96) were carried out after obtaining informed consent and the study is approved by institutional ethical committee (DMC/KLR/IEC/61/2016-17). Venous blood, 5ml from antecubital vein in comfortable position of subject (cirrhotic and healthy) was collected; 2.0 ml of blood was transferred into sodium citrate tube and 3 ml into serum separator tube.
Serum separation
Serum was collected from clotted blood using serum separator tubes centrifuged at 4000 rpm for 10 min. Serum and citrate blood were stored at -20oC for further analysis. Serum was used to estimate biochemical parameters; serum transaminases [Aspartate Transaminases (AST) and Alanine Transaminases (ALT)], γ-Glutamyl Transferase (γGT), total protein, albumin, total bilirubin, uric acid, total antioxidant capacity and total oxidative stress. Plasma was used to estimate Prothrombin Time (PT) and International Normalized Ratio (INR) was calculated.
Determination of proteins concentration and enzyme activities
Hyaluronic acid and YKL-40 were estimated by ELISA quantikine kits procured from R&D Systems, USA. Activity of liver enzymes viz., AST, ALT and γGT were estimated by IFCC (International Federation of Clinical Chemistry) kinetic method. Concentrations of total protein and albumin were estimated by biuret and bromocresol green method respectively. Total bilirubin was estimated by diazo method and uric acid was estimated by uricase enzymatic end point method. Total oxidative status and total antioxidant capacity were estimated by colorimetric method. PT was estimated by coagulation method and INR was calculated.
Statistical analysis
Statistical analysis was performed by using institutional licensed version of IBM SPSS 20. Descriptive statistics were represented in terms of mean and standard deviation. Comparison for quantitative variables between groups for significance was done by using Student t-test. Pearson correlation was used to assess the relation between quantitative measures. One way ANOVA test was performed to find out difference of variables (HA and YKL-40) between cirrhotic liver subjects with varied etiology. Area Under Receiver’s operating Characteristics (AUC) curve was analyzed to find out the diagnostic accuracy of HA and YKL-40.
Results
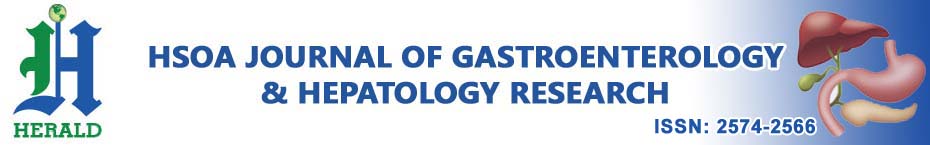
In the present study, cirrhotic liver subjects were in the age group of 25 to 65 years with a mean age of 43.27 ± 8.56; 78% (n=75) were males while 22% were females (n=21) with varying degree and different etiological factors (Figure 1).
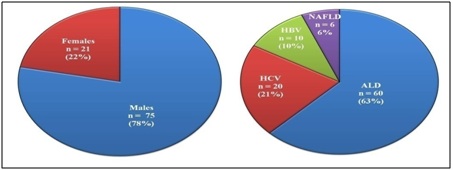
Significant elevation was observed for the variables serum HA (22.84 ± 6.11 Vs 7.99 ± 3.02), YKL-40 (140.72 ± 23.93 Vs 29.93 ± 6.64) and uric acid (6.11 ± 0.67 Vs 3.56 ± 0.50) in cirrhotic liver compared to healthy subjects (Figure 2).
Significant increase in activity of AST, ALT and γGT with increased serum total bilirubin and prolonged PT INR were observed in cirrhotic liver than healthy subjects. Serum total protein and albumin were reduced significantly in cirrhotic liver compared to healthy subjects. In cirrhotic liver there was an increase in total oxidative status (33.27 ± 6.05 Vs 12.18 ± 3.59) with decreased antioxidant capacity (20.75 ± 4.97 Vs 33.37 ± 5.95) compared to healthy subjects (Table 1).
Pearson correlation analysis showed positive correlation between serum levels of uric acid, HA and YKL-40 with activities of AST, ALT and γGT with serum levels of total bilirubin, PT INR and total oxidative status. A negative correlation was observed between serum levels of uric acid, HA and YKL-40 with total protein, albumin and total antioxidant capacity (Tables 2A, 2B and 2C).
Among cirrhotic liver subjects, one way ANOVA analysis showed high levels of serum HA (24.41 ± 6.46) in ALD subjects compared to HCV (21.26 ± 5.00), HBV (18.00 ± 2.84) and NAFLD (20.49 ± 3.94) subjects. YKL-40 was expressed high in ALD (149.80 ± 20.53) compared to HCV (129.71 ± 19.59), HBV (115.41 ± 22.19) and NAFLD (128.79 ± 25.21) subjects (Table 3).
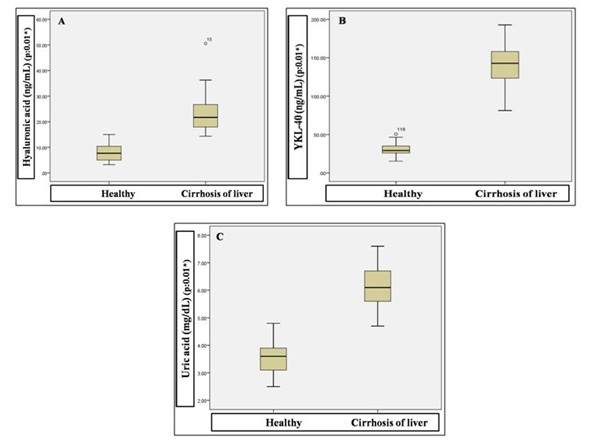
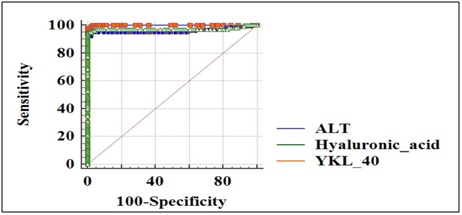
ROC analysis was carried out to define the diagnostic accuracy for serum HA and YKL-40 in cirrhotic liver subjects. Serum HA with an AUC of 0.961 (95% CI) with sensitivity 95.05% and specificity 97.80% and YKL-40 with an AUC of 0.973 (95% CI) with sensitivity 95% and specificity 99% compared with that of ALT with an AUC of 0.999 were observed (Figure 3).
Discussion
Till date, liver biopsy is the gold standard tool for diagnosis and distinguishes between intermediate stages of liver fibrosis and cirrhosis [13]. Highly invasive liver biopsy involves pain and complications with approximately 0.01% mortality rate [14]. Indirect biomarkers which are reflection of liver dysfunction have narrow applicability in clinical practice due to lack of sensitivity and specificity. Direct biomarkers which reflect ECM turnover needs validation in large population studies in diverse geographical settings [3]. Serum levels of HA and YKL-40 which are crucial components of ECM in disease progression may reflect severity of the disease [12]. In present study, we examined diagnostic value of serum HA and YKL-40 by correlating with conventional markers of liver cirrhosis.
Afzali et al., in their large cohort study reported novel association of hyperuricemia and the incidence of cirrhosis development and risk of cirrhosis related hospitalization or death with elevated activities of ALT and γGT which are markers of hepatic necroinflammation in US population [6]. In Indian population, Paul et al., in their study found that hyperuricemia reflects oxidative stress and is associated with disease progression which can serve as surrogate marker for CLD with varied etiology [5]. Xie et al., documented crucial role of hyperuricemia is an important independent risk factor for NAFLD in Chinese population [4]. Shih et al., observed significant association between serum uric acid levels and NAFLD among US population; independent of multiple metabolic risk factors [15].
In the present study, significant elevation of uric acid in cirrhotic liver subjects was observed compared to healthy subjects. Significant elevation of uric acid, an end product of purine metabolism by cellular destruction is a mediator of inflammation and tissue damage [16]. In chronic liver injury, uric acid activates inflammosome (inflammatory cytokines and Nuclear Factor-ĸB [NF-ĸB]) and promotes surrounding liver parenchymal damage which in turn leads to hepatic dysfunction [17]. Hepatic depletion of Adenosine Triphosphate (ATP) increases uric acid production leading to hepatocellular injury; reduction in protein synthesis, induces inflammation and pro-oxidative changes which elevates liver enzymes activity in circulation [15]. Hyperuricemia results in oxidative stress mediated metabolic syndrome which are associated with progression of chronic liver disease. Uric acid levels can enhance the inflammatory cytokines viz., interleukin-1 (IL-1), IL-6, IL-10, IL-18 and TNF-α resulting in pro-inflammation for disease progression. Hyperuricemia may alter expression of endothelin-1 which promotes disease and stimulates innate immune response [18].
Resino et al., documented the increase in accuracy of serum hyaluronic acid with hepatic fibrotic stages in HIV-HCV coinfected patients [19]. Peters et al., in their large cohort study, demonstrated that baseline hyaluronic acid is a strong predictor of liver related deaths in HIV-1 patients coinfected with HBV and/or HCV [20]. Gudowska et al., concluded that concentrations of serum hyaluronic acid are elevated in liver diseases and should be considered as a good noninvasive biomarker for diagnosis of liver damage [8].
In our study, there was a significant elevation of serum hyaluronic acid in cirrhotic liver subjects with varied etiology compared to healthy subjects. Among cirrhotic liver subjects, high levels of HA in ALD suggests that the degree of necroinflammation will be varied in different etiologies and it is high in alcohol induced liver injury. HA is produced from activated HSCs after transdifferentiate into myofibroblasts due to inflammation mediated by complex cytokine network [21]. Elevated levels of HA in cirrhotic liver subjects is due to imbalance between synthesis from fibrogenesis and decrease in fibrolysis during the disease progression, dysfunction of sinusoidal endothelial cells leads to reduction in degradation of HA resulting in elevated levels in circulation [8,22].
Damaged hepatocytes release Reactive Oxygen Species (ROS) and fibrogenic mediators which in turn stimulate inflammatory cells leads to cell damage [3]. Decreased hepatic ATP and cell damage result in increased uric acid production which lead to histological liver injury [23]. Elevated uric acid inhibits endothelial Nitric Oxide Synthase (eNOS) expression which results in reduction of Nitric Oxide (NO) release and bioavailability in endothelial cells [24]. Hyperuricemia induced down regulation of eNOS results in oxidative stress and activates inflammatory cytokines IL-6 and TNF-α by stimulating HMGB1/RAGE (High Mobility Group Box chromosomal protein1/Receptor for Advanced Glycation End products) signaling pathway results in endothelial dysfunction [25]. Accumulation of HA due to increased synthesis and decreased degradation leads to significant elevation which acts as an indicator of severity of the disease.
Study conducted by Saitou et al., demonstrated that serum YKL-40 measurements reflects liver fibrogenesis in HCV patients; serve as serological marker for evaluating the effectiveness of therapy [12]. Kumugai et al., showed that YKL-40 secretion by macrophages was upregulated by TNF-α and IL-1β, proinflammatory cytokines which are involved in the pathogenesis of NAFLD [26]. In large cohort study, Kjaergaard et al., documented increased expression of YKL-40 in chronic alcoholic liver subjects compared to healthy subjects [27].
In the present study, we observed serum YKL-40 significantly elevated in cirrhotic liver compared to healthy subjects; concentrations may be useful noninvasive tool for diagnosis of liver cirrhosis. YKL-40 is expressed from macrophages, chondrocytes, synovial cells, vascular smooth muscle cells and HSCs [28]. Non-enzymatic heparin binding glycoprotein, YKL-40 involves in cell proliferation, inflammation and remodeling of ECM [26]. In liver, it modulates angiogenesis by acting as chemo-attractant for endothelial cells. YKL-40 is a growth factor for fibroblasts [29]. During disease progression, macrophages will increase which in turn secrete YKL-40 regardless of etiology of the disease. Enhanced expression of YKL-40 by activated macrophages is mediated by proinflammatory cytokines TNF-α and IL-1β [26]. Inflammatory YKL-40 plays a key role in fibrogenesis of liver; elevated levels of YKL-40 indicate the disease severity [9,26].
Future Directions
Possibilities of combinatorial use of biomarkers and to define cut off values and new scores with the help of biomarkers validated in this study may distinguish different stages of liver cirrhosis. Variations in concentrations of biomarkers required to be validated in different (sub and stratified) population; gender variation needs to be checked. Physiological, pathological and habitual factors which may affect the concentrations of hyaluronic acid and YKL-40 have to be ruled out.
Conclusion
Elevated activity of liver enzymes and prolonged PT INR along with hyperuricemia lead to poor prognosis. Elevated HA levels suggest that there will be increased synthesis and decreased degradation which leads to accumulation of HA in ECM. An elevated level of YKL-40 is an indicator of inflammation. Components of ECM turn over viz., HA and YKL-40 expression increased during progression of disease and can serve as direct biomarkers for liver cirrhosis which needs to be validated in different population.
Conflict of Interest:
Hyperuricemia along with elevated liver enzymes and PT INR lead to poor prognosis. Elevated HA levels suggest that there will be increased synthesis and decreased degradation which leads to accumulation of HA in ECM. An elevated level of YKL-40 is an indicator of inflammation. Components of ECM turn over viz., HA and YKL-40 expression increased during progression of disease and can serve as direct biomarkers for liver cirrhosis which needs to be validated in different population.
Figures
Figure 1: Demographic representation of liver cirrhosis subjects based on gender & etiology.
ALD: Alcoholic Liver Disease; HCV: Hepatitis C Virus; HBV: Hepatitis B Virus; NAFLD: Non-Alcoholic Fatty Liver Disease.
Figure 2: Comparison of serum hyaluronic acid (A), YKL-40 (B) and uric acid (C) concentrations between healthy and cirrhosis of liver subjects.
Figure 3: ROC analysis; comparison of AUC curve for Hyaluronic acid (0.961) and YKL-40 (0.973) with ALT.
Tables
Variable | Groups | Varied Etiology | Total (n=96) |
ALD (n=60) | HCV (n=20) | HBV (n=10) | NAFLD (n=6) |
Hyaluronic acid (ng/mL) 0.001* | II | 24.41 ± 6.46 | 21.26 ± 5.00 | 18.00 ± 2.84 | 20.49 ± 3.94 | 22.84 ± 6.11 |
I | 8.17 ± 3.08 | 7.57 ± 3.00 | 7.89 ± 2.92 | 7.67 ± 3.21 | 7.99 ± 3.02 |
YKL-40 (ng/mL) 0.001* | II | 149.80 ± 20.53 | 129.70 ± 19.59 | 115.40 ± 22.19 | 128.79 ± 25.21 | 140.7 ± 23.93 |
I | 29.20 ± 6.42 | 31.25 ± 6.11 | 29.53 ± 7.85 | 33.43 ± 8.50 | 29.93 ± 6.64 |
AST (U/L) | II | 216.13 ± 60.53 | 188.75 ± 41.09 | 205.10 ± 29.94 | 243.33 ± 51.50 | 209.94 ± 55.70 |
I | 38.90 ± 15.39 | 35.75 ± 15.59 | 35.60 ± 7.22 | 39.50 ± 9.35 | 37.93 ± 14.41 |
ALT (U/L) | II | 268.25 ± 61.38 | 260.90 ± 38.79 | 268.50 ± 23.32 | 284.83 ± 53.46 | 267.78 ± 53.58 |
I | 33.25 ± 13.50 | 36.65 ± 23.59 | 33.40 ± 16.64 | 30.83 ± 5.70 | 33.82 ± 15.96 |
γGT (U/L) | II | 259.03 ± 66.67 | 272.05 ± 60.94 | 293.10 ± 90.19 | 327.00 ± 54.75 | 269.54 ± 69.06 |
I | 37.10 ± 14.12 | 42.00 ± 17.14 | 36.20 ± 6.35 | 31.66 ± 7.78 | 37.68 ± 14.01 |
Total Protein (g/dL) | II | 4.83 ± 0.47 | 5.10 ± 0.72 | 5.46 ± 0.95 | 5.18 ± 0.59 | 4.97 ± 0.62 |
I | 6.97 ± 0.34 | 6.91 ± 0.29 | 6.78 ± 0.37 | 6.90 ± 0.42 | 6.93 ± 0.34 |
Albumin (g/dL) | II | 2.47 ± 0.35 | 2.63 ± 0.40 | 2.89 ± 0.63 | 2.65 ± 0.33 | 2.56 ± 0.41 |
I | 3.94 ± 0.35 | 4.01 ± 0.34 | 3.76 ± 0.32 | 4.10 ± 0.44 | 3.94 ± 0.35 |
Total Bilirubin (mg/dL) | II | 5.88 ± 1.32 | 4.50 ± 1.29 | 4.24 ± 1.09 | 5.58 ± 2.09 | 5.40 ± 1.49 |
I | 0.80 ± 0.25 | 0.71 ± 0.19 | 0.63 ± 0.18 | 0.81 ± 0.24 | 0.77 ± 0.24 |
Uric acid (mg/dL) 0.001* | II | 6.30 ± 0.59 | 5.86 ± 0.75 | 5.77 ± 0.62 | 5.56 ± 0.57 | 6.11 ± 0.67 |
I | 3.66 ± 0.49 | 3.32 ± 0.42 | 3.33 ± 0.39 | 3.68 ± 0.76 | 3.56 ± 0.50 |
PT INR | II | 2.63 ± 0.54 | 2.55 ± 0.42 | 2.50 ± 0.36 | 2.26 ± 0.45 | 2.57 ± 0.50 |
I | 1.09 ± 0.13 | 1.03 ± 0.15 | 1.06 ± 0.17 | 1.13 ± 0.10 | 1.08 ± 0.14 |
TAC (nmol/µL) 0.001* | II | 20.15 ± 4.43 | 20.81 ± 6.59 | 22.28 ± 4.60 | 24.02 ± 3.52 | 20.75 ± 4.97 |
I | 33.70 ± 6.21 | 32.83 ± 5.32 | 32.93 ± 6.22 | 32.60 ± 5.95 | 33.37 ± 5.95 |
TOS (µmol H2O2 Equiv/L) 0.001* | II | 32.82 ± 4.94 | 31.83 ± 6.17 | 37.90 ± 10.34 | 34.82 ± 3.91 | 33.27 ± 6.05 |
I | 12.48 ± 3.55 | 12.36 ± 4.05 | 9.93 ± 3.33 | 12.30 ± 1.65 | 12.18 ± 3.59 |
Table 1: Statistical analysis of biochemical parameters (liver cirrhosis with varied etiology vs. healthy subjects)
*Sig (2-tailed) p < 0.05: Significant.
Data were presented as numbers and mean ± SD; Group II: Clinically and diagnostically proven liver cirrhotic subjects; Group I: Healthy subjects; SD: Standard Deviation; ALD: Alcoholic Liver Disease; HCV: Hepatitis C Virus; HBV: Hepatitis B Virus; NAFLD: Non Alcoholic Fatty Liver Disease; AST: Aspartate Transaminase; ALT: Alanine Transaminase; γGT: Gamma Glutamyl Transferase; TAC: Total Antioxidant Capacity; TOS: Total Oxidative Status; PT INR: Prothrombin Time International Normalized Ratio.
aCalculated from Equation (2), bEstimated from 1H NMR, cEstimated from GPC, dEstimated from DLS.
Variable | Correlation | AST | ALT | γGT | TP | ALB | TB | UA | PT INR | TAC | TOS |
Hyaluronic acid (ng/mL) | Pearson Correlation | 0.74** | 0.77** | 0.78** | -0.79** | -0.78** | 0.81** | 0.79** | 0.75** | -0.67** | 0.77** |
Sig (2-tailed) | 0.001 | 0.001 | 0.001 | 0.001 | 0.001 | 0.001 | 0.001 | 0.001 | 0.001 | 0.001 |
n | 192 | 192 | 192 | 192 | 192 | 192 | 192 | 192 | 192 | 192 |
Table 2A: ** Correlation is significant at the 0.01 level (2-tailed).
Correlation of hyaluronic acid with other biochemical parameters.
Variable | Correlation | AST | ALT | γGT | TP | ALB | TB | UA | PT INR | TAC | TOS |
YKL40 (ng/mL) | Pearson Correlation | 0.87** | 0.89** | 0.87** | -0.88** | -0.86** | 0.93** | 0.92** | 0.86** | -0.73** | 0.86** |
Sig (2-tailed) | 0.001 | 0.001 | 0.001 | 0.001 | 0.001 | 0.001 | 0.001 | 0.01 | 0.001 | 0.001 |
n | 192 | 192 | 192 | 192 | 192 | 192 | 192 | 192 | 192 | 192 |
Table 2B: ** Correlation is significant at the 0.01 level (2-tailed).
Correlation of YKL-40 with other biochemical parameters.
Variable | Correlations | AST | ALT | γGT | TP | ALB | TB | PT INR | TAS | TOS |
Uric acid (mg/dL) | Pearson Correlation | 0.84** | 0.86** | 0.83** | -0.82** | -0.79** | 0.90** | 0.85** | -0.70** | 0.84** |
Sig. (2-tailed) | 0.001 | 0.001 | 0.001 | 0.001 | 0.001 | 0.001 | 0.001 | 0.001 | 0.001 |
N | 192 | 192 | 192 | 192 | 192 | 192 | 192 | 192 | 192 |
** Correlation is significant at the 0.01 level (2-tailed) |
Table 2C: ** Correlation is significant at the 0.01 level (2-tailed).
Correlation of uric acid with other biochemical parameters.
AST: Aspartate Transaminase; ALT: Alanine Transaminase; γGT: Gamma Glutamyl Transferase; TP: Total Protein; ALB: Albumin; TB: Total Bilirubin; UA: Uric Acid; PT INR: Prothrombin Time International Normalized Ratio; TAC: Total Antioxidant Capacity; TOS: Total Oxidative Status.
Variables | Groups | Mean ± SD | Std. Error | Sig |
Hyaluronic acid (ng/mL) | 1 (n=60) | 24.41 ± 6.46 | 0.83 | 0.005* |
2 (n=20) | 21.26 ± 5.00 | 1.12 |
3 (n=10) | 18.00 ± 2.84 | 0.89 |
4 (n=6) | 20.49 ± 3.94 | 1.61 |
YKL-40 (ng/mL) | 1 (n=60) | 149.80 ± 20.53 | 2.65 | 0.001* |
2 (n=20) | 129.71 ± 19.59 | 4.38 |
3 (n=10) | 115.41 ± 22.19 | 7.01 |
4 (n=6) | 128.79 ± 25.21 | 10.29 |
Table 3: Post Hoc and Bonferroni test for ANOVA analysis; comparison of hyaluronic acid and YKL-40 between cirrhotic liver groups with varied etiology.
Group 1: Alcoholic Liver Disease; Group 2: Hepatitis C; Group 3: Hepatitis B; Group 4: Non Alcoholic Fatty Liver Disease; n: Sample number; SD: Standard Deviation.