ABSTRACT
India is well known for its cultural, social, ecological and genetic diversity in South Asia. Uttar Pradesh and Bihar states were one of oldest population habitat in central east region of India. In the present study, we explored pigmentation (melanin index) diversity of 6872.649 km2 and 2736.333 km2 regions of Uttar Pradesh and Bihar states of India respectively. We found high pigmentation diversity and wide presence of major mitochondrial haplogroups in small region of Indian subcontinent, which might be true for all geographical region of South-Asia. Further, we correlated the melanin index with social status (General (GN), Other Backward Classes (OBC) and Scheduled Castes (SC)) and mitochondrial haplogroups. The melanin index is marginally different between OBC and SC (p = 0.0142) while significantly different from GN vs OBC (p = 3.33 × 10⁻¹²) and GN vs SC (p < 2 × 10-16). We did not observe any significant differences between melanin index of one haplogroup against another haplogroup; (a) M vs U, p = 0.0845, (b) M vs R, p = 0.895, (c) M vs L, p = 0.513, (d) U vs R, p = 0.258, (e) U vs L, p = 0.635 and (f) R vs L, p = 0.613. Our study reveals that cast populations of central east India, represent significantly different melanin index and diverse mitochondrial haplogroup. Our study signifies that mitochondrial haplogroups, do not have any genetic influence on melanin index. However, further study on larger cohort, will elucidate, more about diversity and pigmentation relation in India.
Introduction
Indian subcontinent represents 1/6 of total world population. India is well known for its cultural, social and ecological diversity. It is also one of the most genetically diverse geographical regions, which consists of 4,635 anthropologically well-defined groups, who were following endogamy marriage practices from thousands of years [1-3].
Geographical regions of India, Sri Lanka, Myanmar, Bangladesh, Bhutan, Nepal, Tibet (China), Afghanistan and Pakistan constitute together the Indian subcontinent regions. Indian subcontinent also referred as South Asian region and encompasses the highest genetic diversity after Africa. This is because, during the out of Africa migration of Homo sapiens, the Indian subcontinent has acted as an incubator for populations, who then spread and colonized the world [1-3]. Being the central of these countries, India is considered as a major corridor for the dispersal of modern human [1-3]. It has been studied that Indian populations largely constitute the same gene pool [2-5].
In population genetic studies, we study several populations based on their genetic characteristics. Here we study the DNA marker based on mitochondrial Hyper Variable Region (HVR). We study mitochondrial markers to find out genetic diversity and evolutionary process among populations [6]. Indian population is complex in terms of diversity of languages affiliation, ancestry and various other phenotype parameters [1,2]. Human genetics and environment plays together for shaping skin pigmentation variations. Whatever huge pigmentation variation we observed across the world, is largely shaped by different levels of UV radiations [7]. Pigmentation studies were helpful in understanding the evolutionary processes. Study shows that role of melanin is very important in pigmentation variation, where it is performing dual role and make delicate balance between the skin being light enough at low UVR zones (to allow sufficient production of vitamin D) and dark enough at high UVR zones (for protection against sun burn and degradation of folate) [8-10]. Any imbalance between these dual procedures would have wide-range of effects on human health (reproductive fitness, skin cancer, anaemia, fetal abnormalities, spermatogenesis, rickets and vitamin D deficiency) [9].
There were several pigmentation studies revealing association with pigmentation candidate gene in South Asia and they have approved the act of natural selection process of human populations [7-12]. Previous report, observed the significant association with rs1426654, with skin pigmentation in populations living specifically in India [8]. Recent study on same region (middle gangetic regions of central east part of India) had well established the association with pigmentation diversity and the populations [13,14]. The central east region of India is one of the most fertile and densely populated regions (http://www.censusindia.gov.in). This region represents more than hundreds ethnic groups and considered as a one of the oldest continuously inhabited places in the world [15]. The central east populations were living in one of the oldest and continuously habituated regions of India. These populations further explore and spread to various parts of India. Traditionally these populations were divided into various casts depending on old Hindu mythology. Religiously Muslim populations were also present dominantly in same region. Various subjects were categorized based on their specific cast and described as cast populations due to presence of endogamy pattern. Cast populations were also based on traditional Indian system of “work based population groups” or more specifically “Chaturvarna”, which included Brahmins (practices teaching and religious rites), Kshatriyas (warriors or defendants), Vaishyas (traders, artisans) and Shudras (smaller activities). Further these casts were divided among sub casts or region specific population groups and identified by their surnames or gotras (ancestor name). They maintain their unique socio-cultural identity due to strict endogamy, specific rituals and marriage practices, which provide genetic differentiation due to isolation or specific environment due to passage of time. Additionally, regional and social effect also play key role in shaping regional sub cast populations, which makes ultimately cast system more complicated. Currently, various cast populations were further politically divided in to General (GN), Other Backward Classes (OBC), Scheduled Castes (SC) and Scheduled Tribes (ST). This division was according to socioeconomic status of various casts of the society by the Constitution of India. In the present study, we have analyzed the data based on above broad category, which gives general implication of social cast system of India. Since, evolutionary background of many populations is still not clear so, we have discussed in brief about evolutionary background of some important populations based on their phenotype and mtDNA study. It was interesting to observe highly diverse skin pigmentation and wide presence of major Mitochondrial haplogroups (MT-haplogroup) in central east populations. In the present study, we want to, explore the relation of pigmentation and genetic diversity of central-east Indian cast populations.
Materials and Methods
Sample details and their phenotype data collection
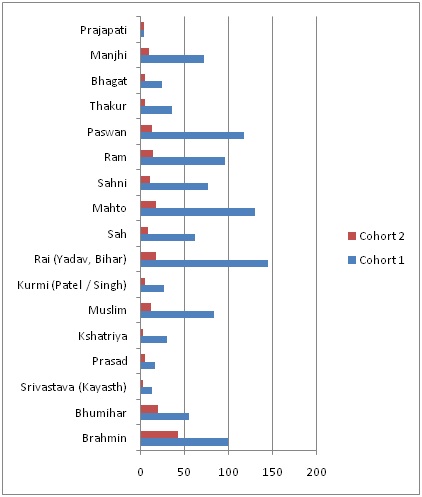
Our present study was based on two cohort databases (Table 1A). The phenotype variation observed among central east populations of our earlier study is referred as cohort 1 or phenotype database and presented in Table 1B and Figure 1 [13,14]. The cohort 2 populations were selected from the cohort 1 database for genetic research and referred here as phenotype genotype database and presented in Table 1C. In the present study, we selected 184 subjects from North-Bihar (N-B) (119 subjects) and Eastern part of Uttar Pradesh (E-UP) (65 subjects) from age group 6-75 years. In 184 subjects, 165 were males and 19 were females. The cohort 2 populations were belonged to 19 populations of 3 social categories (80 general, 58 other backward caste and 46 schedule caste). Further details of cast population characteristics are defined in Table 1C and Figure 2. Informed written consent was taken from subjects.
Derma spectrometer (melanin index measurement)
We utilized the mean of foreheads and under arm Melanin Index (MeI) of our previous phenotype study which was measured with Derma spectrometer (Cortex Technology, Hadsund, Denmark) in duplicates [13,14]. We have used the data of underarm MeI for this study. Those subjects who have used skin ointments and any pigmentation disorders / skin diseases were excluded.
PCR and Sanger re-sequencing of MT DNA
Details of primer sequences and their respective thermo cycling conditions are given in Table 2 and Table 3. PCR was done in 10-μl volume, which contains 5 μl of 2 × Emerald Amp GT PCR master mix, 10 ng of genomic DNA and 0.1 pm (final concentration) of each primer. Amplicons were cleaned with Exo-SAP-IT (USB, Affymetrix, USA) with recommended protocol and 1.0 μl of purified product used as template for sequencing, using Big Dye terminator (v3.1) cycles sequencing kit (Applied Biosystems, USA) and analyzed on ABI3730xl DNA Analyzer (Applied Biosystems). Sequence data were further analyzed using Sequence analysis and Auto Assembler (v1.0) for editing and assembling of sequence data, respectively.
Statistical analysis
To explore the skin pigmentation diversity per kilometer square (km2), we calculated the area on https://www.freemaptools.com/area-calculator.htm. The latitude and longitude information was also extracted from the same online tool. Basic statistical analysis was performed using R language. To compare the distribution of MeI for GN vs OBC, OBC vs SC and GN vs SC, we utilized ANOVA test.
Results and Discussion
Diversity of skin pigmentation
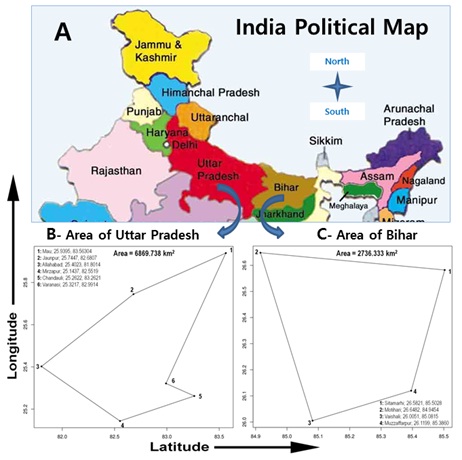
In the present study, we calculated the study area separately for two states. Initially, within a state, we joined the sampling location with minimum spanning distance and then utilized online tool (https://www.freemaptools.com/area-calculator.htm) for calculation of area. We observed that area for Eastern-Uttar Pradesh (E-UP) and Northern-Bihar (N-B), were 6872.649 and 2736.333 km2 respectively (Figure 2). Both sampling area are only 0.2089% (E-UP) and 0.0832% (N-B) of total geographical area of India (3,287,263 km2). Intriguingly, within this small area, we observed huge diversity of skin pigmentation by cohort 1 (phenotype database) analysis [14]. Middle gangetic belt of central-east region represents phenotype variation among populations with 46.45185 (SD +/- 5.104557) MeI in Bhumihar cast to 70.83403 (SD +/- 8.13) Majhi cast [14]. In cohort-2 (phenotype-genotype database), E-UP, we observed Melanin Index (MeI) 47.67 ± 4.32 while in N-B, we observed MeI 60.77 ± 9.94. In other sense, we observed subjects with both light and dark skin pigmentation in small geographical region.
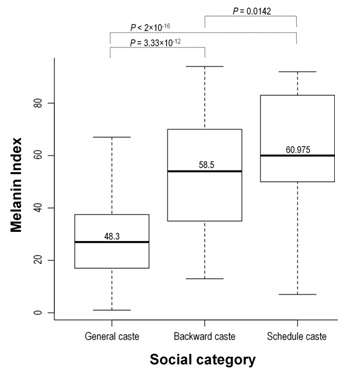
We also observed significant differences of MeI in social status of subjects (Figure 3). We observed GN caste is having more light skin in comparison to OBC and SC. The MeI is marginally different to OBC and SC (p = 0.0142) while significantly different to GN vs OBC (p = 3.33×10⁻¹²) and GN vs SC (p <2 × 10-16).
MT-haplogroup diversity and its correlation with melanin index
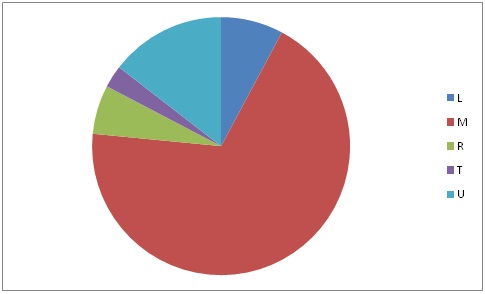
Further, we did sanger sequencing of the mitochondria of subjects and manually annotated the haplogroup on the basis of variations observed. On consideration of major MT-haplogroup, we observed 4 major haplogroup with >10 subjects; (a) 14 subjects with L haplogroup (b) 123 subjects with M haplogroup, (c) 11 subjects with R haplogroup and (d) 26 subjects with U haplogroup. We did not observe any significant differences of MeI between one haplogroup against another haplogroup; (a) M vs U, p = 0.0845, (b) M vs R, p = 0.895, (c) M vs L, p = 0.513, (d) U vs R, p = 0.258, (e) U vs L, p = 0.635 and (f) R vs L, p = 0.613. It reveals that MT-haplogroup did not have any influence on MeI.
Importance of study
Present review highlighted the relation of important mitochondrial genetic markers and melanin index of central East Indian populations, which were never exposed earlier. Recent advancement in the population genetics by using mtDNA sequence analysis was able to infer the prehistoric dispersal and phylogeny of modern human. Our data shed light on maternal and pigmentation variation in central east region. Most importantly, presence of major mitochondrial haplogroup M, L, R, U and T, in populations, indicated that central east regions were center and habitat of genetically distinct populations which make amalgamation at different time frame and make present day populations of various cast and categories. Study signifies further research to explore various interrelations among various cast’s populations. This study is in concordance with earlier facts, which suggest that India also serve as a major corridor for modern human dispersal [1].
The social structure of the Indian population is governed by the hierarchical caste system. Indian population structure belongs to Hindu religious fold and is arranged in the form of main caste classes viz. Brahmins, Kshatriya, Vyasa and Shudra. Indian society is known to have affected by the multiple waves of migration which was reflected on amalgamation of migrant populations with the local population groups [2-5,16-18]. Presence of M haplogroup (66%) in majority of central east populations highlighted the interrelation of various genetically distinct populations from east Africa to East Asia, through Indian corridor.
The Indo-European speakers constitute the third potential source of Indian gene pool [3,5]. However the European specific haplogroups (T and U) were only ~16% in our populations.
In Indian population we hypothesize that there will be gradual decrease in % of European specific haplogroups from north to south, further research on Indian population may clear the real facts. More recently, a high profile genetic study analyzed 560,123 SNPs among 132 individuals derived from a diverse 25 ethnic Indian populations using the similar approach and identified two major ancestral populations i.e., ASI (Ancestral South Indian) and ANI (Ancestral North Indian) [1]. The ancestry of both of the components in other Indian populations varies between 39-71% [1]. Various research findings and importance based on mitochondrial DNA analysis was given in Box. Our earlier study reveals that social categories in India have significantly different Melanin Index which variate from population to population, although these populations were living together in same geographical regions, but show phenotype similarity with dark skin like African to fair skin like European [13,14]. Additional studies, in another region of India have also found pigmentation variation [19]. There may be several known or unknown regions for this phenotype diversity, but one possible region might be the endogamy practices in same population which contributing effectively for maintaining the above pigmentation diversity from long back. Our mitochondrial study shows, complex nature of each cast, due to presence of diverse MT-haplogroup in the region (Tables 4, 5 and Figure 4). Various cast shared the same haplogroup, which indicate that cast system is not on the basis of populations, but it is due to many other regions too. Additionally, mitochondrial study had not found the major influence on melanin index, which again highlighted the complex nature of the Indian cast system, which signify earlier facts, that caste system was not decided by phenotype or geneology, but it is on the basis of traditional reasons. Our study, break the link between maternal geneology and phenotype correlation through mitochondrial research. It should be noted that, instead of presence of endogamy in same populations, phenotype selections for current marriage practice also responsible to affects the modern population’s phenotype variations, further this can be seen in melanin index variation and their standard deviations data of the cohort 1 (up to 10 unit of MeI in various cast; Table 1B). Recent cast study on Indian population established that caste system is approximately ~ 2000-3000 old traditional methodologies [2].
Our study established the earlier fact of Indian cast system, where cast is decided by traditional methods and not on the phenotype methods. We can hypothesize that, from earlier days (~3000 to till now), it might be possible that various populations of different phenotypes comes under same caste categories, which is also reflected by variation in Melanin Index and MT-haplogroup data (Tables 1B,4 and Figures 3,4). The existence of sub-structuring in populations of Indian subcontinent has notable implications for population genetic studies and forensic databases where broad grouping of populations based on such affiliations is frequently employed.
Phenotype diversity, unlimited human migrations, existence of various endemic regions, foci of various infectious disease and diversified population makes the importance of this type of study in India [9,20]. The modern human habitations in central east regions were during Paleolithic times. Therefore, further explore to find out the ancient foot prints as well as the effect of local population selection of any disease or movement will be a great effort. Our study probably shed small light and indicates the primary signature of complex nature of Indian cast system by mitochondria-phenotype correlation study. The wide presence of various mitochondrial haplogroups commonly present in many cast populations indicates their early relations or admixture events. Caste system is considered as ~2000-3000 old phenomenons’s and still continues in terms of evolutionary events (endogamy and isolations) and social status [2]. Further, more sample size and big geographical area, required to conclude our finding more appropriately and revels more complex relations of various castes in India. More specifically, larger cohort will elucidate more about diversity and pigmentation in India.
Conclusion
In conclusion, we found high pigmentation and mitochondrial haplogroup diversity in central East Indian populations. Although, pigmentation is significantly different among social categories, we did not find any significant influence on major MT-haplogroup.
Acknowledgement
Sheikh Nizamuddin was supported by ICMR-Senior Research fellowship program. Anshuman Mishra acknowledges the financial support of “DBT-RA program P90806” of Department of Biotechnology, India; UGC-SRF fellowship and contingency grant of BHU, India and “2016 Post-Doc. Development Program” of Pusan National University, South Korea. Study group acknowledges Rakesh Narayan Dubey (Prasad Intermediate College, Varanasi), Dhruva Narayan Dubey (Bhartiya Vidya Adhyan Kendra, Varanasi), Ashutosh Narayan Mishra (Bhopal) for all kind of help and arrangements. Special Thanks to Genome Foundation, Hyderabad for sequencing facility and Professor Martha Mizoran Lahr (University of Cambridge) for derma spectrophotometer instruments.
Conflict of Interest
Authors declare no conflict of interest.
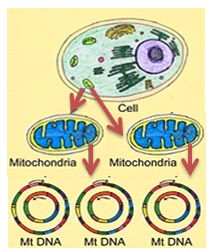
BOX: Key Facts about Mitochondrial Research The human, genome comprises nuclear genome and mitochondrial genome. During zygote formation, nuclear genome is contributed by a sperm cell and mitochondrial genome by the unfertilized egg cell (Figure 5). The mitochondrial genome is maternally inherited (circular double stranded molecule of ~16569 bases). Everyone carries more or less exact copy of the mtDNA. These mtDNA they get from their mother and their mother’s mother and so on, thus representing countless generations (maternal inheritance). We can trace any random mutation over the mtDNA, as these mutations are passed on intact to next generation; they were considered as “tracers of the subjects or family or populations”. Further details of mitochondrial research (genome structure, transcription, translation and replication) were well described by Jan-Willem Taanman [21]. In the past few years, the characterization and comparison of molecular signatures based on mtDNA have provided a substantial contribution to the understanding of human origins, their genetic relatedness and diffusion patterns [3,6,8,22,23]. Mitochondrial DNA surveys in worldwide populations have shown a continent-specific distribution of mtDNA lineages [6,22-26]. All Eurasian mtDNA lineages trace their ancestry to three maternal founder lineages M, N (R), suggesting their dispersal along the southern route in single wave after the exodus of modern humans from Africa [3,17,22-24,27]. The coalescence times of mtDNA haplogroups M, N and R are remarkably similar and ancient, ~65,000 years [17,18]. |
Figures
Figure 1: Central East Indian cast populations used for cohort 1 (1078 subjects) and cohort 2 (184 subjects) from 17 populations were presented as a bar diagram.
Figure 2: Geographical region of study in Indian region. Total 1078 subject of17 populations were used for study (http://wiienvis.nic.in).
A-Central-east Indian region highlited with dots for Uttar Pradesh and Bihar state regions for Phenotype study also referred as cohort 1.
B-Central-east Indian region highlited with area covered in Uttar Pradesh state for Genotype-phenotype study also referred as cohort 2.
C-Central-east Indian region highlited with area covered in Bihar state for Genotype-phenotype study also referred as cohort 2.
Figure 3: Box plot to represent the distribution of melanin index in different social categories of Central East Indian cast populations in cohort 1. Total 1078 subjects of 17 populations were used for study.
Figure 4: Major mito-haplogroup (L, M, R, T and U) distributions in Central East Indian cast populations of cohort 2. Total 179 subjects of 17 populations were used for study.
Figure 5: Schematic presentation of Mitochondria inheritance pattern in biological cell (source: dr.mishra@zmail.com).