Introduction
Widespread occurrence of polyploidization (whole genome duplication) in plants provides evidence that it has advantages in development, adaptation and diversification [1-3]. Allopolyploidy resulting from interspecific or intergeneric hybridization and multiplication of more than two sets of genomes provides evolutionary advantages through speciation and environmental adaptation of higher plants, including many important crops [2,4-6]. At certain times, whole genome duplication has led to paleopolyploidy, showing structural genetic diploidization and subgenome fractionation (selective loss and retention of protein coding genes and non-coding RNA genes) leading to balance at the steady state of intergenomic orchestration [7-9]. These processes leading to allopolyploidization should bring about a broad range of genetic and epigenetic responses such as chromosome deletions, rearrangements, transpositions and epigenetic modifications [4,10- 20].
Common wheat, Triticum aestivum (2n = 6x = 42, genome formula AABBDD), formed through two additive allopolyploidizations. About 0.5 million years ago, the first allopolyploidization occurred by hybridization between the wild relatives Aegilops speltoides (2n = 2x = 14, SS≑BB) and T. urartu (2n = 2x = 14, AA). Common wheat was spontaneously produced about 10,000 years ago from the second allopolyploidization between the early-cultivated allotetraploid T. turgidum ssp. dicoccum (2n = 4x = 28, AABB) and wild goat grass, Ae.tauschii ssp. strangulata (2n = 2x = 14, DD) followed by chromosome doubling of unreduced gametes [21-24]. Common wheat has been widely cultivated across the world, since it reveals more features of heterosis, such as growth vigor, environmental adaptability, and disease resistance than tetraploids [25]. Since there was a time lag between the two allopolyploidization events of common wheat, it should provide a model system to study genetic interactions among three genomes.
Orchestration of allopolyploid genomes after whole genome duplication leads to genome fractionation (unequal gene loss) as well as neo- and subfunctionalization of duplicated genes due to alternative nucleotide substitution rates. In addition to the biased fractionation of polyploid genomes, genes located on dominant genome regions have a tendency toward higher expression [26-28]. Actually, genomic asymmetry due to the non-random retention of controlling genes favoring one genome over others is manifested in allopolyploid wheat by the control of various genetic traits and syntenic genes [8,29]. Whole genome shotgun sequencing of Chinese Spring wheat showed that allohexaploid wheat lost 10,000 to 16,000 genes during the course of allohexaploidization [30]. Furthermore, reported accelerated alteration of homoeologous genes, such as nucleotide mutations and alternative splicing [31]. These structural changes of the common wheat genome are likely to occur during allotetraploidization, mainly because of the duration of the allopolyploid [32,33]. However, precise genome-wide data are required to show which homoeologous genes are expressed among the three genomes of common wheat for better understanding of gene regulation in allopolyploid. Hence, the present study is aimed to clarify transcriptome of homoeologous genes in common wheat, based on the full-length cDNA clones.
Here, we took advantage of the Full-Length (FL) cDNA sequence data of common wheat to complete reference set of its expressed homoeologous genes. We used all Expressed Sequence Tags (ESTs) of common wheat that had been cloned from cDNAs containing a poly(A)+ tail, and sequenced from both ends of the inserts. The full-length cDNAs which Cover The Coding Sequences (CDSs) or non-coding RNAs were proofed from these ESTs, including the CAP-trapped cDNAs, were classified into homoeologous genes expressed from the A, B and D genomes, and these homoeologous genes were grouped into gene clusters corresponding to those of the diploid [34]. Chromosome locations of these homoeologous genes were determined to show the subgenome fractionation of expressed genes [35].
Results
Completion of Full-Length (FL) cDNA data of common wheat
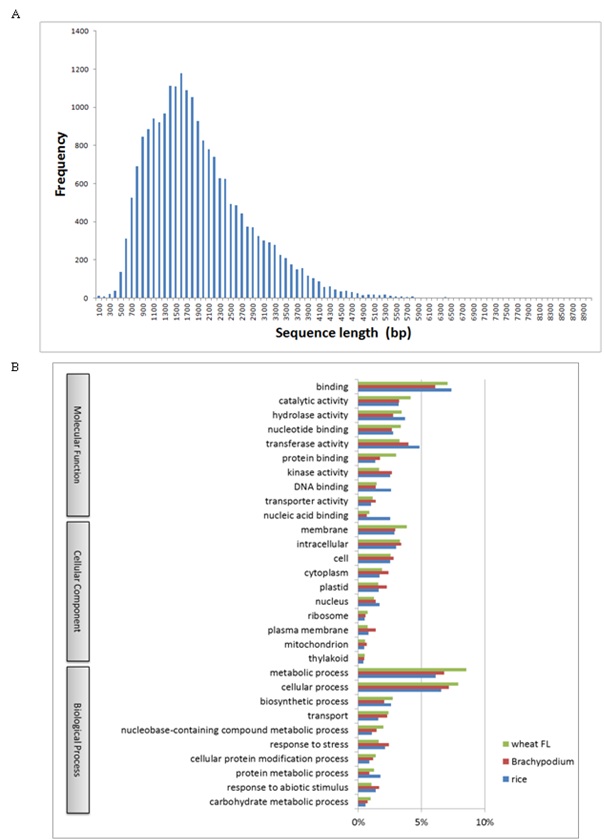
In addition to the two rounds of complete sequencing of CAP-trapped cDNA clones in common wheat, we further screened and determined the sequences of 4,886 Full-Length (FL) cDNAs [34]. In total, 21,693 FL cDNA sequences are now available. Size distribution of the 21,693 FL cDNAs is shown in figure S1A. The mean size of the wheat transcripts (1839±900bp) was longer than barley (1641±842bp), Brachypodium (1603±951bp) and rice (1542±924bp) transcripts in the public databases of cereal FL cDNAs. The data suggest that CAP-trapped cDNAs captured the complete Open Reading Frames (ORFs) of common wheat. Gene Ontology (GO) Slim annotations of wheat FL cDNAs were compared to those of other cereals as shown in figure S1B. GO Slim patterns were similar among cereal FL cDNAs, suggesting that wheat FL cDNAs were selected similar to the cereal transcriptomes. Predicted ORFs of the 21,693 wheat FL cDNAs were searched against the Poaceae (barley, Brachypodium, rice and sorghum) peptide and other data sets in the Pfam and UniProt databases, suggesting that 1,538 ORFs (7.0%) were transcripts having least homology with grass genes (wheat specifically expressed genes).
Furthermore, the cDNA clones of common wheat having certain gaps in the inserts and homology with cereal genes, rather than the 21,693 FL cDNA clones, were selected from the EST contigs. The nucleotide sequences of the resultant 4,548 cDNA clones harboring the complete CDS were determined. Finally, the 26,241 FL cDNA clones of common wheat were complete.
Construction of expressed homoeologous genes set from the cDNA clones of common wheat
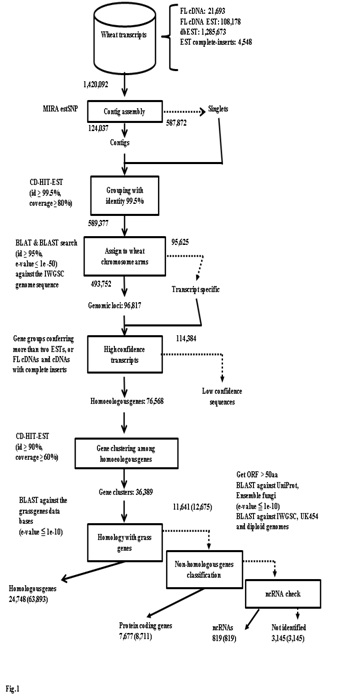
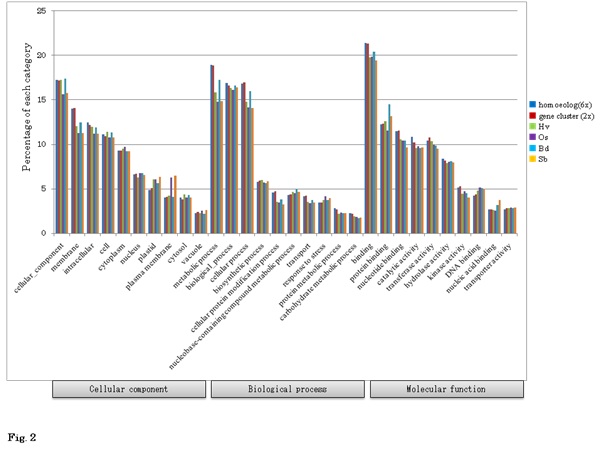
To construct reference set of transcriptome expressed from three kinds of genome in allohexaploid wheat, we exhaustively surveyed the sequenced cDNA clones from various developing stages grown in normal and abiotic as well as biotic stressed conditions including the full-length cDNAs [34]. The samples included 45 tissues for the cDNA clones, and 17 for the full-length cDNAs. All the sequence data of the cDNA clones including 1,285,673 ESTs in the NCBI database and 107,353 one-path sequences of the CAP-trapped cDNA clones from both ends were utilized to establish standard transcripts in common wheat. A flowchart to categorize these standard transcripts is shown in figure 1. In total, 1,420,092 sequences were initiated for assembly to homoeologous genes (6x level) and gene clusters (2x level). After a high confidence check of the transcript groups, 76,568 expressed homoeologous genes were obtained. These homoeologous genes were classified into gene clusters corresponding to the gene numbers in common wheat. The resultant 36,389 wheat gene clusters were used to search for counterparts in the grass gene database. Of 36,389 wheat gene clusters, 24,748 showed homology to grass genes. The remaining 11,641 gene clusters with lower homology to the grass genes were checked for protein coding ability. Finally, 7,677 wheat specific protein coding gene clusters (8,711 homoeologous genes) were obtained (Figure 1). Consequently, 32,425 protein coding gene clusters (72,604 homoeologous genes) were obtained (Table 1). GO Slim annotation of these transcripts suggests that the components of the classification were similar to those of other grass plants (Figure 2), suggesting that these common wheat transcripts should cover almost all expressed genes. GO patterns between homoeologous genes (6x) and gene clusters (2x) were similar, suggesting that the overall gene functions of homoeogenes were not specific.
Furthermore, 819 non-coding RNAs were found, including 789 microRNA precursors and 30 non-coding RNAs. Finally, 3,145 transcripts remained to be identified (Figure 1). All this gene information is available in research data.
Homology of wheat and grass transcripts
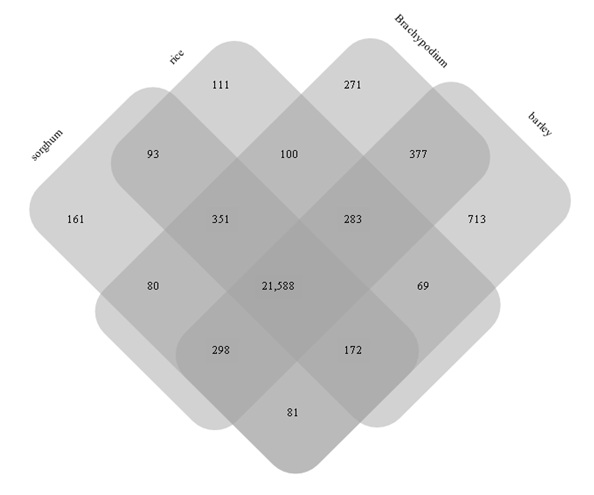
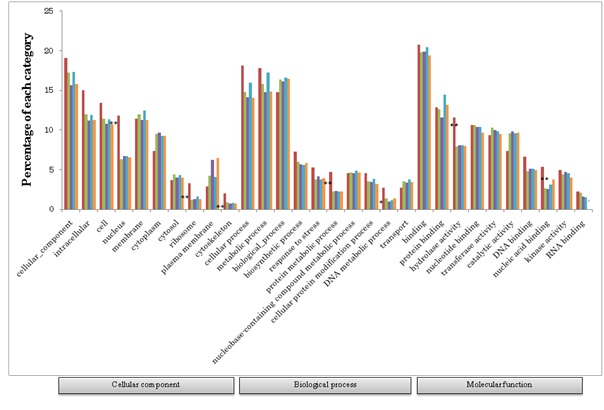
As mentioned above, out of 32,425 protein coding gene clusters, 24,748 clusters (76.3%) showed homology with those of grass plants (Figure 1). Among the 24,748 gene clusters, 21,588 (87.2%) were commonly found in grass genes (Figure 3). The remaining 3,160 genes revealed homology with at least one species of grass. On the other hand, 7,677 gene clusters (8,711 homoeogenes) had the least homology so far with those of other grass plants, revealing specific genes of common wheat. The gene ontology of this genesis shown in figure 4. Higher proportions of wheat specific genes were observed in the “nucleus” cellular component category, “protein metabolic process” in the biological process category, and “hydrolase activity” and “nuclear acid binding” in the molecular function category.
Chromosome assignment of the expressed homoeologous genes
Chromosome assignments of the 76,568 homoeologous genes (Figure 1) were examined. Out of 76,568 homoeologous genes, 71,092 (92.8%) were assigned to each chromosome and/or chromosome arm of Chinese Spring wheat [35]. Of these, 69,949 homoeologous genes were estimated to encode proteins, of which 61,452 had homology with grass genes (Table 1). In addition to the protein coding genes, 1,143 non-coding genes were obtained, including 204 microRNA precursors (http://plantgrn.noble.org/psRNATarget/) and 12 non-coding RNAs (http://www.noncode.org/download.php). Furthermore, 2,655 protein coding genes, 585 microRNAs and 18 non-coding RNAs were predicted in the wheat genome, although their chromosome locations could not be determined using the IWGSC sequence [35]. Consequently, 74,350 transcripts from the three homoeologous genomes of common wheat were identified (Table 1).
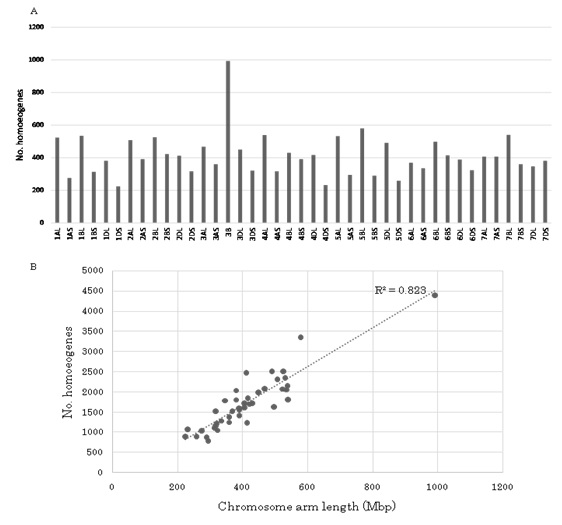
The chromosome assignments of 71,092 homoeologous genes are shown in figure 5A and B. Chromosome 3B harbored the most genes (4,399), while 6D contained the least (2,296). The average number of expressed genes per chromosome was 3,385. Although long arms of chromosomes tended to have more genes than short arms, 7AS (1,723) and 7DS (1,809) had more genes than 7AL (1,623) and 7DL (1,792). These chromosomes did not participate in the translocations observed in Chinese Spring wheat [36]. Since the DNA content of each chromosome arm and/or chromosome has been estimated, the number of expressed genes per Mbp on each chromosome and/or chromosome arm was calculated [37]. The average number of expressed genes per Mbp was 4.2. Although the overall expressed gene number was proportional to chromosome length for each chromosome (R2 = 0.8234: Figure 6B), two chromosome arms (2DL and 5BL) had a significantly higher than expected number at the 5% level (Figure 5), suggesting higher accumulation of expressed genes in those chromosome regions than others.
Localization of wheat specific genes on wheat chromosomes
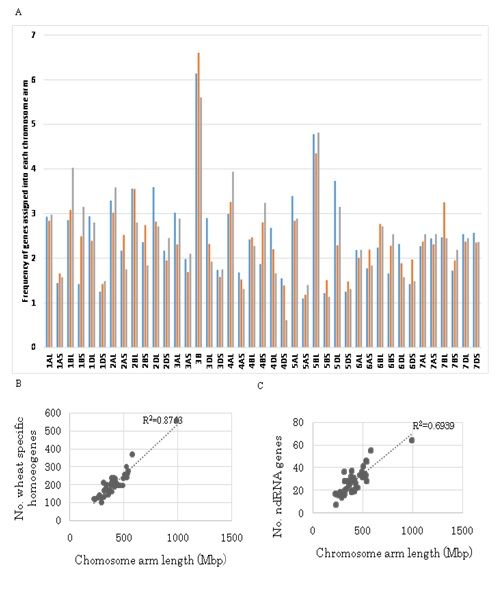
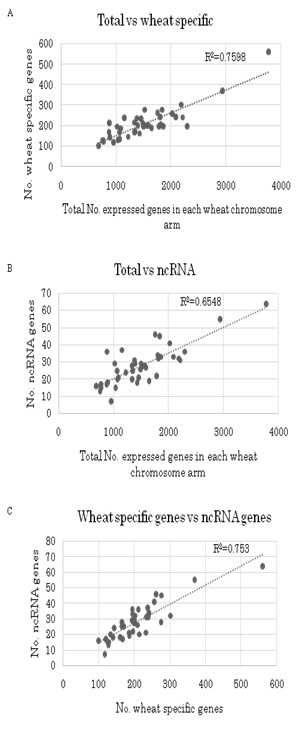
The 8,497 wheat specific genes (Table 1) were assigned to each chromosome arm of Chinese Spring wheat (Figure 6(A-C)). As with the total homoeologous genes (Figure 5), the number of genes on each chromosome arm was proportional to chromosome length (R2 = 0.8763) except for 1BS, on which more genes were found than expected (5% level). When the wheat specific genes on each chromosome arm were compared to the total homoeologous genes, three chromosome arms, i.e., 1BS (1% level), 4BS and 7BL (5% level), contained more wheat specific genes than expected (Figure S2(A-C)).
Localization of non-coding genes on wheat chromosomes
Localization of 1,143 non-coding genes (Table 1) was also determined (Figure 6). The number of genes on each wheat chromosome arms was again proportional to chromosome length (R2 = 0.6939) except for 1BS, on which more non-coding genes were found than expected (5% level). When the number of non-coding genes on each chromosome arm was compared to the total homoeogenes, four chromosome arms, i.e., 1BS (1% level), 1BL, 4BS and 4DS (5% level), contained more non-coding genes than expected (Figure S2(A-C)). Taken together with the localization of wheat specific genes, it can be concluded that the 1BS and 4BS chromosome arms had significantly higher numbers of both wheat specific genes and non-coding genes (Figure 6).
Assignment of expressed homoeologous genes in to the three distinct genomes of common wheat
Since chromosome-assigned homoeologous genes were grouped into gene clusters based on their sequence homology (Figure 2 and Table 1), sub genome fractionation of each expressed-homoeologous gene in its gene cluster was characterized by counting homoeologous genes in each gene cluster (Table 2). Half of the genes (49.5%) in common wheat were expressed only by one of the three homoeologous genomes, 22.4% of genes by two genomes, and the remaining 28.1% by all three genomes. Out of the 30,269 gene clusters, 73.2% (22,157) of the genes were expressed from single copies from one, two or all three genomes; 13,703 (45.3%) acted as single genes expressed from one of the genomes, 4,503 (14.9%) were expressed from two genomes, and 3,951 (13.1%) were transcribed as single copy genes from each of the three genomes (Table 2). This estimation supports previous results using smaller scale EST data [38].
Genes located in the B genome showed preferential expression over the other two genomes, A and D (P< 10-9, χ2 test). This preferential gene expression was found in single copy genes (P< 10-30, χ2 test) and multigenes having more than 7 copies (P< 10-5, χ2 test), but not in genes expressed from two genomes, i.e., when there was silencing of one genome (Table 2).
Expression of 7,477 wheat specific homoeologous genes from three distinct genomes was characterized. About 90% of these were transcribed as single genes from one of the three genomes (Table 1). However, 5% of homoeologous genes were not expressed in one of the three, and only 0.4% was expressed from all three genomes, suggesting a characteristic contribution of wheat specific genes. Preferential expression of the wheat specific genes by the B genome was found (Table 1).
Functional estimation of homoeologous genes classified by their expression profiles
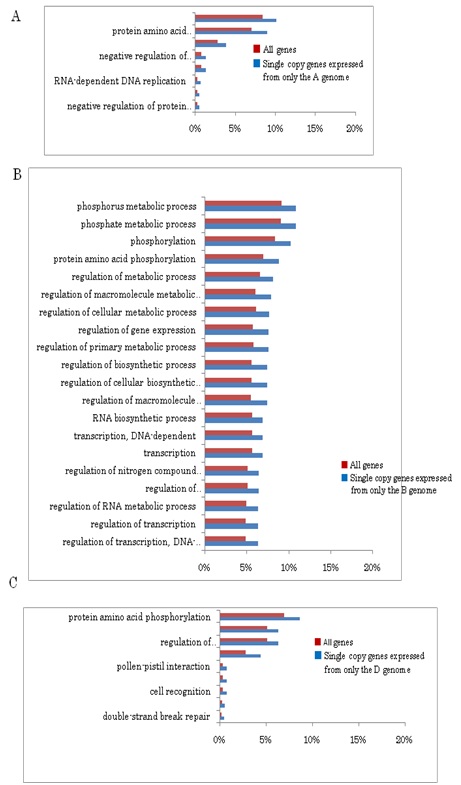
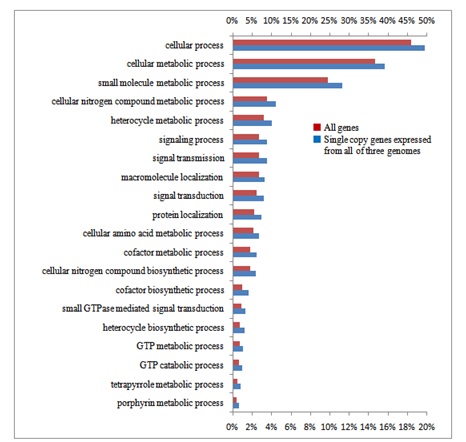
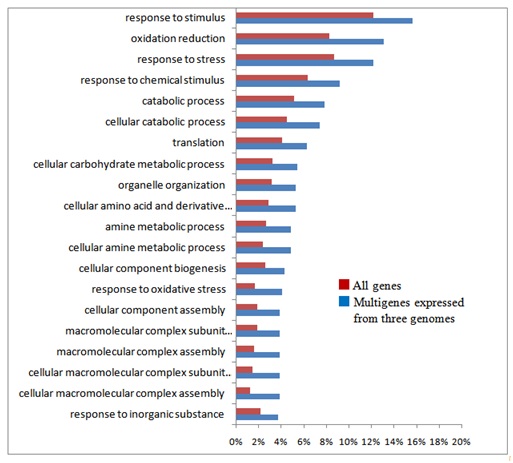
In order to estimate functions of the homoeologous genes characterized by their copy number and genome assignment, their gene ontology was examined by the agri GO tools [39]. Out of 30,269 expressed gene clusters, 13,703 single copy genes expressed by only one genome, 3,951 single copy genes simultaneously expressed by all three genomes, and 717 (626 + 91) multigenes expressed by all three genomes (Table 2) were analyzed. Typical gene functions for each gene category of copy numbers were shown (Figures S3(A-C)-S6 and Table 1): single copy genes expressed from only one genome tended to contain significantly more genes in the categories related to signal transduction and gene regulation, such as phosphorylation (protein kinase), components of nucleotides (ATP synthase) and proteins (e.g., tryptophan synthase), and defense response (Gutathione S-transferase; Figure S3(A-C)). On the other hand, single copy genes transcribed from all three genomes were specifically concerned with metabolic processes (e.g., starch synthase; Figure S4), showing that these genes control basic metabolism. As for multigenes expressed from all three genomes, stress-response genes (salt-responsive genes) were notable, in addition to those involved with basic metabolic processes (Figure S5).
Discussion
Reference set of transcripts is indispensable clues for gene prediction. Hence, we have completely surveyed expressed genes from various wheat tissues of common wheat grown under ordinary conditions and in biotic- and abiotic-stressed conditions, including CAP-trapped cDNAs (FL cDNAs;) [34]. Although collections of FL cDNAs are recognized as significant genetic resources, full-set surveys of FL cDNAs expressed from each genome of common wheat (allohexaploid: AABBDD) are not readily available. Therefore, we completed the sequencing of an additional 4,886 CAP-trapped FL cDNAs, so that 21,693 sequences for Chinese Spring wheat are now available. In addition to these CAP-trapped FL cDNAs, the inserts of 4,548 independent cDNA clones which cover the protein coding regions had been determined. Finally, the nucleotide sequences of the 26,241 FL-cDNA clones are available. This number is equivalent to those of Arabidopsis annotated from the genome (TAIR 10 https://www.arabidopsis.org/), suggesting that almost all expressed wheat genes containing poly-(A)+ tail can be captured with the cDNA clones (Figure S1) [40-43]. This is indispensable genome resource to predict the expressed genes in wheat.
Based on these wheat FL cDNAs, all of the available wheat ESTs, including one-path sequences of CAP-trapped wheat cDNAs, were clustered. Finally, 76,568 homoeologously expressed genes (homoeologous genes) were identified (Figure 1). These classified expressed genes were clone-based and relatively abundant. The homoeologous genes were grouped to estimate the gene members of common wheat, designated as 36,389 gene clusters (Figure 1), of which 32,425 were protein coding genes (Table 1). This estimated gene number is equivalent to the gene number predicted from the genome sequences of diploid tetraploid, and hexaploid wheats [30,35,44-46]. Overall GO analysis of these homoeologous genes exhibited GO terms that were similar to grouped gene clusters of diploids and other cereal genes (Figure 2), suggesting that the list here of cDNA clones could survey almost all expressed genes in common wheat.
The A and B genomes of common wheat have a long history of co-existence, ca. 0.5 million years, before pollination with Ae. tauschii (DD) and genome-wide duplication about 10,000 years ago, giving rise to the allohexaploid [22,23,47]. Accumulation of genomics data in cereals enables characterization of the features of expression of the allohexaploid wheat genes located on the three distinct genomes [48-50]. Thus, orchestration of expressed homoeologous genes in natural hexaploid wheat at a steady level should be clarified. In this study, the number of expressed homoeologous genes in each gene cluster was estimated. About half of expressed genes in common wheat were expressed only from one of three genomes. While, a quarter of expressed genes used two genomes, and remaining a quarter were expressed from all three genomes (Table 2). On the other hand, almost all (ca. 95 %) wheat specific genes were transcribed from one genome (Research Data SF1A), suggesting characteristic feature of wheat specific genes. Preferential gene expression from the B genome was found for both single copy genes and multigene families (Table 2 and Research Data SF1B). This expression preference was also found in wheat specific genes (Table 1). Furthermore, significantly fewer wheat specific homoeologous genes were expressed as single copy genes by the D genome, while the number of wheat specific single copy genes assigned to the A and B genomes were not significantly different (Table 2 and Research Data SF1A and SF1B). These lines of evidence suggest both more negative regulation of the D genome for wheat specific genes and maternal effects on expression of homoeologous genes [33,51]. The observation that certain chromosome arms most of which were of the B genome, harbored more expressed homoeologous genes than expected (Figure 5 and Figure S2) suggests that gene regulation system (s) might operate on specific chromosome regions. Preferential transcription of genes from one progenitor genome has been reported in cotton, Arabidopsis and maize as well as in wheat [17,26,52-55].
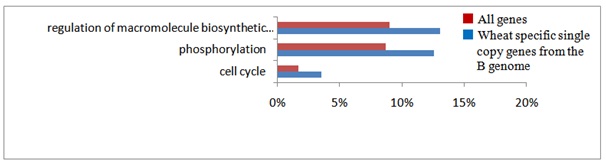
GO analysis revealed that single copy genes of common wheat play characteristic roles distinct from other categories of genes such as signal transduction and stress responses (Figure S3). In addition to the GO categories of single copy genes found in common among the three genomes, single copy genes of the B genome fell into further categories (Figure S3B). Categories of the genes expressed from two of the three genomes, and those expressed from each of the three genomes were concerned with basic metabolism (Figure S4). Moreover, multigenes expressed from all three genomes, among which genes of the B genome exhibited preferential expression, showed characteristic functional categories such as stress responses in addition to metabolic processes (Figure S5). These data suggest functional partitioning of respective homoeologous genes. Genetic alterations and epigenetic regulation are known to play roles in gene expression of polyploids [56]. Although substantial DNA loss especially from the A and B genomes, has been reported in common wheat, genetic alterations alone of allohexaploid wheat are unable to explain the observed expression profiles of homoeologous genes: the number of expressed homoeologous genes was similar for the A and D genomes, while more were found in homoeologous genes from the B genome (Tables 1 and 2) [8,12,30,57,58]. This suggests that the epigenetic regulation operating on the genes in each genome is substantial [59-62]. In fact, silencing of homoeologs through altered DNA methylation and repression of counterpart homoeologous genes with miRNAs and siRNAs plays important roles in control of expression of target genes [51,63,64].
Materials and Methods
Final collection of CAP-trapped cDNA sequences
A full-length cDNA library was constructed with the CAP-trapper method from pooled RNAs derived from 17 samples of common wheat (Triticum aestivum L. cv. Chinese Spring) tissues, in which those formed during the wheat life cycle, and those subjected to abiotic stresses such as heat shock, salt-stress and dehydration, were included [34]. After the second round of screening of non-redundant full-length cDNA clones, 55,968 cDNA clones were subtracted from the library. These clones were sequenced from both ends of the inserts and assembled according to the one-path method previously reported [34]. Selected cDNA clones underwent six runs on a next-generation sequencer (Roche 454 FLX+), and sequenced fragments were assembled with Trinity R2013-02025 software [65]. Vector sequences (GenBank: X52331) were cut from the assembled fragments. Contaminating sequences of Escherichia coli (GenBank: U00096) and fungi (Ensemble Fungi cDNA, release 17) were removed from the assembled sequences. Insert DNA sizes of the clones were checked by agarose gel electrophoresis after digestion of the cDNA clones with SfiI and/or BamHI. Sequences of ambiguous clones were determined with the Sanger method (Applied Biosystems 3500 instruction manual).
Another source of cDNA clones having the full CDS
Homoeologous cDNA clones to the full-length cDNA clones described above and homologous clones to the genes of Brachypodium (mips v1/2), barley (mips 23 Mar 2012), rice (IRGSP 1.0) and Sorghum (mips v1.4) that covered the CDS were selected from the 45 cDNA libraries constructed by tissues from various developing stages grown in normal and abiotic as well as biotic stressed conditions [66]. DNA sequences of the selected clones were determined using the 454 FLX+ sequencer and/or the Sanger method.
Construction of the reference set of expressed genes in common wheat
A flowchart of the assembly of the expressed homoeologous genes in common wheat is shown in figure 1. A set of publically available 1,285,673 ESTs in common wheat was obtained from dbEST (NCBI 13 Aug 2013). In total, 1,420,092 partially or fully sequenced data of cDNAs in common wheat including full-length cDNAs, one-path sequences of CAP-trapped cDNAs, cDNAs harboring CDS, and the dbEST EST set were assembled with the MIRA EST SNP pipeline step 2 assembler (version 4.0rc3). Contigs and singlets identified by the MIRA program were clustered with CD-HIT ver. 4.6.1 software (identity ≥ 99.5%, coverage ≥ 80%). The resultant clusters were assigned to the common wheat genome using the survey sequence of Chinese Spring wheat [35] from BLAT (Src35) and BLAST searches (e-value ≤ 1e-50, identity ≥ 95% and total alignment length ≥ 200). Expressed clusters were considered distinct when other mapped clusters were 2 kbp apart from the identified clusters. Furthermore, clusters (high confidence inserts) were only verified either when they contained more than two EST members, full-length cDNAs or full CDSs. The resultant homoeogenes were grouped using the CD-HIT program (identity ≥ 90%, coverage ≥ 60%) to construct gene clusters to estimate the number of gene members at the diploid level. Counterparts of these expressed genes were searched with the blastx and blastn algorithms (e-value ≤ 1e-10) against the grass gene databases: Brachypodium (mips v1.2, RBFLDB 2013), barley (mips 23Mar 2012), rice (IRGSP 1.0) and Sorghum (mips v1.4). The only gene clusters homologous to grass genes that were selected were those having more than 50 amino acids, homology identified by blastx (e-value ≤ 1e-10) to sequences in the UniProt and Ensemble Fungi databases, by bastn to predicted genes deduced from shotgun sequencing of Chinese Spring wheat (UK454_OrthAssembly mips UK454), the wild diploid ancestor of the A genome (T. urartu final_120813.gff.cds) and the D genome (Ae. tauschii final_43150.gff.cds GigaDB 13-03-07), and a chromosome sorted genomic assembly of Chinese Spring wheat (IWGSC MIPS_feb2013).
ORF prediction and gene ontology annotation
Candidate ORFs of the expressed homoeogenes and/or gene clusters were predicted using getorf in jemboss package version 1.5 [67]. The blastp searches were carried out against amino acid sequences in the rice, Brachypodium, barley, Sorghum and UniProt databases (e-value ≤ 1e-10). Protein motifs were searched for in the Pfam database using InterProScan version 5.2-45.0 software [68]. Gene Ontology (GO) IDs were assigned by Pfam id lookup in the Gramene ontology database (Ensemble data set). GO annotation of barley, Brachypodium, rice and Sorghum were obtained from Gramene (GO_ensembl). GO terms were summarized into GO Slim categories using the GO SlimViewer tool (AgBase) with the plant definition table (agri GO) [39,69]. microRNAs and non-coding RNAs were respectively searched against psRNATarget: A Plant Small RNA Target Analysis Server (http://plantgrn.noble.org/psRNATarget/) and NONCODE (http://www.noncode.org/download.php).
Data access
Nomenclatures of homoeogenes and their gene clusters, and their annotations are presented in Data File S1 and https://rcshige3.nig.ac.jp/wheat/komugi/genes/est/. Sequenced cDNA data were deposited in the BioProject accessions Nos. PRJDB4671 and PRJDB4672 of DDBJ, Japan.
Acknowledgement
The work was supported in part by a grant from the Ministry of Agriculture, Forestry and Fisheries of Japan (Genomics for Agricultural Innovation, KGS1002). Most part of DNA sequencing had been carried out in RIKEN Center for Life Science Technologies, Division of Genomic Technologies and Genome Network Analysis Support Facility. Bioinformatic work was partly conducted on the supercomputer system, National Institute of Genetics (NIG), Research Organization of Information and Systems (ROIS).
Author Contributions
KM collected cDNA clones, designed images, carried out computational analyses and participated in manuscript writing. KK designed images and performed DNA sequencing of cDNA clones. YK performed computational analyses and developed DATA base. KM contributed to construct full-length cDNA libraries, sequence the full-length cDNA clones, and construct full-length cDNA data base of common wheat. HT, MT NS, JK developed new sequencing strategy of cDNA clones, carried out sequencing and computational analyses. YN and KN contributed in computational data analyses and construction of data base of wheat transcriptome. YO and JK designed the research, and wrote manuscript. All authors read and approve the final manuscript.