Screening for Infection - An Analysis of the Microcirculation in Term Newborns
*Corresponding Author(s):
Alexandra Puchwein-SchwepckeDepartment Of Neonatology, Campus Innenstadt, Dr. Von Hauner Children’s Hospital, University Of Munich, Germany
Tel:+49 89440054535,
Email:alexandra.schwepcke@med.uni-muenchen.de
Abstract
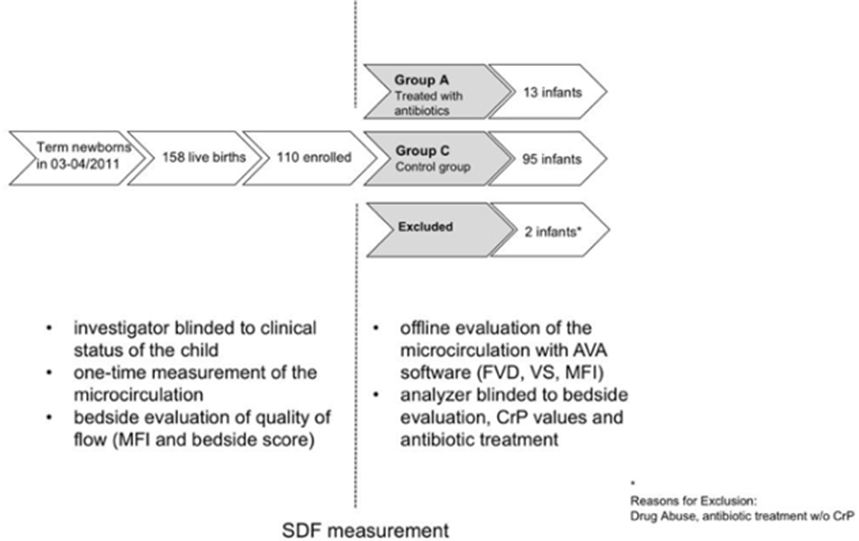
In 110 term newborns, microcirculatory parameters were obtained prospectively and consecutively by Sidestream Dark Field imaging at the upper ear conch in the first 72 hours after birth. Infants treated with antibiotics for early newborn infection (group A) were compared to the remaining control group (group C). The quality of flow was analyzed by the standard AVA analysis and by a newly introduced scoring system (bedside score).
Group A displayed a significantly reduced functional vessel density (mean [95% CI]; A: 14.0 [13.6-14.3] vs. C: 14.5 [14.3-14.8] mm/mm2, p<0.05) with a higher proportion of hyperdynamic flow in the AVA analysis (mean [95% CI]; A: 3.2 [2.9-3.5] vs. C: 3.0 [2.9-3.0], p<0.001) and abnormal flow in the bedside score (mean [95% CI]; A: 1.2 [0.8-1.7] vs. C: 0.3 [0.2-0.4], p<0.0001). Hyperdynamic flow was associated with a fivefold increased risk for infection.
Keywords
ABBREVIATIONS
AVA: Automated Vascular Analysis
C: Control Group
CRP: C-Reactive Protein
FVD: Functional Vessel Density
LED: Light Emitting Diode
MFI: Microvascular Flow Index
PC: Personal Computer
R2: Coefficient of Determination
TVD: Total Vessel Density
SDF: Sidestream Dark Field
VS: Vessel Surface
INTRODUCTION
Microcirculatory dysfunction is a key factor in the pathophysiology of sepsis and septic shock [5]. Different research groups could demonstrate severe changes in the quality of blood flow both in animal models of sepsis and in septic humans. Early alteration of microcirculatory blood flow was associated with poor outcome [6,7]. A time-dependent significant decrease in perfused vessels and microvascular flow index during a hypodynamic state of sepsis could be demonstrated in a pig model [8]. Moreover, it has been shown that microcirculatory dysfunction correlates with markers of endothelial activation in children suffering from meningococcal disease [9].
However, little is known about the microcirculation in newborns at the very onset of infection before severe symptoms develop. In the absence of hypotension adult patients do not show measureable microcirculatory flow abnormalities at the beginning of sepsis [10].
Our group previously found changes in microcirculatory flow in infection in preterm and term infants [11,12]. But prospectively measuring the microcirculation with Sidestream Dark Field imaging (SDF imaging) as a screening tool for early onset neonatal infection has not been attempted. For this goal an easy bedside scoring system would be necessary to succeed in identifying an infection early in the disease course.
METHODS
Patient recruitment
On our ward, infants with risk factors for infection (maternal fever over 38°C, elevated maternal CRP, meconium stained amniotic fluid, fetal tachycardia, premature rupture of membranes (>18 hours) and clinical signs of infection) are clinically monitored with physical exams and receive routine CRP measurements from cord blood and at 36-48 hours together with the neonatal screening. More frequent laboratory examinations and treatment decisions are up to the attending physician’s discretion. Physicians and nurses were unaware of the results of the microcirculation measurements and treatment was independent from the study.
Microcirculatory measurement
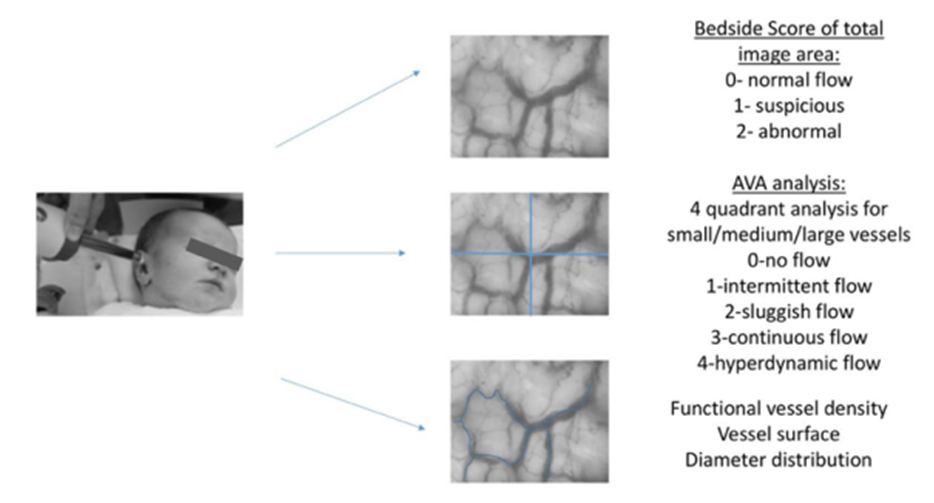
SDF imaging visualizes the microcirculation by means of monochromatic green light with a wavelength of 530 nm, which is emitted through LEDs that are placed concentrically around an optical fiber. The hemoglobin of the erythrocytes absorbs this light while other structures reflect it. Thus, perfused vessels can be seen in negative contrast in the skin up to a depth of 3 mm. The microcirculation is directly visualized on a PC as a real-time video sequence with a resolution of one pixel per µm [16-20]. For every infant we generated three video sequences of the microcirculation of 10 second duration each. The investigator was blinded towards the clinical risk factors and health status of the child. Heart rate, oxygen saturation, age in hours, gestational age, temperature, actual weight, birth weight and mode of delivery were prospectively recorded. Additional data-which could bias the investigator-such as risk factors for infection, medical history and treatment were obtained retrospectively from the medical records.
Microcirculatory analysis
Additionally, we assessed the quality of flow Microvascular Flow Index (MFI) by attributing different flow qualities to each quadrant of the image. Flow qualities were defined as 0=no flow, 1=intermittent, 2=sluggish, 3=continuous (normal) and 4=hyperdynamic [21]. The parameter hyperdynamic flow was newly introduced by the AVA program and is therefore rarely used in literature. The MFI is calculated as mean of the flow qualities of all quadrants for small, medium and large vessels.
To establish a real-time bedside evaluation, we introduced a bedside score, which was directly determined during the video recordings and was therefore not blinded (Except for the fact that the examiner had no information on the clinical status of the child). For faster and easier quantification, we scored the general quality of flow in the total image area (In contrast to the AVA score, which is determined per quadrant). We assigned a score of 0 for normal flow, a score of 1 for a flow, which was suspicious or the analyzer was not sure, and a score of 2 for an abnormal flow. Suspicious flow was defined as slight flow abnormalities such as either mildly sluggish, intermittent or hyperdynamic flow. Abnormal flow was classified as severely impaired flow such as no flow, severely intermittent, sluggish or hyperdynamic flow. Out of three video sequences we generated the mean, which was described as bedside score in this study. For comparison, we also assessed the standard MFI using AVA (as described above) directly at the bedside in addition to later blinded off-line analysis. Figure 1 depicts a measurement of the microcirculation and analysis obtained from the videos.
After the end of the enrolment period, the data of infants was assigned to either the Antibiotic group (group A), which consisted of children that were treated for newborn infection with a CRP value above 0.5 mg/dl, or the control group (group C) that was composed of healthy children without antibiotic treatment and CRP values of less than 0.5 mg/dl or no CRP measurement.
STATISTICS
RESULTS
Study population
13 children received antibiotic treatment (Group A) due to suspected neonatal infection, leaving 95 children as healthy control group (Group C). In our study population, this accounts for an overall infection rate of 11.8%. Two children were excluded from the study after enrolment, as one mother had poly-drug abuse during pregnancy-which was not known at enrolment-and one child treated with antibiotics despite persistently negative CRP did not match our inclusion criteria of group A or C. An overview of our study population is depicted in figure 2.
Mean CRP in group A was 2.7 mg/dl [95% CI: 2.0 - 3.5] in contrast to a CRP value of 0.21 mg/dl in group C [95% CI: 0.1 - 0.3], which was measured in 44 out of 95 children (46%). All blood cultures remained negative except for one case of Staphylococcus hominis, probably a contamination. Seven children were positive for coagulase negative Staphylococcae, one for Escherichia coli, one for Streptococcus agalactiae in the swab of the ear and one child was positive for Candida albicans in the gastric aspirate (all patients of group A).
The retrospective analysis revealed that SDF scans in group C were obtained significantly earlier than in group A (group C: 26 hours of life [95% CI: 24-29], group A at 37 hours of life [95% CI: 29-45] p <0.05). The clinical data of the two groups such as birth weight and mode of delivery (Table 1) did not differ.
|
Antibiotic Group (A) |
Control Group (C) |
p-value |
|
|
Gestational age (weeks) |
40.6 [40-41] |
39.5 [39-40] |
|
|
Birth weight (g) |
3584 [3311 - 3856] |
3390 [3302-3479] |
|
|
Male sex (%) |
53% |
52% |
|
|
Apgar 10 minutes |
10 [9.7-10] |
10 [9.7-10] |
|
|
Umbilical artery pH |
7.3 [7.2-7.3] |
7.3 [7.3-7.3] |
|
|
Saturation (SaO2%) |
98 [97-99] |
98 [98-98] |
|
|
Heart rate (Min) |
122 [113-131] |
117 [114-119] |
|
|
Axillary temperature at time of measurement (°C) |
37 [36.8-37.3] |
37 [37-37] |
|
|
Age at the measurement (h) |
37.3 [29.3-45.3] |
26.4 [23.6-29.3] |
p<0.001 |
Changes in microcirculatory parameters
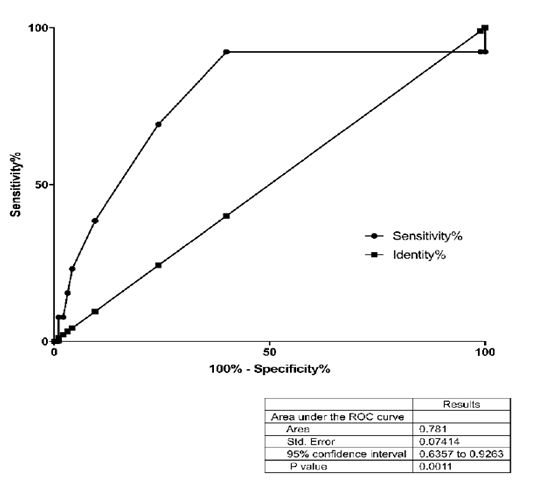
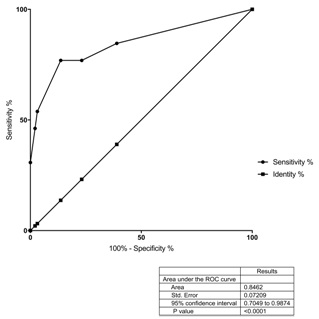
Figure 4: ROC analysis of the bedside score.
|
Antibiotic Group (A) |
Control Group (C) |
p-value |
|
|
Functional vessel density (mm/mm²) |
14.0 [13.6-14.3] |
14.5 [14.3-14.8] |
p<0.05 |
|
Vessel surface (mm2/mm2) × 100% |
24.7 [23.3-26.1] |
25.9 [25.4-26.4] |
n.s. |
|
Diameter distribution (%): · Small vessels (0-10 μm) · Medium vessels (10-20 μm) · Large vessels (> 20 μm) |
52 [51-53] 30 [29-31] 18 [17-19] |
53 [49-57] 29 [26-32] 18 [15-20] |
n.s. |
|
Microvascular Flow Index (MFI) at the Bedside |
3.2 [2.9-3.5] |
3.0 [2.9-3.0] |
p<0.001 |
|
Microvascular Flow Index (MFI) off-line (Blinded) |
3.2 [2.9-3.5] |
3.1 [3.0-3.1] |
p<0.001 |
|
Bedside score |
1.2 [0.8-1.7] |
0.3 [0.2-0.4] |
p<0.0001 |
|
Bedside Score Cutoff 0.85 |
Off-line Mfi Cutoff 3.15 |
|
|
Sensitivity (%) |
77 |
69 |
|
Specificity (%) |
86 |
75 |
|
Positive predictive value (%) |
44 |
28 |
|
Negative predictive value (%) |
97 |
95 |
|
Likelihood ratio for infection |
5.6 |
2.9 |
A regression analysis was used to exclude a potential bias due to a later measurement time point in the group A. R2 was calculated to be
DISCUSSION
A central function of the microcirculation is delivery of oxygen to the periphery. We could show that functional vessel density is reduced early on in infection. This finding is consistent with previous studies demonstrating lower functional vessel density in patients with infection and sepsis [7,12,13,16,19]. The FVD is well validated and seems to be one of the best quantitative indicators of microvascular perfusion. As only RBC-perfused microvessels are included in its measurement, FVD is an indirect parameter for the oxygen transport and distribution capacity [22]. In severe infection, microcirculatory flow is redistributed to maintain oxygen delivery to the central organs. In several studies, sublingual microcirculatory abnormalities have been described and linked to morbidity and mortality in septic shock patients [6,7,19,23]. In this context, a significantly diminished perfusion of small sublingual capillaries in adult patients with septic shock increased over time in survivors in comparison with non-survivors [13]. Similar results were found in patients of pediatric intensive care units with persistent low microcirculatory vessel density in non-survivors of sepsis [7]. Severe abnormalities in microvascular perfused vessel density were associated with organ dysfunction and mortality [24]. In our study population, we could demonstrate a decrease in FVD already early in patients with still mild infection. Nevertheless, analyzing FVD is a very time consuming method, therefore we were searching for other parameters to screen for newborn infection.
In neonates, the microcirculation of the skin reacts early in any disease process, due to the high skin surface ratio and the limited ability to increase the already high heart rate further to increase cardiac output. This might to some extent explain the specific finding of hyperdynamic microcirculatory flow in our study. In adults, sepsis leads to either very heterogeneous or sluggish or no flow [13,19]. By contrast, we found that neonates with mild to moderate infection have rarely the sluggish flow described for severely septic adult patients, but instead demonstrate increased flow. Another explanation for this apparent discrepancy might also be the very early stage of infection in our study in opposite to the septic shock in the microcirculation studies of adults. Like in adults, sluggish to no flow can be observed in pediatric patients in shock [7]. None of the neonates included in our study needed systemic treatment for arterial hypotension, organ dysfunction etc. as seen in severe sepsis. Therefore, we suggest that hyperdynamic flow might be present as an early finding in infection proceeding to severe microcirculatory dysfunction seen in sepsis and septic shock.
As the ROC analysis showed a likelihood ratio of 2.9 for infection for hyperdynamic flow (MFI>3.15) or even 5.6 for a bedside score above 0.85. Thus, these could be suitable parameters for non-invasive monitoring of term infants at risk for postnatal infection. The negative predictive value of 95% for a MFI above 3.15 or even 97% for a bedside score of above 0.85 underlines that analyzing the quality of flow could be a very sensitive screening parameter in future.
Since the scoring system of the MFI was originally developed with adult data, in which most analyzed changes are sluggish to no-flow, abnormal results with mainly hyperdynamic flow might be underestimated. As, the AVA-software assigns 3 points to normal flow, 4 to hyperdynamic and 2-0 to sluggish or no flow, scans with heterogeneous perfusion combining sluggish and hyperdynamic flow in one image can be scored at a mean normal value. Even though in our study most of our data showed a purely hyperdynamic flow, this could be different when studying children with more severe infection. Moreover, a scoring system between 0 to 4 for all quadrants is quite time consuming and needs a lot of expertise and can therefore vary between observers. To address this issue, we introduced another scoring system in which we scored only normal (=0), suspicious (=1) or abnormal flow (=2) irrespective of the actual quality of the flow. Furthermore, only one score was assigned to the whole image. Our results show that this method can be easily applied at the bedside and might be even more effective in diagnosing mild infection in newborns as it could discriminate very well between both groups. For a screening parameter, it would be enough to identify pathological flow no matter whether it is hyper-or hypodynamic, which is less time consuming and might even be less subjective. Recently, it was demonstrated that the blood flow was reliably scored in adult intensive care patients at the bedside by the responsible nurses [25]. The easy and observer-independent application along with little time expenditure are essential requirements for the successful implementation of a screening tool into the clinical routine.
Our study has some limitations. One potential bias in our study group could be that measurements in group A were obtained at a later time point compared to group C. The difference in time point for group A is potentially due to the smaller size of the group. In group a two out of 13 neonates received microcirculatory measurements on the third day of life, which was within our defined prospective study range, but shifted the mean time point of the study. As the observer was blinded to the clinical data of the children, this did not influence the result and we found no correlation between time point of measurements and microcirculation data. However, due to the small number of children analyzed in group A, it was not possible to perform sub-analyses on the microcirculatory parameters for different time frames. It would be desirable to repeat the study with a larger number of infants and shorter time-frame to fully rule out a bias due to differences in the time point.
All children of group A were treated with antibiotics for infection. It cannot be ruled out that this treatment has an effect on the microcirculation, however, this has yet to be studied. Another limitation is the size of the study group. It would be desirable to have a look at a larger study population. However, this is the largest study of newborn infection and microcirculatory data published up to date. We are planning a larger study with shorter time frames to verify the results shown in this paper.
Another problem encountered is that the method cannot visualize the microcirculation of neonates with dark skin pigmentation, as the melanin spots in the skin reflect the LED-light. Sublingual measurements used in adults are difficult due to the strong suck reflex in this age group. However, obtaining images successfully from the buccal mucosa has been reported [26]. In our population, the number of children with dark skin is very low, so we do not think that this has influenced the results of our study.
CONCLUSION
REFERENCES
- Wardlaw T, You D, Hug L, Amouzou A, Newby H (2014) UNICEF Report: enormous progress in child survival but greater focus on newborns urgently needed. Reproductive Health 11: 82.
- Fitchett EJA, Seale AC, Vergnano S, Sharland M, Heath PT, et al. (2016) Strengthening the Reporting of Observational Studies in Epidemiology for Newborn Infection (STROBE-NI): an extension of the STROBE statement for neonatal infection research. Lancet Infect Dis 16: 202-213.
- Wardlaw T, You D, Newby H, Anthony D, Chopra M (2013) Child survival: a message of hope but a call for renewed commitment in UNICEF report. Reproductive Health 10: 64.
- Benitz WE, Wynn JL, Polin RA (2015) Reappraisal of guidelines for management of neonates with suspected early-onset sepsis. J Pediatr 166: 1070-1074.
- Koh IH, Menchaca-Diaz JL, Koh TH, Souza RL, Shu CM, et al. (2010) Microcirculatory evaluation in sepsis: a difficult task. Shock 1: 27-33.
- Sakr Y, Dubois MJ, De Backer D, Creteur J, Vincent JL (2004) Persistent microcirculatory alterations are associated with organ failure and death in patients with septic shock. Crit Care Med 32: 1825-1831.
- Top AP, Ince C, de Meij N, Dijk MV, Tibboel D (2011) Persistent low microcirculatory vessel density in nonsurvivors of sepsis in pediatric intensive care. Crit Care Med 39: 8-13.
- Pranskunas A, Pilvinis V, Dambrauskas Z, Rasimaviciute R, Planciuniene R, et al. (2012) Early course of microcirculatory perfusion in eye and digestive tract during hypodynamic sepsis. Crit Care 16: 83.
- Paize F, Sarginson R, Makwana N, Baines PB, Thomson AP, et al. (2012) Changes in the sublingual microcirculation and endothelial adhesion molecules during the course of severe meningococcal disease treated in the paediatric intensive care unit. Intensive Care Med 38: 863-871.
- Filbin MR, Hou PC, Massey M, Barche A, Kao E, et al. (2014) The microcirculation is preserved in emergency department low-acuity sepsis patients without hypotension. Acad Emerg Med 21: 154-162.
- Alba-Alejandre I, Hiedl S, Genzel-Boroviczény O (2013) Microcirculatory changes in term newborns with suspected infection: an observational prospective study. Int J Pediatr 2013: 768784.
- Weidlich K, Kroth J, Nussbaum C, Hiedl S, Bauer A, et al. (2009) Changes in microcirculation as early markers for infection in preterm infants-an observational prospective study. Pediatr Res 66: 461-465.
- De Backer D, Creteur J, Preiser JC, Dubois MJ, Vincent JL (2002) Microvascular blood flow is altered in patients with sepsis. Am J Respir Crit Care Med 166: 98-104.
- Goedhart PT, Khalilzada M, Bezemer R, Merza J, Ince C (2007) Sidestream Dark Field (SDF) imaging: a novel stroboscopic LED ring-based imaging modality for clinical assessment of the microcirculation. Opt Express 15: 15101-15114.
- Ocak I, Kara A, Ince C (2016) Monitoring microcirculation. Best Pract Res Clin Anaesthesiol 30: 407-418.
- Genzel-Boroviczény O, Strotgen J, Harris AG, Messmer K, Christ F (2002) Orthogonal polarization spectral imaging (OPS): a novel method to measure the microcirculation in term and preterm infants transcutaneously. Pediatr Res 51: 386-391.
- Groner W, Winkelman JW, Harris AG, Ince C, Bouma GJ, et al. (1999) Orthogonal polarization spectral imaging: a new method for study of the microcirculation. Nat Med 5: 1209-1212.
- Hiedl S, Schwepcke A, Weber F, Genzel-Boroviczény O (2010) Microcirculation in preterm infants: profound effects of patent ductus arteriosus. J Pediatr 156: 191-196.
- Ince C (2005) The microcirculation is the motor of sepsis. Crit Care 4: 13-19.
- Schwepcke A, Weber FD, Mormanova Z, Cepissak B, Genzel-Boroviczény O (2013) Microcirculatory mechanisms in postnatal hypotension affecting premature infants. Pediatr Res 74: 186-190.
- De Backer D, Hollenberg S, Boerma C, Goedhart P, Buchele G, et al. (2007) How to evaluate the microcirculation: report of a round table conference. Crit Care 11: 101.
- Botzlar A, Nolte D, Messmer K (1996) Effects of Ultra-Purified Polymerized Bovine Hemoglobin on the Microcirculation of Striated Skin Muscle in the Hamster. European Journal of Medical Research 1: 471-478.
- Boerma EC, van der Voort PH, Ince C (2005) Sublingual microcirculatory flow is impaired by the vasopressin-analogue terlipressin in a patient with catecholamine-resistant septic shock. Acta Anaesthesiol Scand 49: 1387-1390.
- Hernandez G, Boerma EC, Dubin A, Bruhn A, Koopmans M, et al. (2013) Severe abnormalities in microvascular perfused vessel density are associated to organ dysfunctions and mortality and can be predicted by hyperlactatemia and norepinephrine requirements in septic shock patients. J Crit Care 28: 538.
- Tanaka S, Harrois A, Nicolai C, Flores M, Hamada S, et al. (2015) Qualitative real-time analysis by nurses of sublingual microcirculation in intensive care unit: the MICRONURSE study. Crit Care 19: 388.
- Top AP, van Dijk M, Velzen JEV, Ince C, Tibboel D (2011) Functional capillary density decreases after the first week of life in term neonates. Neonatology 99: 73-77.
APPENDIX 1
|
Hours of Life (h) at Measurement |
Max CRP (mg/dl) before Measurement |
Max CRP (mg/dl) after Measurement |
Antiinfective Treatment |
Exclusion Criteria |
|
|
011 NG |
57 |
3,48 |
1,14 |
Ampicillin, Claforan, Nystatin |
|
|
023 NG |
23 |
2,46 |
1,89 |
Cefotaxim, Ampicillin, Nystatin |
|
|
033 NG |
32 |
1,62 |
0,86 |
Ampicillin, Cefotaxim, Nystatin |
|
|
061 NG* |
7 |
0,18 |
8,99 |
Ampicillin, Cefotaxim, Tobramycin Nystatin |
*Excluded from study due to polydrug abuse during pregnancy |
|
062 NG |
41 |
4,93 |
3,14 |
Ampicillin, Cefotaxim, Nystatin |
|
|
069 NG |
23 |
1,61 |
1,93 |
Ampicillin, Cefotaxim, Nystatin |
|
|
076 NG |
28 |
0,89 |
0,48 |
Ampicillin, Cefotaxim, Nystatin |
|
|
077 NG* |
35 |
0 |
0,18 |
*Excluded from study due to negative CRP values and no antibiotic treatment despite admission to ICU, therefore it was not included to group C. |
|
|
089 NG |
49 |
2,72 |
0,67 |
Ampicillin, Cefotaxim, Nystatin |
|
|
094 NG |
33 |
5,04 |
3,15 |
Ampicillin, Cefotaxim, Nystatin |
|
|
096 NG |
32 |
3,98 |
1,98 |
Ampicillin, Cefotaxim, Nystatin |
|
|
102 NG |
44 |
2,09 |
1,96 |
Ampicillin, Cefotaxim, Nystatin |
|
|
103 NG |
57 |
2,5 |
0,47 |
Ampicillin, Cefotaxim, Nystatin |
|
|
106 NG |
17 |
1,46 |
1,04 |
Ampicillin, Cefotaxim, Nystatin |
|
|
110 NG |
49 |
2,84 |
0,61 |
Ampicillin, Cefotaxim, Nystatin |
The clinical data of group A and of children excluded from the study is presented in the Appendix. All children of group A were positive for infection. 2 children were excluded from the study. All children from group A were treated with antiinfectives.
Citation: Puchwein-Schwepcke A, Preußer D, Nussbaum C, Genzel-Boroviczény O (2017) Screening for Infection - An Analysis of the Microcirculation in Term Newborns. J Neonatol Clin Pediatr 4: 020.
Copyright: © 2017 Alexandra Puchwein-Schwepcke, et al. This is an open-access article distributed under the terms of the Creative Commons Attribution License, which permits unrestricted use, distribution, and reproduction in any medium, provided the original author and source are credited.