Journal of Ophthalmology & Clinical Research Category: Clinical
Type: Research Article
Relationship between Axial Length of the Eye and the Retinal Area of Fixation in Normal Test Persons
*Corresponding Author(s):
Møller FDepartment Of Ophthalmology, Vejle Hospital, Vejle, Denmark
Tel:+351 910652534,
Email:f.moeller@dadlnet.dk
Received Date: Aug 13, 2015
Accepted Date: Dec 01, 2015
Published Date: Dec 15, 2015
Abstract
Purpose: To investigate the relationship between the axial length of the human eye and the size of the Retinal Area of Fixation (RAF) in normal test persons.
Methods: Thirty-six eyes of 18 normal test persons (ametropia range - 5.5 D to + 6.5 D) were studied. Full eye examination was performed including ultrasound biometry to assess the axial length. Fixational eye movements were quantified using an infrared recording technique.
Results: A significant positive relation (Pearson’s product-moment correlation) was found between the retinal area of fixation (RAF 95 in arcmin2) and the axial length of both right and left eyes (R = 0.57, p = 0.01 for right eyes; R = 0.54, p = 0.02 for left eyes). A negative relation (Pearson’s product-moment correlation) was found between the retinal area of fixation (RAF 95 arcmin2) and the ametropia (dioptres) of both right and left eyes; however, it was only significant for right eye values (R = 0.51, p = 0.03 for right eyes; R = 0.41, p = 0.09 for left eyes).
Conclusion: Individuals with long eyes were found to use a larger retinal area during fixation compared to short-eyed individuals.
Keywords
Ametropia; Axial length; Fixational eye movements; Microsaccades
INTRODUCTION
Our eyes are never perfectly still. Even when we attempt to fix our gaze, small involuntary eye movements are performed in order to overcome loss of vision due to uniform stimulation of the retinal photoreceptors [1-4]. Three different fixational eye movements have been identified and quantified, these are: Fast microsaccades (duration 25 ms; amplitude typically <0.50 degrees; 0.1-5 Hz) interrupted by slow drifting movements (amplitude typically <0.20 degrees) and constantly, superimposed on these movements, a high frequency (50-100 hz) low amplitude (<0.01 degrees) tremor [5-10]. The retinal area covered by the microsaccadic and drift movements during fixation has been shown to vary substantially in both normal test persons [11-12] and in patients with macular disease. In patients with macular disease, a large fixation area may be due to two or more separated preferred retinal loci of fixation and/or increased microsaccadic amplitudes [13-16]. In normal test persons; however, the reason for the surprisingly large variation in fixation area is unknown.
Histological studies of human retinas have found a density of approximately 200.000 cones/mm² in the centre of the fovea, albeit with large (3.3 fold) interindividual variations [17-19]. The cone density is reduced by 50% only 0.5 degrees away from the foveal centre. In vivo measurements of the foveal cone density by adaptive optics have shown the cone centre-to-centre distance to be related to the axial length of the eye [20]. The longer myopic eye has a longer centre-to-centre distance compared to shorter eyes. In order to activate the same number of cones during steady fixation, the fixational eye movements should, in theory, move the object of interest across a larger retinal area in the myopic eye compared to the hypermetropic eye. Knowing that ametropia is strongly correlated to axial length, the present study was designed to investigate if the fixation area and the mean microsaccadic amplitude are related to axial length and ametropia in the human eye.
Histological studies of human retinas have found a density of approximately 200.000 cones/mm² in the centre of the fovea, albeit with large (3.3 fold) interindividual variations [17-19]. The cone density is reduced by 50% only 0.5 degrees away from the foveal centre. In vivo measurements of the foveal cone density by adaptive optics have shown the cone centre-to-centre distance to be related to the axial length of the eye [20]. The longer myopic eye has a longer centre-to-centre distance compared to shorter eyes. In order to activate the same number of cones during steady fixation, the fixational eye movements should, in theory, move the object of interest across a larger retinal area in the myopic eye compared to the hypermetropic eye. Knowing that ametropia is strongly correlated to axial length, the present study was designed to investigate if the fixation area and the mean microsaccadic amplitude are related to axial length and ametropia in the human eye.
MATERIAL AND METHODS
Thirty-six eyes of 18 normal test persons (mean age 30 years; range 26-41 years) with best corrected visual acuity of 1.0 or better and no history of ocular or neurological disease were investigated. Ametropia ranged from - 5.5D to + 6.5D.
The study was approved by the local ethical committee, and written informed consent was obtained prior to inclusion in the study for each test person. The study conformed to the principles expressed in the Declaration of Helsinki.
The study was approved by the local ethical committee, and written informed consent was obtained prior to inclusion in the study for each test person. The study conformed to the principles expressed in the Declaration of Helsinki.
The eye examination
For each test person the following examinations were performed: Best corrected visual acuity using an ETDRS visual acuity chart at four meters, autorefraction in cycloplegia (cyclogyl 1%), full slit-lamp examination, indirect stereoscopic ophthalmoscopy with a 90 D lens, applanation tonometry and ultrasound biometry in order to determine the axial length. An ophthalmic specialist (FM) performed all eye examinations.
Assessment of fixational eye movements
A 45-second fixation task was performed for each test person during which the person was instructed to fixate on the centre of a black cross (diameter 1.7 cm) on white background shown on a computer monitor at a distance of 70 centimetres. The head of the test person was placed on a chin rest, and the fixation eye movements were recorded using an EyeLink II System (SR Research Ltd., Ottawa, Ontario, Canada).
The EyeLink System consists of two head-mounted infrared video cameras tracing the position of each eye within +/- 20 degrees horizontally and +/- 17 degrees vertically, with a precision of 0.005 degrees. A third infrared camera traces the head movements, and it is therefore possible binocularly to measure eye positions that are controlled for moderate head movements. The X and Y positions of both eyes are recorded in degrees, with a data transit delay of 6-12 milliseconds at a sample rate of 250 Hz, and stored on a computer hard disk. Each data file was post processed as follows: The first 10 seconds of each recording was omitted since head movements and lack of fixation could be observed in the beginning of some recordings leaving 35 seconds for further analysis. A microsaccade was defined as a movement with a minimum velocity of 5 deg/sec accelerating at 2500 deg/sec2 and having a typically microsaccadic configuration with overshoot. The contribution of overshoot to the microsaccidic amplitude was omitted. Time spent in each eye position was determined, and the 95% most frequently used eye positions for each recording were plotted on 2D graph. Subsequently, the retinal area covering these 95% most frequently used fixation points (RAF 95) was calculated as the area of the smallest ellipse circumscribing all eye positions. Using the axial length minus 13.8 millimeters as an estimate of the rotation centre of the eye [21], the metric values (mm2) of the fixation area (RAF 95) were calculated as well.
The EyeLink System consists of two head-mounted infrared video cameras tracing the position of each eye within +/- 20 degrees horizontally and +/- 17 degrees vertically, with a precision of 0.005 degrees. A third infrared camera traces the head movements, and it is therefore possible binocularly to measure eye positions that are controlled for moderate head movements. The X and Y positions of both eyes are recorded in degrees, with a data transit delay of 6-12 milliseconds at a sample rate of 250 Hz, and stored on a computer hard disk. Each data file was post processed as follows: The first 10 seconds of each recording was omitted since head movements and lack of fixation could be observed in the beginning of some recordings leaving 35 seconds for further analysis. A microsaccade was defined as a movement with a minimum velocity of 5 deg/sec accelerating at 2500 deg/sec2 and having a typically microsaccadic configuration with overshoot. The contribution of overshoot to the microsaccidic amplitude was omitted. Time spent in each eye position was determined, and the 95% most frequently used eye positions for each recording were plotted on 2D graph. Subsequently, the retinal area covering these 95% most frequently used fixation points (RAF 95) was calculated as the area of the smallest ellipse circumscribing all eye positions. Using the axial length minus 13.8 millimeters as an estimate of the rotation centre of the eye [21], the metric values (mm2) of the fixation area (RAF 95) were calculated as well.
RESULTS
Table 1, shows for each of the 18 test persons the right and left eye axial length (millimetres), retinal area of fixation (RAF95, in arcmin2 and mm2), ametropia (dioptres, in cycloplegia) and the mean microsaccadic amplitude (degrees ± SD).
| Test person | Axial length (millimetres) | Retinal area of fixation (arcmin2) | Retinal area of fixation (mm2) | Ametropia (diopters) | Microsaccadic amplitude (degrees ± SD) | |||||
| Right eye | Left eye | Right eye | Left eye | Right eye | Left eye | Right eye | Left eye | Right eye | Left eye | |
| 1 | 20.8 | 20.98 | 1281 | 2034 | 0.005 | 0.009 | 5.25 | 6.5 | 0.212 ± 0.071 | 0.218 ± 0.095 |
| 2 | 22.47 | 22.48 | 1402 | 2103 | 0.009 | 0.013 | 0.25 | 0.5 | 0.348 ± 0.087 | 0.383 ± 0.118 |
| 3 | 22.66 | 22.82 | 4909 | 4725 | 0.033 | 0.033 | 0 | 0.5 | 0.404 ± 0.319 | 0.381 ± 0.267 |
| 4 | 22.73 | 22.76 | 1387 | 2366 | 0.009 | 0.016 | 2.5 | 1.5 | 0.391 ± 0.254 | 0.442 ± 0.330 |
| 5 | 23.02 | 22.99 | 1696 | 1869 | 1869 | 0.013 | 0.25 | 0.5 | 0.283 ± 0.139 | 0.252 ± 0.145 |
| 6 | 23.12 | 22.91 | 2181 | 1655 | 0.016 | 0.012 | 0.5 | 0.25 | 0.301 ± 0.074 | 0.304 ± 0.077 |
| 7 | 23.52 | 23.48 | 4754 | 4651 | 0.038 | 0.037 | - 1.5 | - 1.5 | 0.369 ± 0.137 | 0.448 ± 0.154 |
| 8 | 23.6 | 23.53 | 1960 | 1560 | 0.016 | 0.013 | 0.75 | 0.25 | 0.210 ± 0.111 | 0.248 ± 0.130 |
| 9 | 23.73 | 23.51 | 2592 | 3429 | 0.022 | 0.027 | - 0.25 | - 1.5 | 0.574 ± 0.106 | 0.595 ± 0.178 |
| 10 | 23.87 | 24.08 | 2120 | 2258 | 0.018 | 0.02 | - 1.25 | - 1.25 | 0.403 ± 0.047 | 0.406 ± 0.044 |
| 11 | 24.04 | 24 | 2841 | 3257 | 0.025 | 0.029 | - 1 | - 1.25 | 0.231 ± 0.094 | 0.211 ± 0.118 |
| 12 | 24.37 | 24.47 | 6632 | 8337 | 0.063 | 0.08 | - 0.25 | - 0.25 | 0.401 ± 0.164 | 0.371 ± 0.172 |
| 13 | 24.72 | 24.48 | 4114 | 4278 | 0.042 | 0.041 | - 2.75 | - 1.75 | 0.341 ± 0.169 | 0.353 ± 0.167 |
| 14 | 24.77 | 25.15 | 9669 | 7631 | 0.099 | 0.083 | - 1.5 | - 2 | 0.226 ± 0.133 | 0.135 ± 0.011 |
| 15 | 25.13 | 25.07 | 3241 | 4861 | 0.035 | 0.052 | - 1.5 | - 1.5 | 0.467 ± 0.221 | 0.478 ± 0.298 |
| 16 | 25.32 | 25.19 | 4208 | 3179 | 0.047 | 0.035 | - 5 | - 4.75 | 0.293 ± 0.150 | 0.270 ± 0.155 |
| 17 | 25.42 | 25.67 | 6519 | 9222 | 0.075 | 0.11 | - 3.5 | - 3.5 | 0.213 ± 0.089 | 0.221 ± 0.119 |
| 18 | 25.92 | 26.2 | 4362 | 2848 | 0.054 | 0.037 | - 1.75 | - 2.25 | 0.264 ± 0.356 | 0.324 ± 0.250 |
A significant positive relationship (Pearson’s product-moment correlation) was found between the Retinal Area of Fixation (RAF 95 in arcmin2) and the axial length of both right and left eyes (figure 1, R = 0.57, p = 0.01 for right eyes; R = 0.54, p = 0.02 for left eyes). A negative relationship (Pearson’s product-moment correlation) was found between the Retinal Area of Fixation (RAF 95 arcmin2) and the ametropia (dioptres) of both right and left eyes; however, this was only significant for right eye values (figure 2, R = 0.51, p = 0.03 for right eyes; R = 0.41, p = 0.09 for left eyes). For metric values of the fixation area (RAF 95 mm2) similar relationships were found for right eyes (RAF 95 vs axial length: R = 0.72, p<0.01) and left eyes (RAF 95 vs axial length: R = 0.68, p<0.01) values. Consequently, individuals with long axial lengths were found to use a larger retinal area during fixation compared to individuals with short eyes.
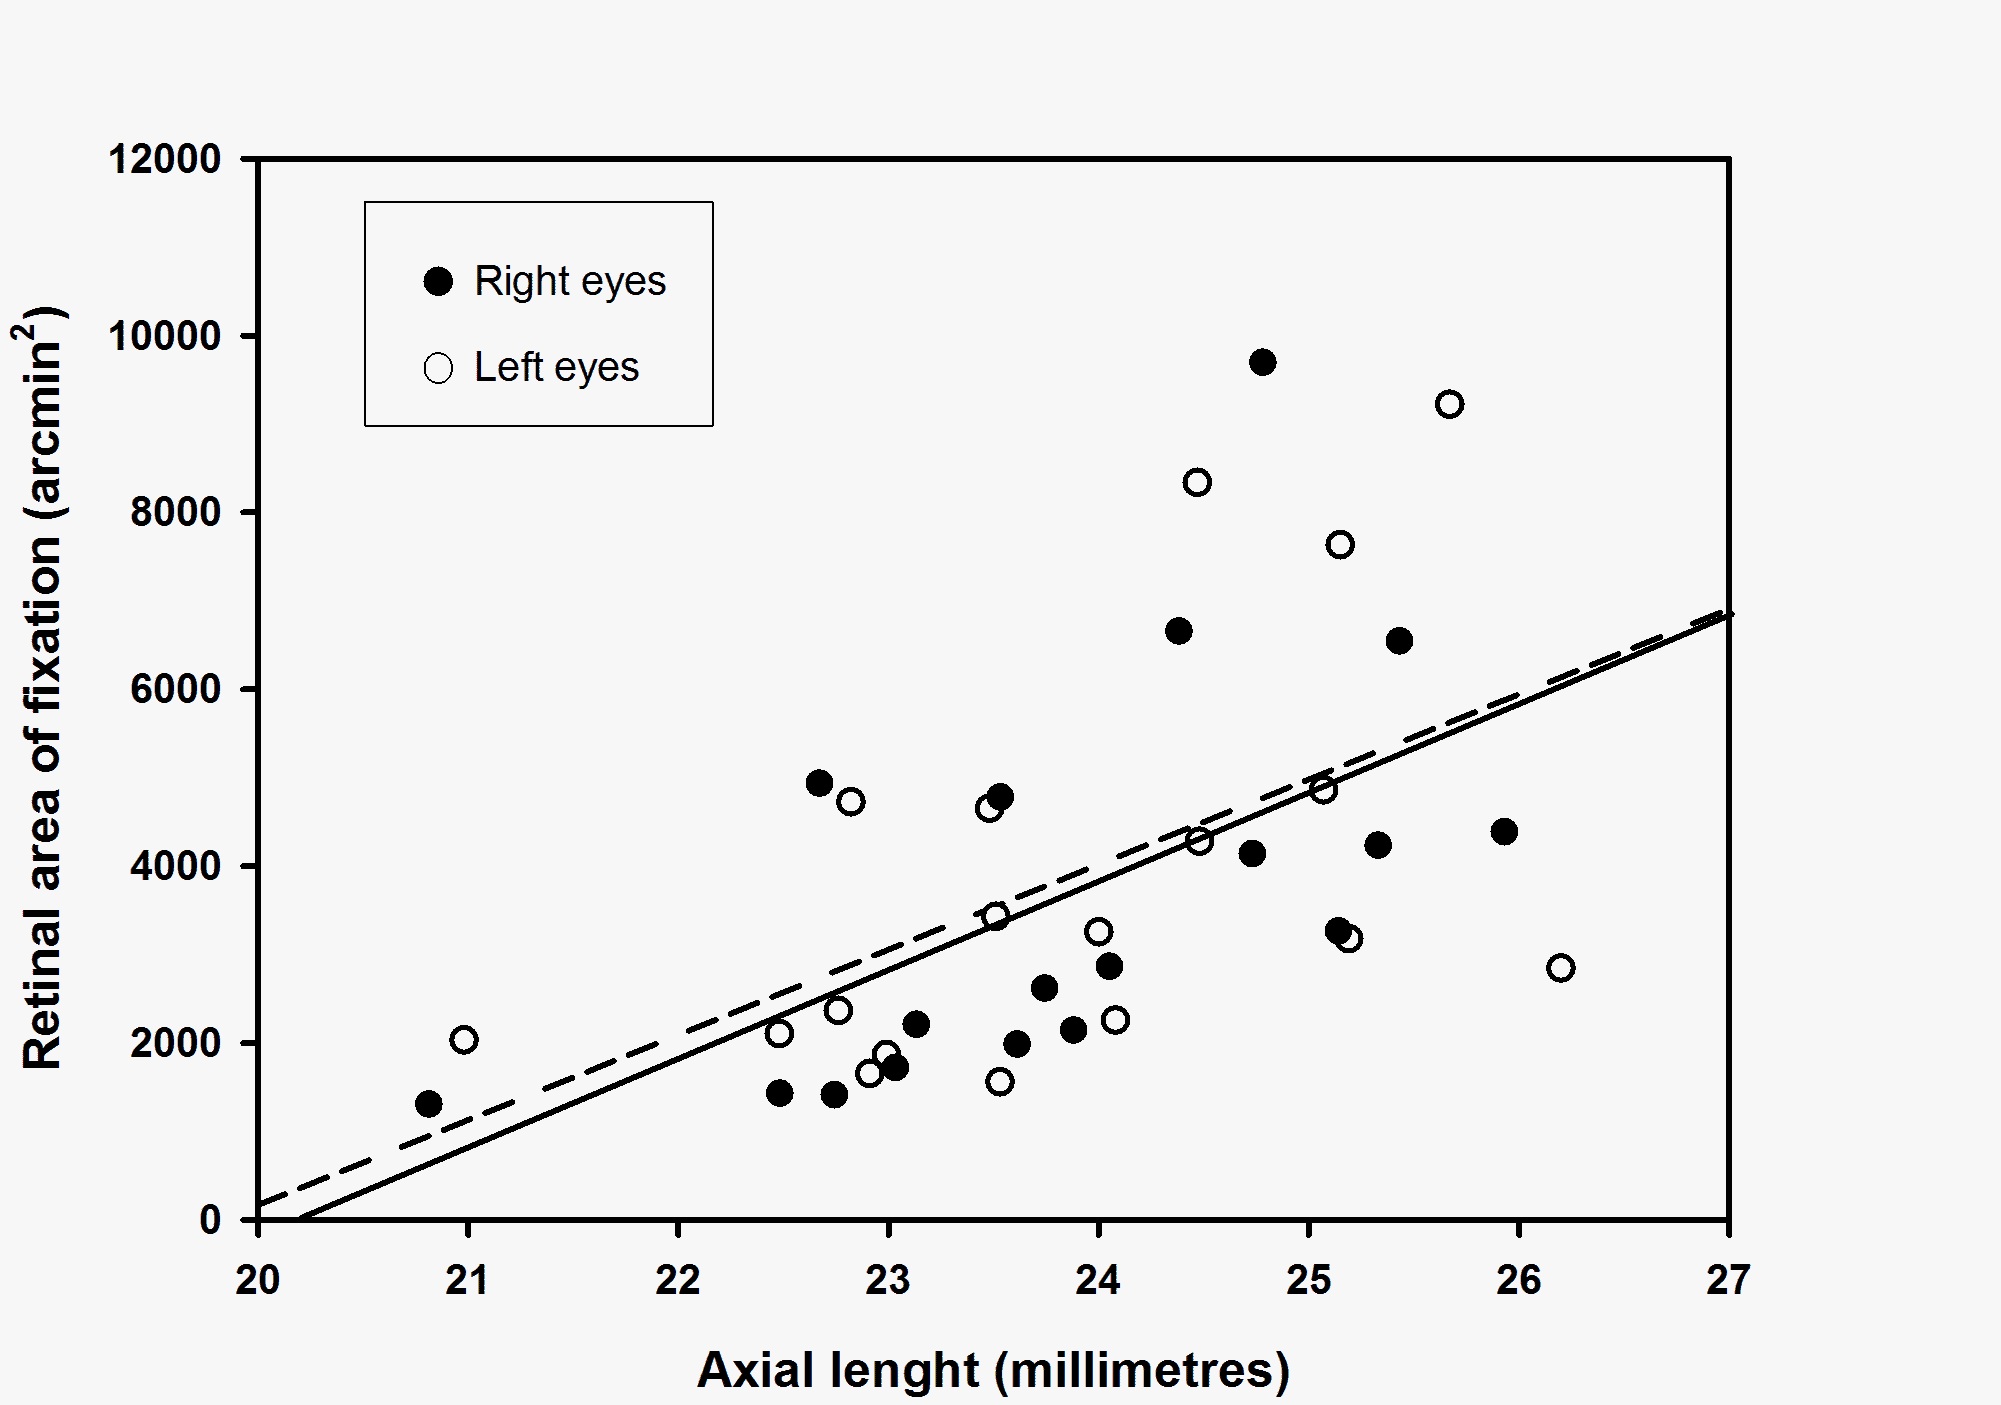
Figure 1: Relationship between the retinal area of fixation (RAF 95, arcmin2) and the axial length (millimetres) for right eyes (filled circles) and left eyes (open circles). Linear regression shows a significant positive correlation (Pearson’s product-moment correlation) for retinal area of fixation (RAF 95) vs axial length for both right eyes (solid line, R = 0.57, p = 0.01) and left eyes (broken line, R = 0.54, p = 0.02).
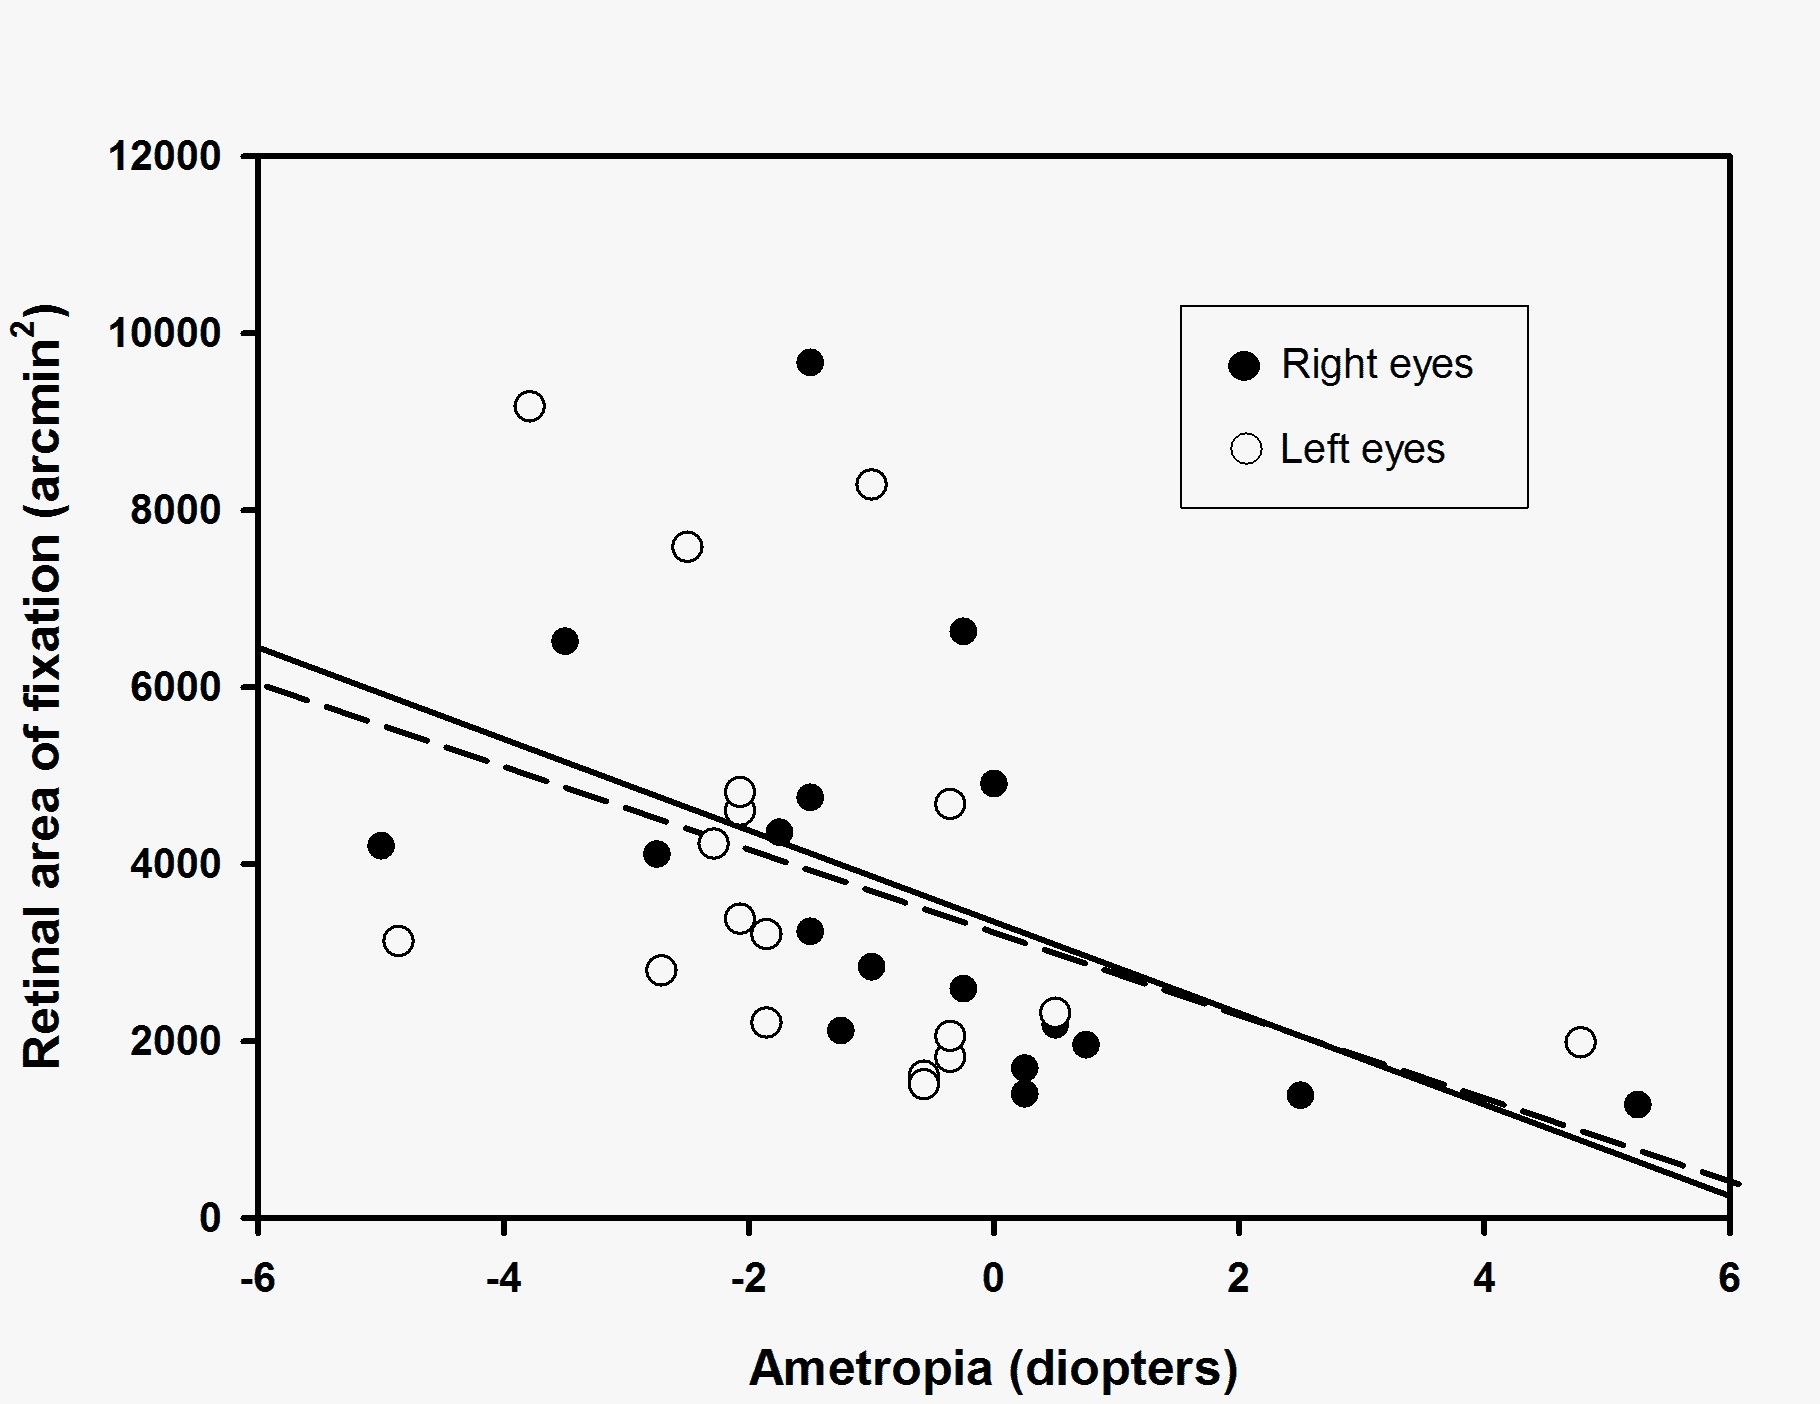
Figure 2: Relationship between the retinal area of fixation (RAF 95, arcmin2) and ametropia (diopters) for right eyes (filled circles) and left eyes (open circles). Linear regression shows a negative correlation (Pearson’s product-moment correlation) for retinal area of fixation (RAF 95) vs ametropia for both right eyes (solid line, R = 0.51, p = 0.03) and left eyes (broken line, R = 0.41, p = 0.09).
DISCUSSION
To our knowledge this is the first study to show a relationship between axial length of the human eye and the size of the retinal area used during fixation. The cause of the increased fixation area in long eyes of myopic individuals is not known. The size of the receptive fields of the photoreceptors, Panum’s fusion area and the photoreceptor density could be factors that influence the size of the fixation area. Several histological studies have shown that the maximal cone density may vary considerably [17-19]. The most recent study by Curcio et al., [18], comprising eight eyes from seven young donors (age 27-44 years), revealed not only a substantial difference in peak cone density between eyes (3.3-fold), but also interindividually a quite large difference in the retinal area covered by the maximal amount of cones. However, neither axial length nor ametropia has been reported in any of these studies.
As in previous studies [11,12,22] large interindividual differences in the retinal area of fixation among normal test persons was found in the present study. The difference in fixation stability may be even more pronounced in patients with macular disease [13,14,23,24]. The size of the fixation area may have clinical implications when applying central laser for macular disease. In a study by Vujosevic et al., [15] of 179 eyes with untreated macular oedema, 29.6% had “pseudo foveas” that would have been covered by standard laser photocoagulation. These results support the findings from a previous study from our group, where patients with diabetic macular oedema were found to have fixation areas estimated to exceed 800 microns on the retinal plane [14]. Accordingly, there is a potential risk of destroying retinal areas used during fixation when applying a standard laser treatment, which according to the ETDRS protocol may be as close as 400 µm from the centre of the fovea avascular zone [25]. Bearing in mind that the risk for subretinal fibrosis or atrophic creep within 1/3 of a disc diameter from the fovea is 21%, following a standard laser treatment for diabetic oedema [26], may advocate for a more cautious approach, when applying central laser photocoagulation for diabetic macular oedema especially in myopic patients.
In a recent study by Otero-Millan et al., [10] comprising both younger (22-38 years) and older individuals (58-74 years) a mean microsaccadic amplitude of 0.46 degrees was found. However, this study used two different eye trackers, an infrared recording technique (as in the present study) for the younger individuals and the most sensitive recording technique (search coil) for the older individuals. Data for each recording technique was not reported. Another study [27], using the most accurate and precise optical recording method (dual-Purkinje-image eyetracker), found a mean microsaccadic amplitude during fixation of 20 minutes arc (0.33 degrees) in six subjects with normal visual acuity. The mean microsaccadic amplitude for all eyes for all subjects in the present study was 0.33 degrees, a result comparable to these more recent studies. However, we did not find any relationship between microsaccadic amplitude and the axial length of the eye. Axial length is closely related to ametropia, and since cone centre-to-centre distance is related to ametropia [20], the amplitude of microsaccades seems not to be influenced by central cone density.
In conclusion, we found that axial length and ametropia of the eye were related to the retinal fixation area. Ametropia could therefore be an important parameter to take into consideration prior to central laser photocoagulation. However, clinical studies are needed in order to reveal if individualizing central photocoagulation according to the size of the fixation area is relevant.
Acknowledgements
This project was kindly supported by “Øjenforeningen, Værn om Synet”.
REFERENCES
- Barlow HB (1952) Eye movements during fixation. J Physiol 116: 290-306.
- Ratliff F, Riggs LA (1950) Involuntary motions of the eye during monocular fixation. J Exp Psychol 40: 687-701.
- Riggs LA, Ratliff F, Cornsweet JC, Cornsweet TN (1953) The disappearance of steadily fixated visual test objects. J Opt Soc Am 43: 495-501.
- Gerrits HJ, De Haan B, Vendrik AJ (1966) Experiments with retinal stabilized images. Relations between the observations and neural data. Vision Res 6: 427-440.
- Ditchburn RW, Ginsborg BL (1953) Involuntary eye movements during fixation. J Physiol 119: 1-17.
- Ditchburn RW, Foley-Fisher JA (1967) Assembled data in eye movements. Opt Acta (Lond) 14: 113-118.
- Møller F, Laursen ML, Tygesen J, Sjølie AK (2002) Binocular quantification and characterization of microsaccades. Graefes Arch Clin Exp Ophthalmol 240: 765-770.
- Schulz E (1984) Binocular micromovements in normal persons. Graefes Arch Clin Exp Ophthalmol 222: 95-100.
- Steinman RM, Haddad GM, Skavenski AA, Wyman D (1973) Miniature eye movement. Science 181: 810-819.
- Otero-Millan J, Schneider R, Leigh RJ, Macknik SL, Martinez-Conde S (2013) Saccades during attempted fixation in parkinsonian disorders and recessive ataxia: from microsaccades to square-wave jerks. PLoS One 8: 58535.
- Jampel RS, Shi DX (2000) Retinal micromovements, the visual line, and Donders’ law. Am J Ophthalmol 129: 224-234.
- Møller F, Laursen ML, Sjølie AK (2006) Fixation topography in normal test persons. Graefes Arch Clin Exp Ophthalmol 244: 577-582.
- Møller F, Bek T (1998) The relation between visual acuity and the size of fixational eye movements in patients with diabetic and non-diabetic macular disease. Acta Ophthalmol Scand 76: 38-42.
- Møller F, Laursen ML, Sjølie AK (2005) Binocular fixation topography in patients with diabetic macular oedema: possible implications for photocoagulation therapy (3rd revision). Graefes Arch Clin Exp Ophthalmol 243: 903-910.
- Vujosevic S, Pilotto E, Bottega E, Benetti E, Cavarzeran F, et al. (2008) Retinal fixation impairment in diabetic macular edema. Retina 28: 1443-1450.
- Greenstein VC, Santos RA, Tsang SH, Smith RT, Barile GR, et al. (2008) Preferred retinal locus in macular disease: characteristics and clinical implications. Retina 28: 1234-1240.
- Farber DB, Flannery JG, Lolley RN, Bok D (1985) Distribution patterns of photoreceptors, protein, and cyclic nucleotides in the human retina. Invest Ophthalmol Vis Sci 26: 1558-1568.
- Curcio CA, Sloan KR, Kalina RE, Hendrickson AE (1990) Human photoreceptor topography. J Comp Neurol 292: 497-523.
- Curcio CA, Sloan KR Jr, Packer O, Hendrickson AE, Kalina RE (1987) Distribution of cones in human and monkey retina: individual variability and radial asymmetry. Science 236: 579-582.
- Dabir S, Mangalesh S, Kumar KA, Kummelil MK, Sinha Roy A, et al. (2014) Variations in the cone packing density with eccentricity in emmetropes. Eye (Lond) 28: 1488-1493.
- Park RS, Park GE (1933) The center of ocular rotation in the horizontal plane. American Journal of Physiology 104: 545-552.
- Kosnik W, Fikre J, Sekuler R (1986) Visual fixation stability in older adults. Invest Ophthalmol Vis Sci 27: 1720-1725.
- Acosta F, Lashkari K, Reynaud X, Jalkh AE, van de Velde F, et al. (1991) Characterization of functional changes in macular holes and cysts. Ophthalmology 98: 1820-1823.
- Culham LE, Fitzke FW, Timberlake GT, Marshall J (1993) Assesment of fixation stability in normal subjects and patients using a scanning laser Ophthalmoscope. Clin Vision Sci 8: 551-561.
- [No authors listed] (1985) Photocoagulation for diabetic macular edema. Early Treatment Diabetic Retinopathy Study report number 1. Early Treatment Diabetic Retinopathy Study research group. Arch Ophthalmol 103: 1796-1806.
- Lövestam-Adrian M, Agardh E (2000) Photocoagulation of diabetic macular oedema--complications and visual outcome. Acta Ophthalmol Scand 78: 667-671.
- Ko HK, Poletti M, Rucci M (2010) Microsaccades precisely relocate gaze in a high visual acuity task. Nat Neurosci 13: 1549-1553.
Citation: Møller F, Brandstorp-Boesen J (2015) Relationship between Axial Length of the Eye and the Retinal Area of Fixation in Normal Test Persons. J Ophthalmic Clin Res 2: 016.
Copyright: © 2015 Møller F, et al. This is an open-access article distributed under the terms of the Creative Commons Attribution License, which permits unrestricted use, distribution, and reproduction in any medium, provided the original author and source are credited.
Journal Highlights
© 2024, Copyrights Herald Scholarly Open Access. All Rights Reserved!