ABSTRACT
BackgroundThere are few studies that comprehensively explore a large scale of variables within one study population to correctly determine the variables that are truly significant in determining grip and pinch strength. Furthermore studies that have been conducted on this subject mostly offer conflicting reports and are based on different geographical populations. The goal of this study is to explore a large scale of variables and their relationship to grip and pinch strength and to establish reference values to help clinicians asses loss of grip and pinch strength in patients.
MethodsA cross-sectional study was conducted on 309 participants between 18 and 80 with at least one healthy upper extremity. The grip and pinch strength was measured using a Jamar hand dynamometer in position two and a Jamar hydraulic pinch gauge.
Results & ConclusionA total of 309 participants were included in this study, 152 (49.2%) males and 157 (50.8%) females between the age of 18 and 80 years old. Linear regression analysis reveals a varying set of variables significantly associated with grip and pinch strength (p ≤ 0.05). For grip strength, these are age, sex, height, weight, and thickest forearm circumference, while for pinch strength these are sex, weight, thickest forearm circumference, and hand length.
Keywords
Anthropometric data; Dutch adults; Grip strength; Hand; Normative strength values; Pinch strength
Level of Evidence
2
Introduction
In patients with injuries to the hands and arms, measuring the hand grip and pinch strength is a quick and simple way to evaluate the functionality of the hand [1-4]. However measuring the grip strength in the presence of pain or fear of pain will not give an accurate outcome, for example in arthritis [5,6], which would lead to a patient exerting less strength when undergoing measurements. Another important factor which can effect grip strength is wrist instability and its many causes [7-9]. The interpretation of grip strength can only be done objectively if there are reference values which can be compared to the measured grip and pinch strength of a patient. These however are scarce, especially for the European population making the evaluation of grip strength subjective to the clinicians experience and expectations. Another solution would be to measure the grip strength in the contralateral hand and compare those results with that of the injured hand [10]. This however gives rise to a number of problems, namely that the grip strength in the dominant hand would be significantly higher than in the non-dominant hand [11,12]. However in different cases it would seem that only right handed individuals have a significantly higher grip strength in the dominant hand [13-16]. While others say there is no significant difference in grip strength between the dominant and non-dominant hand [17,18]. This makes it unclear whether or not measuring the grip strength in the contralateral hand is a suitable means for determining what the grip strength in the affected hand should be. Evidently this method of assessing grip strength would also be useless if there is a case of bilateral loss of grip strength. The solution for this is to have reference values of hand grip and pinch strength means or a formula in which one could insert a number of patient dependent variables and then calculate the predicted grip and pinch strength [11,17]. But to achieve this we must first determine which variables are truly determinative for the grip and pinch strength.Several studies have reported that grip strength has a correlation with a number of variables, these range from the health status and physical activity [19,20] to occupation [21] and anthropometric factors such as the circumference of the forearm and height [22]. But the variables that were measured, their correlations and the statistical significance of these variables vary between the studies and are based on completely different geographical populations. Furthermore according to a Korean study on normative measurements on grip and pinch strength no significant correlations have been found between anthropometric variables and grip strength in women [18]. To our knowledge there are few studies that comprehensively explore a large scale of variables within the same study population to correctly determine the variables that are truly significant in determining grip and pinch strength.
Materials and Methods
Participants
To evaluate the relationship between anthropometric data and grip and pinch strength, healthy adults were recruited using well defined criteria. The inclusion criteria used were: Healthy individuals between 18 and 80 years of age who have at least one normally functioning upper extremity. As for the exclusion criteria the following were used: 1) Neurological or muscle disease causing loss of strength in the upper extremities or 2) use of medication that causes loss of strength in the upper extremities or 3) trauma to the upper extremities which impairs grip strength (specifically in the dominant hand) or 4) cognitive problems preventing the participant in understanding the instructions.The study was conducted in Maastricht, The Netherlands, at the Maastricht University Medical Centre (MUMC+). The aim was to obtain at least 240 voluntary participants with 20 males and 20 females in each age group (18-29, 30-39, 40-49, 50-59, 60-69, 70-80). These numbers were chosen in order to ensure there is enough heterogeneity in the study population to be able to correct for age and sex.
Study protocol
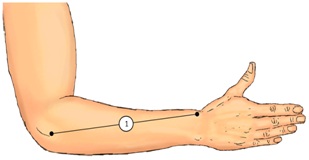
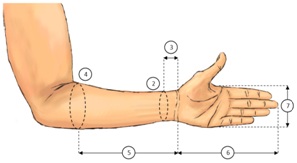
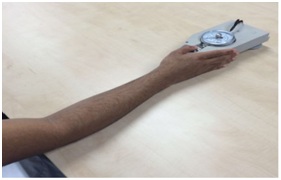
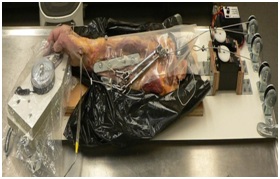
One medical intern screened and invited all the participants and also conducted all the measurements in a time span of three months. This individual was extensively trained and closely supervised during the first set of measurements by a plastic surgeon specialized in hand surgery (senior author). All potential participants were selected and invited by mail one week prior to their appointment at the outpatient clinic of the MUMC+. Informed consent was obtained from each participant. Basic information was first obtained: Surname, date of birth, gender, hand dominance, length, weight and medical history (in accordance to the exclusion criteria). If the participants met the requirements, further anthropometric data was taken and all measurements were done in centimeters (Figures 1 and 2).1) Forearm length (measured from the proximal border of the lateral epicondyle of the humerus to the radial styloid process). 2) Thinnest forearm circumference. 3) Distance between the thinnest forearm circumference till the distal wrist crease. 4) Thickest forearm circumference. 5) Distance between the thickest forearm circumference till the distal wrist crease. 6) Hand length (measured from the distal wrist crease till the tip of the third finger). 7) Hand width (measured at the height of the distal palmar crease). Upon completing the necessary documentation the grip and pinch strength were measured using a calibrated Jamar hand dynamometer in position two [23] and a calibrated Jamar hydraulic pinch gauge (Sammons Preston Rolyan). All grip and pinch strength measurements were conducted according to the recommendations of the American Society of Hand Therapists [24]. The participant was seated with the arm in neutral position and elbow flexed to 90 degrees. The forearm was held in a neutral position with little to no flexion nor ulnar deviation of the wrist. The grip and pinch strength were measured three times in kilograms and the mean was calculated and used as the outcome [25]. Two subgroup measurements were performed on a smaller portion of the participants. The first subgroup measurements were performed to analyze the difference between dominant and non-dominant hand grip and pinch strength. The second subgroup measurements were performed to compare the outcome of pinch grip strength measured in the classical way with the outcome of pinch grip strength measured in a specific fixed position, the fixed pinch position. In the fixed pinch position the participant is sitting down in front of a table with the upper arm adducted to the torso and the forearm (from the elbow down) fixed on the table. The participant would then rest his/her palm and stretched fingers to the side of a specially built Jamar hydraulic pinch gauge holder. The participant would then, using only his/her thumb, press downwards on the pinch gauge without lifting the forearm or grabbing the pinch gauge holder with the other fingers (Figure 3). This would allow us to assess the force that the muscles in the thumb are able to exert without synergistic action from muscles of the other fingers or wrist. This data would also allow us to testa cyclic loading model we are developing, in another study, which is similar to other experimental settings reported in literature [26]. The cyclic loading model can then be used in future experimental cadaver research which requires researchers to mimic realistic pinch forces (Figure 4).
Data analysis
Using descriptive statistics numerical variables were presented by mean (Standard Deviation, SD) and categorical variables by number of patients (%). Independent samples t-tests were carried out to investigate the differences in numerical variables between men and women, where paired-samplest-tests were used for differences between dominant and non-dominant hand and between the fixed pinch position and normal pinch position. An analysis of normal distribution of variables was also conducted.Linear regression analysis was performed to analyze the uncorrected and corrected effect of patient characteristics on grip and pinch strength, where the corrected effects were obtained by adding all variables in one multivariable linear regression model. Multicollinearity was checked using Variance Inflation Factors (VIF), where a VIF > 10 indicates a collinearity problem. No multicollinearity was found in our models. We considered p-values ≤ 0.05 to be statistically significant. Because this study is exploratory we did no correct for multiple testing. IBM SPSS Statistics for Windows (version 21.0, Armonk, NY: IBM Corp) was used for all statistical analyses.
Results
A total of 309 participants were included in this study. They consist of 152 (49.2%) males and 157 (50.8%) females, ranging from 18 to 80 years old. With the exception of age (p = 0.315), all other patient characteristics show a statistically significant difference in mean values between men and women (Table 1). The normal distribution of all variables is well within the acceptable range of skewness (< 1.96). The mean grip and pinch strength was significantly higher for men than for women (p < 0.001) (Table 2). Men had a 16.7kg higher mean grip strength, which translates to 63.1% more grip strength compared to women. This was similar for the pinch strength where men had a 3.4kg higher mean pinch strength, which translates to 53.6% more pinch strength compared to women.Analyzing all variables separately revealed the uncorrected effects of age, sex, height, weight, forearm length, thinnest forearm circumference, thickest forearm circumference and its distance till distal wrist crease, hand length and hand width to be significantly correlated to grip strength (all p-values ≤ 0.001). This was not the case for the variable distance till distal wrist crease in relation to the thinnest forearm circumference (p = 0.980) (Table 3). However, after correcting for the effects of all the variables by analyzing them as part of one singular model, only the corrected effects of age, sex, height, weight and the thickest forearm circumference remained significantly correlated to grip strength (all p-values ≤ 0.001) (Table 3).Analysis revealed a similar pattern when separately analyzing the same variables in relation to the pinch strength, where the uncorrected effects of sex, height, weight, forearm length, thinnest forearm circumference, thickest forearm circumference and its distance till distal wrist crease, hand length, and hand width were significantly correlated to pinch strength (all p-values ≤ 0.001). The uncorrected effects of age (p = 0.443) and distance till distal wrist crease in relation to thinnest forearm circumference (p = 0.142) were not significant (Table 4).Once again, after correcting for the effects of all the variables by analyzing them as part of one singular model, only the corrected effect of sex (p ≤ 0.001), weight (p ≤ 0.001), thickest forearm circumference (p ≤ 0.001) and hand length (p = 0.005) remained significantly correlated to pinch strength (Table 4).When looking at hand dominance, women were found to have a statistically significant higher grip and pinch strength in the dominant hand versus the non-dominant hand. No such significant difference was found in men (Table 5). When comparing the standard measuring position with the fixed pinch position, a significant difference was found. In the fixed pinch position, without synergistic action from muscles of the other fingers and wrist, the muscles of the thumb were only able to exert 59.4% of the normal pinch strength in men (6.4kg versus 10.2kg) and only 62.7% of the normal pinch strength women (3.8kg versus 6.3kg) (Table 6).
Discussion
When it comes down to the hand, there are different sets of factors which were independently related to grip and pinch strength. For grip strength, the factors that must be taken into account are age, sex, height, weight, and thickest forearm circumference, while sex, weight, thickest forearm circumference, and hand length are important for pinch strength. With respect to the forearm circumference, some studies measured it at the midpoint of the forearm length [11] or at a predetermined point along the forearm [27]. We did not do this due to the fact that, from person to person, the point at which the circumference decreases and how gradually it does so varies. Thus, to avoid undermining the anatomical variations between humans, we measured the forearm circumference at its maximum point.Regarding age, a distinct difference was seen between the grip and pinch strength. The mean grip strength is rather stable from age 18 till the age of 60-69 for both men and women, with men’s grip strength slightly increasing (a total increase of 3.5kg) and women's grip strength slightly decreasing (a total decrease of 2.2kg) throughout the years, after which the grip strength sharply declines. This is similar to what was seen by Sternäng et al., where grip strength sharply decreased after 72 years of age for men and after 67 years of age for women [28]. However our data places the sharp decline in mean grip strength for men a few years earlier. In contrast to the mean grip strength, the mean pinch strength remains stable throughout the years, from 18 till 80 years of age, in total only decreasing 0.2kg for men and 0.6kg for women. In contrast to what our data reveals, the UK study by Anakwe et al., concluded that there was no predictive relationship for height and weight [10]. Although they base their conclusion on a smaller study population than in our study, it is plausible that the cause for the differing results might be due to inter-population differences. Thus the follow-up question would be, what are the inter-population differences? The Anakwe et al., study population had a higher mean height for men (178cm) and women (171cm) compared to a mean height of men (172cm) and women (166cm) in our study population. While the mean grip strength in the dominant hand for the Anakwe et al., population was also higher for men (48.6kg) and women (28.5kg) compared to the mean grip strength of men (43.0kg) and women (26.4kg) in our study population [10]. Such differences were also seen in a Spain and USA based study. In the Spain based study a mean grip strength of 35.1kg for men and 22.8kg for women was observed [29], while the mean grip strength in the USA based study is 62.1kg for men and 36.7kg for women [30]. Compared to the European studies, the mean grip strength in the USA based study is noticeably higher. The method in the American study differs from the other studies in testing grip strength in all five positions of the Jamar hand dynamometer. Regardless of its position, they then selected the highest grip strength outcome as the maximum grip strength for each participant. Interestingly enough in the majority of the participants (61%) the maximum grip strength was found in position 2 of the Jamarh and dynamometer. Ultimately it is unclear which factors truly contribute to the big difference in grip strength. This is due to the lack of reported patient and anthropometric data [30].The lack of sufficient patient and anthropometric data is a recurring shortcoming in many studies concerning grip strength. This makes it impossible to extrapolate data from studies based on other geographical populations and apply it to one's own population. This further emphasizes the importance of region-specific grip strength studies. To our surprise the data concerning the fixed pinch strength brought new insights to the use of standard forces in cadaver studies concerning cyclic loading in the hand and wrist. Our analysis has revealed that the standard forces being used in cadaver studies are likely incorrect. The reason for this is that the fixed pinch strength forces, that we measured, are significantly higher than the standard forces being applied in cadaver studies to this day. The Korean study states that there is a clear correlation between the hand width and the hand grip strength in men [18]. When separately analyzing this variable there indeed seems to be a correlation to hand grip strength. However when analyzing hand width as part of a single model it is no longer identifiable as a significant variable. The reason for this is that while certain variables are indicated to have a significant effect on grip strength, the degree to which they determine the grip or pinch strength in relation to other variables is so small that its contribution is relatively insignificant. The confounding effect on the separately analyzed variables is thus corrected when analyzing all variables as part of one model. Thus using the thickest forearm circumference is a more reliable indicator for assessing grip strength than using the hand width. The same is seen in Lopes et al., where hand width, which according to their study has a high independent correlation, fails to explain enough variability in the outcome when analyzed as part of one multiple regression model and is thus not used in their predictive hand strength equation [11]. As with the Korean study [18] and Brazilian study [11] we used our data to create a predictive formula, which could be used to help clinicians and researchers assess the grip and pinch strength in patients. To do this we incorporated all variables which were significant in determining the grip and pinch strength. Using linear regression we created the following formulas with age in years, height in cm, weight in kg and thickest forearm circumference in cm.Predictive grip strength (kg) = -70.958 + (-0.139 × Age) + (8.590 × Sex (Female=1, Male=2)) + (0.307 × height) + (-0.232 × weight) + (2.431 × Thickest forearm circumference)Predictive pinch strength (kg) = -12.619 + (1.715 × Sex (Female=1, Male=2)) + (-0.049 × weight) + (0.534 × Thickest forearm circumference) + (0.407 × Hand length)These predictive formulas could come close to accurately predicting the grip and pinch strength but further data is necessary to further increase their accuracy.
Conclusion
In conclusion, the factors independently associated with grip strength were age, sex, height, weight and thickest forearm circumference, whereas for pinch strength these factors were sex, weight, thickest forearm circumference, and hand length. Using these specific variables further research could be done and a valuable database and predictive formula could be created with a higher predictive accuracy. This could further aid clinicians and researchers in assessing grip and pinch strength in patients and help in determining whether or not there is loss of strength in the hand and to what extent the loss is.
Acknowledgement
Conflicting interest
The authors declared no potential conflicts of interest with respect to the research, authorship, and/or publication of this article.
Approval ethical committee
This study was approved by the medical ethics review committee azM/UM.