Comparison of Quality of Life and Lund Mackay Score in Subgroups of Rhinosinusitis
*Corresponding Author(s):
Peter CatalanoDepartment Of Otolaryngology, St. Elizabeth’s Medical Center, Brighton, United States
Tel:+1 6179992936,
Fax:+1 6177796080
Email:Peter.Catalano@steward.org
Abstract
Rhinosinusitis (RS) may be sub-classified into several groups based on duration of symptoms, etiology, associated clinical history, and findings during endoscopic nasal examination. While one may dissect RS into several subgroups, the four major clinical categories are Recurrent Acute Rhinosinusitis (RARS), Chronic Rhinosinusitis without Nasal Polyps (CRSsNP), Chronic Rhinosinusitis with Nasal Polyps (CRSwNP), and Hyperplastic Rhinosinusitis (HRS).
Keywords
INTRODUCTION
The economic healthcare burden of RS is estimated to be in the region of $5.8 billion annually, while the Quality of Life (QoL) impact of RS is just as significant [4]. Studies have identified lower QoL scores in CRS patients compared to those with congestive heart failure, chronic back pain, and chronic obstructive pulmonary disease [5]. Furthermore, CRSwNP patients were identified as having a lighter QoL burden than CRSsNP, excluding congestion as a symptom [6]. Thus, one cannot predict the QoL impact associated with RS from imaging studies and endoscopic findings alone.
Indeed, the severity of disease on a pre-treatment CT scan can be a valid predictor of outcome following surgery for certain subsets of CRS [7], however, current diagnostic methods for evaluating sinonasal disease correlate poorly with QoL [8,9].
Along with the patient history and findings during nasal endoscopy, the Lund-Mackay (LM) CT scoring system is used to determine the sub-type of RS in a given patient. From a clinical, endoscopic, and radiologic standpoint, there are distinct clinical differences between the sub-types of RS as described herein, namely RARS, CRSsNP, CRSwNP, and HRS.
However, to our knowledge, there is currently no single published comparison between QoL and the main subtypes of rhinosinusitis. Zheng et al., have investigated the relationship between QoL and LM scores [10], and the correlation between different QoL instruments, but not the relationship between QoL scores and the main subgroups of RS. Thus, the aim of this paper is to explore the relationship between the pre-treatment QoL assessments in the major sub-categories of RS.
METHODS
The CT images were graded using the validated LM staging system, where each sinus and each osteomeatal complex is judged to be clear, partially opaque, or completely opaque, thereby yielding a numeric score between a minimum of 0 and a maximum of 24 [8].
Each patient also completed a Sinonasal Outcome Test-20 (SNOT-20) questionnaire (Table 1) to assess the QoL impact of their condition. The SNOT-20 is a frequently utilized and validated disease specific questionnaire (Table 1) [11]. It is based on 20 questions divided into five subgroups (nasal symptoms, paranasal symptoms, sleep-related symptoms, and social and emotional impairment), with the severity of the symptoms rated on a 6-point likert scale. Statistical analysis using post-hoc pair wise T-tests and ANOVA was performed using Graphpad Prism Inc., version 6.
| No Problem | Very Mild Problem | Mild or Slight Problem | Moderate Problem | Severe Problem | Problem as Bad as it can be | |
| 1. Need to blow nose | 0 | 1 | 2 | 3 | 4 | 5 |
| 2. Sneezing | 0 | 1 | 2 | 3 | 4 | 5 |
| 3. Runny nose | 0 | 1 | 2 | 3 | 4 | 5 |
| 4. Cough | 0 | 1 | 2 | 3 | 4 | 5 |
| 5. Postnasal discharge | 0 | 1 | 2 | 3 | 4 | 5 |
| 6. Thick nasal discharge | 0 | 1 | 2 | 3 | 4 | 5 |
| 7. Ear fullness | 0 | 1 | 2 | 3 | 4 | 5 |
| 8. Dizziness | 0 | 1 | 2 | 3 | 4 | 5 |
| 9. Ear pain | 0 | 1 | 2 | 3 | 4 | 5 |
| 10. Facial pain/pressure | 0 | 1 | 2 | 3 | 4 | 5 |
| 11. Difficulty falling asleep | 0 | 1 | 2 | 3 | 4 | 5 |
| 12. Wake up at night | 0 | 1 | 2 | 3 | 4 | 5 |
| 13. Lack of a good night’s sleep | 0 | 1 | 2 | 3 | 4 | 5 |
| 14. Wake up tired | 0 | 1 | 2 | 3 | 4 | 5 |
| 15. Fatigue | 0 | 1 | 2 | 3 | 4 | 5 |
| 16. Reduced productivity | 0 | 1 | 2 | 3 | 4 | 5 |
| 17. Reduced concentration | 0 | 1 | 2 | 3 | 4 | 5 |
| 18. Frustrated/ restless / irritable | 0 | 1 | 2 | 3 | 4 | 5 |
| 19. Sad | 0 | 1 | 2 | 3 | 4 | 5 |
| 20. Embarrassed | 0 | 1 | 2 | 3 | 4 | 5 |
RESULTS
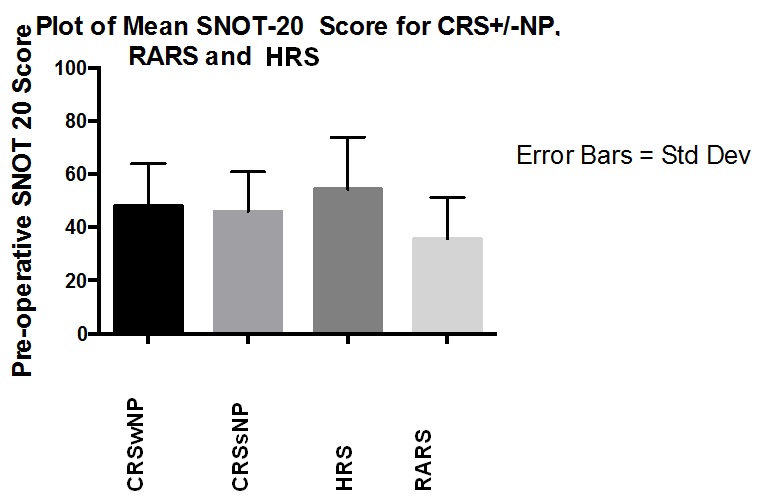
Figure 1: Mean pre-operative SNOT-20 scores in each subgroup.
| SNOT-20 (male) | SNOT-20 (female) | |
| CRSwNP | 43.6 | 57.5 |
| CRSsNP | 40.75 | 48.2 |
| HRS | 53 | 55.25 |
| RARS | 33.75 | 36.5 |
DISCUSSION
The SNOT-20 score is a disease-specific questionnaire, originally devised as a condensed version of the Rhinosinusitis Outcome Measure (RSOM-31) that was developed by Piccirillo in 1995 [16]. While it fails to address nasal obstruction and olfactory dysfunction (which were subsequently added to make the SNOT-22 questionnaire), historically, most of the published studies relating to QoL in RS use the SNOT-20 instrument, and for this reason it was chosen as the QoL measure in our patients instead of the SNOT-22.
Our study of the four main subgroups of RS demonstrated the HRS group to be the most symptomatic and RARS, the least symptomatic, according to pre-operative SNOT-20 evaluations (54.3 and 35.6, respectively), with a statistically significant difference between the two. The CRSwNP group had an elevated mean SNOT-20 over the CRSsNP group (48 and 45.8, respectively), but was less symptomatic than the HRS group (54.3).
Previous studies have also demonstrated significantly worse symptoms and signs using both the SNOT-20 and an endoscopic scoring system in patients with HRS over CRSwNP [17]. Bhattacharyya and Lee found that the sinus symptoms in RARS and CRS (wNP and sNP) were similar in magnitude [18]. The mean preoperative SNOT-20 score in our HRS subgroup was higher at 54.3 versus 48 for the CRSwNP subgroup. These scores are both higher when compared with scores reported in the literature of 31.1 and 22.1, respectively [17]. This may be related to the different environment and weather patterns existing in the Northeast, in comparison to that of Augusta, Georgia, where the prior study was performed.
Interestingly, the mean SNOT-20 scores for each of the 4 subgroups was higher in female patients than in males (Table 2), indicating that females are more symptomatic overall. This is contrary to other studies [19,20] that have not demonstrated a gender difference in pre-treatment SNOT-20 scores, and is the first study to suggest that RS may impact the QoL differently in males and females.
The decision to operate on patients for RS is based on a combination of history, clinical examination, response to medications, and radiological imaging findings. The treatment offered the patients in this study is beyond the scope and intent of this investigation. Our study was focused on differences in baseline QoL between patients with different sub-types of RS.
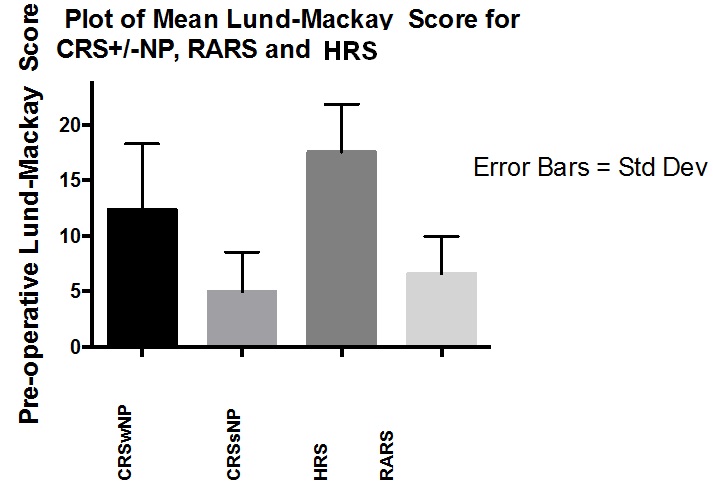
A non-contrast CT of the nose and paranasal sinuses allows a privileged view of the nasal cavity, sinuses, and osteomeatal complex which may be difficult to appreciate with endoscopic assessment alone (e.g., Haller cells, concha bullosa, intra-sinus disease). The LM scoring system was developed to allow the interpretation of the CT of the nose and paranasal sinuses to confirm and quantify the degree of inflammation present in an unambiguous manner. To this end, it has demonstrated high inter-observer reliability. The mean LM scores of 12.6, 5.0, 17.6 and 6 in the CRSwNP, CRSsNP, HRS, and RARS groups, respectively, are also notably higher than those documented for similar subgroups in other studies. Elsewhere, the mean LM score reported in CRS patients was 9.8 [21], and in RARS 3.8 [22]. Our analysis showed the LM scores differed significantly between each subgroup in our study, with the exception of the RARS and CRSsNP groups. Contrary to what was anticipated, the RARS group actually had a higher mean LM score than the CRSsNP group.
The discrepancies existing between the RARS and CRSsNP groups in relation to their Symptoms (SNOT-20) and imaging (LM scores) are noteworthy. In our study, the RARS group was the less symptomatic, but had more changes on CT imaging when compared with the CRSsNP group. Patients with RARS, by definition, are thought to have clear ‘normal’ imaging between attacks of RS, and perhaps the ease with which patients can access our office and obtain immediate CT imaging for real-time review may explain a higher mean LM score of 6 compared with 3.8 in a prior study [21].
As Lund identified previously, the results of diagnostic studies for CRS do not correlate well with the patient’s perception of their QoL [9]. This raises an important question - do we rely more on CT findings, or on the patient’s subjective complaints as indications for treatment? Upon comparing the SNOT-20 and LM scores for each subgroup, a non-significant correlation between the two scores was demonstrated. In patients who had imaging performed for non-rhinological symptoms, the “normal” LM score was found to be 4.3 [21]. Some advocate a LM score of at least 4.0 as an indication for endoscopic sinus surgery [8], while others suggest a score ranging from 0 to 5 to be within the incidentally ‘normal’ range [22]. Currently, there is no pre-operative SNOT-20 score that is generally accepted as an indicator of whether or not a patient would benefit from sinus surgery. However, comparing pre - and post-operative scores, Piccirillo et al., believed a SNOT-20 standardized response mean (calculated by mean change score divided by its standard deviation) of >0.8 to be a “clinically significant” improvement between pre and post-op SNOT-20 scores [11].
As mentioned earlier, Zheng et al., investigated the correlation between three QoL instruments, and the relationship between these questionnaires and the patient’s corresponding LM scores [10]. They found very good correlation between the SNOT-20, SF-36, and Visual Analog Scale, however, there was no correlation between any of the QoL metrics and corresponding LM scores. As in our study, they did find a higher and statistically significant difference in CT stage between patients with CRSwNP vs CRSsNP, but the QoL scores were better in their CRSwNP subgroup vs the CRSsNP subgroup. In our study, the QoL scores between these 2 subgroups were similar with the SNOT-20 scores for the CRSwNP subgroup slightly worse than the CRSsNP subgroup (48 vs 46, respectively). Both studies used the SNOT-20 as opposed to the SNOT-22 QoL instrument, and the differences in findings between studies highlights the complexity in assessing subjective symptoms across heterogenous populations having the same clinical diagnosis.
CONCLUSION
REFERENCES
- Rosenfeld RM, Andes D, Bhattacharyya N, Cheung D, Eisenberg S, et al. (2007) Clinical practice guideline: adult sinusitis. Otolaryngol Head Neck Surg 137: 1-31.
- Fokkens WJ, Lund VJ, Mullol J, Bachert C, Alobid I, et al. (2012) European Position Paper on Rhinosinusitis and Nasal Polyps 2012. Rhinol Suppl 23: 1-298.
- Kennedy JL, Borish L (2013) Chronic sinusitis pathophysiology: the role of allergy. Am J Rhinol Allergy 27: 367-371.
- Hopkins C, Gillett S, Slack R, Lund VJ, Browne JP (2009) Psychometric validity of the 22-item Sinonasal Outcome Test. Clin Otolaryngol 34: 447-454.
- Gliklich RE, Metson R (1995) The health impact of chronic sinusitis in patients seeking otolaryngologic care. Otolaryngol Head Neck Surg 113: 104-109.
- Soler ZM, Smith TL (2010) Quality of life outcomes after functional endoscopic sinus surgery. Otolaryngol Clin North Am 43: 605-612.
- Stewart MG, Donovan DT, Parke RB Jr, Bautista MH (2000) Does the severity of sinus computed tomography findings predict outcome in chronic sinusitis? Otolaryngol Head Neck Surg 123: 81-84.
- Hopkins C, Browne JP, Slack R, Lund V, Brown P (2007) The Lund-Mackay staging system for chronic rhinosinusitis: how is it used and what does it predict? Otolaryngol Head Neck Surg 137: 555-561.
- Lund VJ (2001) Health related quality of life in sinonasal disease. Rhinology 39: 182-186.
- Zheng Y, Zhao Y, Lv D, Liu Y, Qiao X, et al. (2010) Correlation between computed tomography staging and quality of life instruments in patients with chronic rhinosinusitis. Am J Rhinol Allergy 24: 41-45.
- Piccirillo JF, Merritt MG Jr, Richards ML (2002) Psychometric and clinimetric validity of the 20-Item Sino-Nasal Outcome Test (SNOT-20). Otolaryngol Head Neck Surg 126: 41-47.
- Serrano E, Neukirch F, Pribil C, Jankowski R, Klossek JM, et al. (2005) Nasal polyposis in France: impact on sleep and quality of life. J Laryngol Otol 119: 543-549.
- Brandsted R, Sindwani R (2007) Impact of depression on disease-specific symptoms and quality of life in patients with chronic rhinosinusitis. Am J Rhinol 21: 50-54.
- Benninger MS, Khalid AN, Benninger RM, Smith TL (2010) Surgery for chronic rhinosinusitis may improve sleep and sexual function. Laryngoscope 120: 1696-1700.
- Litvack JR, Mace JC, Smith TL (2009) Olfactory function and disease severity in chronic rhinosinusitis. Am J Rhinol Allergy 23: 139-144.
- Piccirillo JF, Edwards D, Haiduk A, Yonan C, Thawley SE (1995) Psychometric and clinimetric validity of the 31-item Rhinosinusitis Outcome Measure (RSOM-31). Am J Rhinol 9: 297-306
- Jang DW, Comer BT, Lachanas VA, Kountakis SE (2014) Aspirin sensitivity does not compromise quality-of-life outcomes in patients with Samter’s triad. Laryngoscope 124: 34-37.
- Bhattacharyya N, Lee KH (2005) Chronic recurrent rhinosinusitis: disease severity and clinical characterization. Laryngoscope 115: 306-310.
- Bezerra TF, Piccirillo JF, Fornazieri MA, Pilan RR, Pinna Fde R, et al. (2012) Assessment of quality of life after endoscopic sinus surgery for chronic rhinosinusitis. Braz J Otorhinolaryngol 78: 96-102.
- Bush CM, Jang DW, Champagne JP, Kountakis SE (2013) Epidemiologic factors and surgical outcomes in patients with nasal polyposis and asthma. ORL J Otorhinolaryngol Relat Spec 75: 320-324.
- Bhattacharyya N, Fried MP (2003) The accuracy of computed tomography in the diagnosis of chronic rhinosinusitis. Laryngoscope 113: 125-129.
- Ashraf N, Bhattacharyya N (2001) Determination of the “incidental” Lund score for the staging of chronic rhinosinusitis. Otolaryngol Head Neck Surg 125: 483-486.
Citation: Catalano P, Ericksen M (2015) Comparison of Quality of Life and Lund Mackay Score in Subgroups of Rhinosinusitis. J Otolaryng Head Neck Surg 1: 003.
Copyright: © 2015 Peter Catalano, et al. This is an open-access article distributed under the terms of the Creative Commons Attribution License, which permits unrestricted use, distribution, and reproduction in any medium, provided the original author and source are credited.