Analytical Techniques for a Rapid Determination of Nitrogen Content in Extra Virgin Olive Oil
*Corresponding Author(s):
Telloli CDepartment Of Nuclear Safety, Division Of Security And Sustainability, Energy And Sustainable Economic Development (ENEA), Italian National Agency For New Technologies, Martiri Di Monte Sole 4, 40129, Bologna, Italy
Tel:+ 39 0516098485,
Email:chiara.telloli@enea.it
Abstract
Keywords
CN; Olive oil; Traceability; Xylella fastidiosa
INTRODUCTION
The traceability of OO allows characterizing the identity, history and origin of the product in order to strengthen its food safety [5]. As a matter of that, Extra Virgin Olive Oil (EVOO) must follow specific characteristics as chemical, physical, biological or sensory nature to be included in the commercial market but it is difficult to verify the authenticity of OO due to the wide range of categories, cultivations, pedoclimatic conditions and working methods.
With the use of rapid analytical methods, it is possible to verify the presence of pollutants in the OO with the aim of eliminating the risk of fraud. A typical chemical-physical characteristic of the OO is the acidity, conventionally expressed as a percentage of free oleic acid. Acidity is useful to recognize extra virgin, virgin, lampante or refined olive oil. The Commission Implementing Regulation (EU) No 1348/2013 describes the guidelines for a correct identification of OO, and the Regulation (EC) No 1989/2003 and the International Olive Council (2015) describe the values and the analytical technique of titration to define the characteristics of OO to be introduced into the economic market [6-8].
In the years 2013-2015, in the main Italian regions producing EVOO, olive trees suffered a dangerous attack by Xylella fastidiosa pathogen, and a new legislation was adopted, regarding the “measures to prevent the introduction into and the spread within the Union of Xylella fastidiosa” [9]. In 2014, the bacterium, which grows in the xilema of the plant caused a reduction in the production of olives and consequently of EVOO [10-12]. The impact of this pathogen on the productivity of olive groves was devastating, despite that, the economic market did not suffer any losses, leaving the doubt that more or less legal methods were used to have the same quality of EVOO.
Recent studies shown that the presence of nitrogen from fertilizers could implement the metabolism of nitrogen of the plant [13,14]. Massive use of fertilizers could be used to restore fertile activity in olive trees during these years in the Italian region affected by the Xylella fastiosa. For this reason, the presence of fertilizer could be a critical factor for the quality of OO and for the safety of the agro-food product, which is in contrast to the EU anti-fraud directives [15].
The object of this paper was to develop an analytical technique for determining traces of nitrogen in samples of EVOO from different Italian regions and several years (2013-2015). The analytical method was developed favoring quick analysis times, simple sample treatment procedures, and limited use of reagents. The analytical technique considered is based on an elemental combustor, which allows complete oxidation of the matrix (eg., OO) by simultaneously separating species containing carbon and nitrogen.
MATERIALS AND METHODS
Sampling
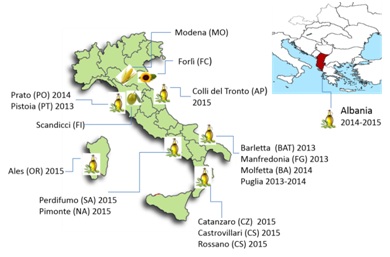
Figure 1: Map of Italy, where the origin of the samples analyzed is specified. On the top, map of the Mediterranean area with Albania region. Next to the names of origin of the olive oil samples, the production years are specified.
Table 1 shows the list of the OO samples collected. After collection, all samples were transported to ENEA (Italian National Agency for New Technologies, Energy and Sustainable Economic Development) laboratory in Bologna (Italy) and maintained at a constant conditions of temperature (laboratory room temperature: 22°C) until analyses were performed.
|
Sample |
Location |
Year |
|
EVOO-001 |
Italy Toscana: Pistoia (PT) |
2013 |
|
EVOO-002 |
Italy Puglia: Barletta (BAT) |
2013 |
|
EVOO-003 |
Italy Puglia: Manfredonia (FG) |
2013 |
|
EVOO-004 |
Italy Puglia |
2013 |
|
EVOO-005 |
COOP FIORE |
2013 |
|
EVOO-006 |
Albania |
2014 |
|
EVOO-007 |
Italy Toscana: Prato (PO) |
2014 |
|
EVOO-008 |
Italy Puglia: Molfetta (BA) |
2014 |
|
EVOO-009 |
COOP FIORE |
2014 |
|
EVOO-010 |
Albania |
2015 |
|
EVOO-011 |
Italy Marche: Colli del Tronto (AP) |
2015 |
|
EVOO-012 |
Italy Campania: Perdifumo (SA) |
2015 |
|
EVOO-013 |
Italy Campania: Pimonte (NA) |
2015 |
|
EVOO-014 |
Italy Calabria: Catanzaro (CZ) |
2015 |
|
EVOO-015 |
Italy Castrovillari (CS) |
2015 |
|
EVOO-016 |
Italy Rossano (CS) |
2015 |
|
EVOO-017 |
Italy Sardegna: Ales (OR) |
2015 |
|
OO-001 |
Italy Toscana: Scandicci (FI)* |
/ |
|
CO-001 |
Italy Emilia-Romagna: Modena (MO)* |
/ |
|
SFO-001 |
COOP* |
/ |
Titration
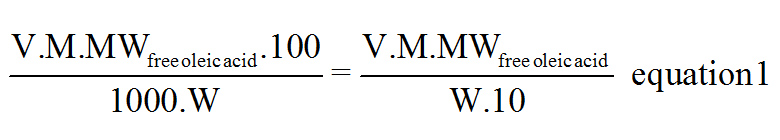
V = Sample Volume
M = Molarity of the Titrant (NaOH)
MWfree oleic acid = Molecular Weight = 282.46 g/mol
W = Sample Weight.
CN Vario Max Cube
The automatic sampler inserts the crucible into the combustion zone, where oxygen is injected directly on the sample. A second post combustion reactor converts possible byproducts of the combustion to carbon dioxide. Excess oxygen removal, conversion of nitrogen oxides to N2 and removal of Sulphur is achieved in the tungsten reduction system. The analytical gases N2 and CO2 are completely separated by the purge and trap separation system. The gases are sent to the high performance Thermal Conductivity Detector (TCD) [16]. At the beginning of the analysis, standard samples (Aspartic acid) were analyzed for the calibration of the instrument.
RESULTS
Table 2 also shows the average concentrations of carbon and nitrogen analyzed by CN Vario Max Cube. Carbon concentration is expressed in percentage, instead of nitrogen is expressed in Parts Per Million (PPM) in order to observe quantifiable nitrogen values. The results underline that carbon value is constant in all the samples, whereas nitrogen value is variable.
|
|
Acidity (%free oleic acid) |
C (%) |
C (dev std) |
N (ppm) |
N (dev std) |
|
EVOO-001 |
0.28 |
77.38 |
0.08 |
405.5 |
32.44 |
|
EVOO-002 |
0.65 |
77.16 |
0.12 |
454.3 |
36.35 |
|
EVOO-003 |
0.54 |
77.20 |
0.08 |
568.1 |
45.45 |
|
EVOO-004 |
0.31 |
77.43 |
0.15 |
354.1 |
28.33 |
|
EVOO-005 |
0.42 |
77.32 |
0.18 |
396.0 |
31.68 |
|
EVOO-006 |
1.20 |
77.36 |
0.12 |
260.6 |
20.85 |
|
EVOO-007 |
1.30 |
77.05 |
0.08 |
478.2 |
38.26 |
|
EVOO-008 |
1.00 |
77.10 |
0.11 |
360.3 |
28.82 |
|
EVOO-009 |
0.64 |
77.33 |
0.14 |
366.7 |
29.34 |
|
EVOO-010 |
7.20 |
76.92 |
0.23 |
260.5 |
19.80 |
|
EVOO-011 |
0.34 |
77.06 |
0.14 |
120.0 |
24.56 |
|
EVOO-012 |
2.70 |
77.07 |
0.33 |
162.4 |
52.29 |
|
EVOO-013 |
0.92 |
77.01 |
0.14 |
101.2 |
8.10 |
|
EVOO-014 |
0.48 |
77.08 |
0.08 |
100.8 |
8.06 |
|
EVOO-015 |
0.45 |
77.09 |
0.02 |
136.7 |
15.28 |
|
EVOO-016 |
3.10 |
77.51 |
0.41 |
133.3 |
10.67 |
|
EVOO-017 |
0.56 |
77.05 |
0.18 |
108.1 |
1.13 |
|
OO-001 |
0.17 |
77.14 |
0.11 |
256.9 |
90.69 |
|
CO-001 |
0.17 |
77.28 |
0.08 |
156.8 |
21.31 |
|
SFO-001 |
0.22 |
77.22 |
0.12 |
126.7 |
21.58 |
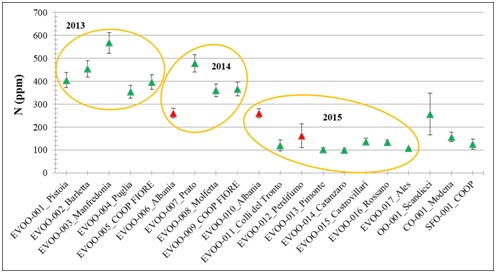
Figure 2 shows that nitrogen concentration is higher in the samples from 2013-2014, period characterized by the Xylella fastidiosa pathogen. In red, the Albania and Perdifumo samples show nitrogen concentration comparable to each other but lower respect to the Italian samples. SFO and CO show a similar nitrogen concentration of the EVOOs, whereas OO shows higher nitrogen concentration than EVOOs.
DISCUSSION
Titration shows that two EVOO samples, obtained with handmade methods, have a very high quantity of acidity; this anomaly could be related to the type of extraction. CN analysis proved to be a fast and accurate technique to characterize nitrogen and carbon concentration in EVOO samples: an analysis in 7 or 10 minutes. The high nitrogen concentration analyzed by CN could be related to the massive use of nitrogen fertilizer on olive trees.
EVOO samples produced in 2013 and 2014 years show higher nitrogen concentration compared to 2015. This could be related to the use of nitrogen-based fertilizers, in order to increase the yield of the olive oil product, strongly down because of the infestation due to Xylella fastidiosa pathogen. In 2013, in fact, the pathogen Xylella fastidiosa caused severe damage to all the olive trees in the Mediterranean area. In Puglia (South of Italy), Xylella fastidiosa infected 74,000 acres causing a major decrease in OO production during the years 2014 and 2015[17]. This may cause a massive use of fertilizers by farmers. In accordance with this hypothesis, the Puglia Region has proposed a planning spray with insecticides to reduce the Xylella fastidiosa pathogen. Between the infestation and the effect of some frosts, the production of olive oil in the areas affected by the pathogen could be reduced by 60% [18]. On the other side indicated that an excessive use of nitrogen fertilizers on olive trees leads to a slow deterioration of sensory qualities [19].
CONCLUSION
Elemental analysis by CN Vario Max Cube was useful to determine the nitrogen content in samples of extra virgin olive oil; its applicability to this matrix and the information obtainable for the purposes of characterization of the oils has been studied. The analysis carried out on samples of extra-virgin olive oil using the elementary combustor proved to be a fast and precise technique to characterize the nitrogen and carbon content in olive oil. The innovation made by the instrument allows the use of samples without pre-treatments reducing analysis times and costs. The concentration of nitrogen, expressed in Parts Per Million (PPM), was higher in extra virgin olive oils produced in the years 2013 and 2014, compared to those of 2015. This could be due to the use of nitrogenous fertilizers in order to increase the yield of the product due to the infestation of the Xylella fastidiosa pathogen. It is interesting to note that the two highest values of N are related to two samples of 2013, coming from the same region Puglia, which was strongly affected by the infestation of the pathogen. The use of a new generation elementary combustor for olive oil screening can be useful for identifying trends and / or anomalies in the elemental composition of the matrix.
REFERENCES
- Pegasus (2002) General Principles and Requirements of Food Law - Regulation (EC) No 178/2002. Pegasus, London, UK.
- Directive 2001/95/EC of the European Parliament and of the Council of 3 December 2001 on general product safety.
- International Olive Oil Council (2016a) World Olive Oil Production. International Olive Oil Council, Madrid, Spain.
- International Olive Oil Council (2016b) EU Olive Oil Production. International Olive Oil Council, Madrid, Spain.
- Commission Implementing Regulation (EU) No 29 (2012) Marketing standards for olive oil.
- Commission Implementing Regulation (EU) No 1348 (2013) Regulation (EEC) No 2568/91 on the characteristics of olive oil and olive-residue oil and on the relevant methods of analysis.
- Regulation (EC) No 1989 (2003) Regulation (EEC) No 2568/91 on the characteristics of olive oil and olive-pomace oil and on the relevant methods of analysis.
- International Olive Council (2015) Determination of free fatty acids, cold method. International Olive Council, Madrid, Spain.
- Commission Implementing Regulation (EU) 789 (2015) Measures to prevent the introduction into and the spread within the Union of Xylella fastidiosa.
- Fernàndez-Escobar R, Beltràn G, Sànchez-Zamora MA, García-Novelo J, Aguilera MP, et al. (2006) Olive Oil Quality Decreases with Nitrogen Over-fertilization. Hort Science 41: 215-219.
- Burbank LP, Ortega BC (2018) Novel amplification targets for rapid detection and differentiation of Xylella fastidiosa subspecies fastidiosa and multiplex in plant and insect tissues. J Microbiol Methods 155: 8-18.
- Monteiro MP, Clerici JH, Sahoo PK, Cesar CL, de Souza AA, et al. (2017) Stiffness signatures along early stages of Xylella fastidiosa biofilm formation. Colloids Surf B Biointerfaces 159: 174-182.
- Lominadze S, Nakashidze N (2016) The influence of nitrogen fertilizers on nitrate accumulation in leaves of orange Washington Navel. Annals of Agrarian Science 14: 233-236.
- Li Y, Sun Y, Liao S, Zou G, Zhao T, et al. (2017) Effects of two slow-release nitrogen fertilizers and irrigation on yield, quality, and water-fertilizer productivity of greenhouse tomato. Agr Water Manage 186: 139-146.
- De Lange E (2013) Report on the food crisis, fraud in the food chain and the control thereof (2013/2091(INI)). Committee in the Environment, Public Health and Food Safety, A7-0434/2013.
- http://www.elementar.de/en/products/organic-elemental-analysis/vario-max-cube.html
- Bucci EM (2018) Xylella fastidiosa, a new plant pathogen that threatens global farming: Ecology, molecular biology, search for remedies. Biochem Biophys Res Commun 502: 173-182.
- Giliberto J (2018) Xylella: il batterio minaccia la Terra di Bari, la Puglia ricorre agli insetticidi. Corriere della Sera.
- Vossen PM (2007) Organic Olive Production Manual. UCANR Publications, California, USA.
Citation: Rizzo A, Telloli C (2019) Analytical Techniques for a Rapid Determination of Nitrogen Content in Extra Virgin Olive Oil. J Agron Agri Sci 1: 005.
Copyright: © 2019 Telloli C, et al. This is an open-access article distributed under the terms of the Creative Commons Attribution License, which permits unrestricted use, distribution, and reproduction in any medium, provided the original author and source are credited.