Cafeteria Diet Associated with the Chronic Stress Does Not Alter Biochemical and Hematological Parameters in Wistar Rats
*Corresponding Author(s):
Guilherme MalafaiaDepartamento De Ciencias Biologicas, Instituto Federal Goiano - Campus Urutaí, Universidade Federal De Goiás - Câmpus Samambaia, GO, Brazil
Tel:+55 6434651996,
Email:guilhermeifgoiano@gmail.com
Abstract
Methods: Animals were fed with rodent standard feed or cafeteria diet and, from the eighth week, grouped in (a) standard diet (Std); (b) Std + stress; (c) cafeteria diet (Cafe) and (d) Cafe + stress. The animals of groups non-stressed control and stressed control were fed with rodent standard feed and those of groups non-stressed obese and stressed obese, besides the standard feed, were offered a cafeteria diet (variety of processed food). The following parameters were evaluated: body mass (weekly), hematological parameters (erythrogram and leukogram), glycemia, lipidogram, relative mass of adrenal gland and visceral and retroperitoneal fat.
Results: The cafeteria diet was effective in inducing obesity, while stress induced by restriction caused an increase in the relative adrenal gland mass, a recognized stress parameter. There was no alteration in the biochemical or in the hematological parameters caused by the interaction of obesity and chronic stress. However, obesity was able to induce hyperglycemia and leukocytosis driven by neutrophilia and lymphocytosis.
Conclusion: We conclude that the cafeteria diet used in this study is effective in inducing obesity in female Wistar rats, but association with chronic stress did not alter hematological and biochemical parameters.
Keywords
INTRODUCTION
Side by side with the obesity, the chronic stress is another health problem that affects millions of people in the world due to the dynamics and every-day rush. As discussed by Taylor & Stanton [6], chronic stress can result from a certain condition and/or life style and cause an ample range of behavioral changes. Among them, changes in eating habits are reflected by an interaction between the organism’s physiological state and environmental conditions [7,8]. Chronic stress is associated with metabolic disorders and changes in energy homeostasis [9,10], which can induce pleasant and compulsive behaviors, such as the intake of sweet and fat-rich foods, and consequently leading to and reinforcing the condition of obesity [11,12].
Obesity is considered an “extreme” linked to nutrition, whose effects can be overestimated when in association with chronic stress. Although the importance of the analysis of the joint effects of obesity and chronic stress is recognized [13-22], studies evaluating the effects of this association in biochemical and hematological parameters are still lacking. In addition, some studies involving obesity and stress have pointed to different results when males and females are evaluated [23-27]. Especially for stress, various stressor agents and protocols have been used. According to Franceschelli et al., [24], the chronic mild stress model is one of the most extensively investigated animal models of chronic stress. However, only a limited number of studies have been conducted with female rodents. In relation to obesity, although some works have been conducted using female rats [28-32], the biochemical and hematological aspects have not been the focus of these studies.
Therefore, there is a gap in knowledge when it comes to factors that can possibly be altered in situations where there is an overlap of obesity and stress effects. Thus, the objective of our study is to analyze the effects of obesity in association with chronic stress on biochemical and hematological parameters in Wistar rats. Our hypothesis is that obesity associated with chronic stress by restraint induces biochemical and hematological changes in female Wistar rats.
METHODOLOGY
Animals and experimental groups
We emphasize that the diet started at forty-five days old and then subsequent manipulations were performed when the animals were young adults. The animals were maintained individually in cages and all procedures were approved by the Institutional Committee for Animal Care and Use of the Instituto Federal Goiano, Goiás, Brazil (protocol n. 003/2014) in accordance with the Guide for the Care and Use of Laboratory Animals, 8th edition (2011). Animal handling and all experiments were carried in accordance with the International Guidelines for Animal Welfare.
Experimental design
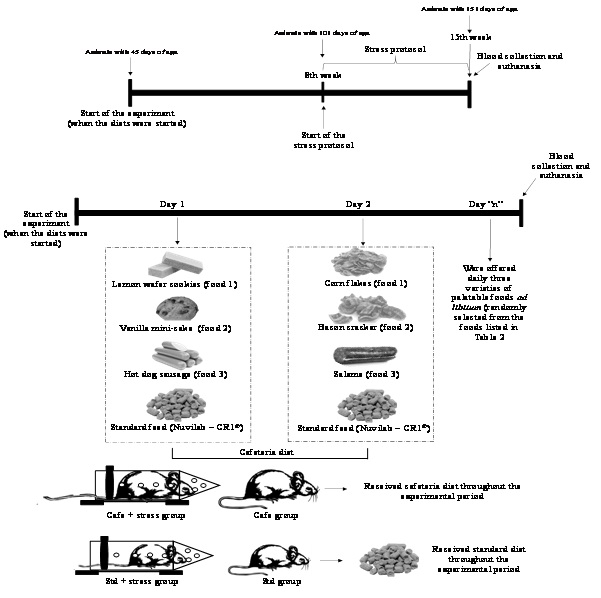
After eight weeks, Std + stress and Cafe + stress groups were subjected to a protocol of chronic stress by restriction, as proposed by Ely et al., [37]. In order to limit the animal’s movements, a plastic tube (25 cm × 7 cm) was used, with the frontal part open to allow breathing. The animals were subjected to the stressor agent for an hour in the afternoon (from 2 p.m. to 3 p.m.), for five days a week, during 50 days.
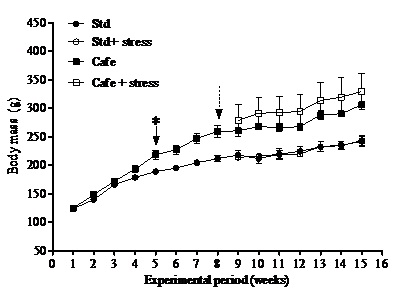
Body mass was the parameter taken as indicator of obesity and measured weekly. As proposed by Levin et al., [38], the animals considered obese were those that gained 15% or more weight than the animals that were not fed with the Cafe diet.
After the completion of the stress protocol, the animals were anaesthetized with pentobarbital 40 mg/kg via intraperitoneal for blood sampling from the brachial plexus. To assess the hematological parameters, a hemogram composed by erythrogram and leukogram was performed using an automatized ABX-Micros 60 hematology analyzer. For dosages of total proteins and fractions and lipid profile the automatized method A15 - Biosystems. Glycemia was determined using test strips (ACCU-CHECK Advantage II, Roche) coupled to a portable digital glucose meter.
For hematological and biochemical analyses, 5 mL of blood were collected from those animals fasted for at least 9 hours. The blood was separated in plastic tubes. After blood collecting, the animals were euthanized by exsanguination, and visceral and retroperitoneal fat were weighed. After the euthanasia, the relative mass of adrenal gland was weighed, as indicator of the stress parameter [21]. The mass of the adrenal gland was normalized to body weight using the following ratio: mass of the organs (g) /body weight (g).
Data analysis
| Ingredients of the standard feed(1) | |
| Ground whole corn, Soybean bran, Wheat bran, Calcium carbonate, Dicalcium phosphate, Sodium chloride, Mixture of vitamins, Minerals and Amino acids. | |
| Specifications(1) | Warranty levels per kg of the product (g/kg)(1) |
| Moisture | 125 |
| Casein(2) | 220 |
| Ether extract | 40 |
| Mixture of salts | 90 |
| Fibrous matter | 70 |
| Calcium | 10 |
| Phosphorus | 8 |
| Kcal | 2930 |
| Enrichment per kg of the product(3) | |
|
Vitamins: Vitamin A 13.000 UI; Vitamin D3 2.000 UI; Vitamin E 34 UI; Vitamin K3 3 mg; Vitamin B1 5 mg; Vitamin B2 6 mg; Vitamin B6 7 mg; Vitamin B12 22 µg; Niacin 60 mg; Calcium pantothenate 20 mg; Folic acid 1 mg; Biotin 0.05 mg; Choline 1900 mg. Minerals: Zinc 60 mg; Copper 10 mg; Iodine 2 mg; Selenium 0.05 mg; Cobalt 1.5 mg; Fluorine 80 mg. Amino acids: Lysine 12 g; Methionine 4,000 mg. Additives: BHT 100 mg. |
|
| Processed foods and portion (in grams) as regards their nutritional composition | Kcal per portion | Carbohydrates (g) | Protein (g) | Total lipids (g) |
| 1. Bacon Krik (São João Sabor e Nutrição®) (30 g portion) | 120 | 19.8 | 1.8 | 3.6 |
| 2. White chocolate bonbon (Nestle® Brazil) (20g portion) | 93 | 14 | 0.7 | 3.6 |
| 3. Honey bread (Quero Quero) (30 g portion) | 123 | 28 | 1.6 | 0.4 |
| 4. Salame (Friato®) (50 g portion) | 112 | 2.5 | 6 | 8 |
| 5. Lemon wafer cookies (Parmalat®) (30 g portion) | 165 | 19 | 1.1 | 9.5 |
| 6. Corn flakes (Skiny®) (25 g portion) | 127 | 20 | 1.8 | 4.2 |
| 7. Coated peanuts (Dori®) (25 g portion) | 109 | 20.8 | 1.8 | 2.4 |
| 8. Vanilla mini-cake (Bauducco®) (40 g portion) | 164 | 20 | 2.2 | 8.4 |
| 9. Homemade dulce de leche (Parati®) (30 g portion) | 70 | 17 | 1 | 12 |
| 10. Mini bread rolls (Pullman®) ( 50 g portion) | 154 | 28 | 3.9 | 2.8 |
| 11. Sandwich biscuits of sweet brigadier (Mabel®) (30 g portion) | 147 | 21 | 1.7 | 6.9 |
| 12. Toasted popcorn (São João®) (40 g portion) | 64.4 | 12.4 | 2.1 | 7.5 |
| 13. Cookies (Bauducco®) (30 g portion) | 151 | 19 | 2.1 | 7.5 |
| 14. Maisena biscuit (Parmalat®) (30 g portion) | 132 | 22 | 2.4 | 3.7 |
| 15. Tapioca flour biscuit (Peta Caseira) (25 g portion) | 117 | 23.17 | 0.9 | 0.93 |
| 16. Pizza flavored biscuit (Miliopã®) (30 g portion) | 128 | 22 | 2 | 3.5 |
| 17. Caramel-filled bonbon (Nestlé®) (20 g portion) | 92 | 15 | 0.6 | 3.3 |
| 18. Strawberry sandwich biscuit (Amanda®) (30 g portion) | 125 | 16 | 1 | 4 |
| 19. Cheese flavored chips (Miliopã®) (30 g portion) | 130 | 22 | 2.2 | 3.8 |
| 20. Provolone cheese (Vale Orizona®) (30 g portion) | 103 | 0 | 8.7 | 76 |
| 21. Hot dog sausage (Sadia®) (50 g portion) | 121 | 33.7 | 6.8 | 9.5 |
| 22. Paio sausage (Sadia®) (50 g portion) | 187 | 0 | 8.5 | 17 |
| 23. Bacon flavored chip (Miliopã®) (25 g portion) | 105 | 18 | 1.8 | 2.5 |
| 24. Mini chocolate cake (Bauducco®) (40 g portion) | 164 | 20 | 2.2 | 8.4 |
| 25. Prestígio bonbon (Nestlé®) (18.4 g portion) | 85 | 11 | 0 | 3.8 |
| 26. Mortadella (Friato®) (50 g portion) | 112 | 2.5 | 6 | 8 |
| 27. Smoked Calabrian sausage (Sadia®) (50 g portion) | 182 | 0.8 | 8.7 | 16 |
| 28. Lemon wafer cookies (Amanda®) (30 g portion) | 125 | 16 | 1 | 4 |
| 29. Sugar peanut (Dori®) (15 g portion) | 73 | 8.9 | 1.8 | 3.4 |
| 30. Cream biscuits (Maranata®) (30 g portion) | 190 | 20 | 2 | 5 |
| 31. Chocolate donut (Mabel®) (30 g portion) | 125 | 22 | 1.8 | 3.5 |
| 32. Carrot cake (Ana Maria®) (40 g portion) | 159 | 23 | 2 | 5.6 |
| 33. Ready crackling (Sabor D’Abadia®) (10 g portion) | 68 | 0 | 2.6 | 6.2 |
| 34. Sweet brigadier (Bauducco®) (30 g portion) | 133 | 18 | 1.7 | 6 |
| 35. Baconzitos-bacon chips (Elma Chips®) (25 g portion) | 126 | 15 | 1.9 | 6.7 |
| 36. Cashew (Dunorte®) (15 g portion) | 88 | 3.4 | 3 | 6.9 |
| 37. Chicken sausage (Perdigão®) (50 g portion) | 106 | 2 | 6 | 8.2 |
| 38. Mortadella (Sadilar®) (40 g portion) | 121 | 3.4 | 4 | 10 |
| 39. Gomets (Dori®) (20 g portion) | 72 | 18 | 0 | 0 |
| 40. Mini strawberry cake (Bauducco®) (40 g portion) | 146 | 20 | 2.2 | 6.4 |
| 41. Baked cheese chips (Cheetos®) (20 g portion) | 100 | 11 | 0.9 | 4.4 |
| 42. Wavy potato chip (Crony®) (25 g portion) | 153 | 1.4 | 1.7 | 10 |
| 43. Ham (Sadia®) (30 g portion) | 36 | 0.8 | 3.9 | 1.9 |
| 44. Sweet corn flakes (Ki gostoso®) (25 g portion) | 69 | 16 | 1.3 | 0 |
| 45. Peanuts (Paulista®) (15 g portion) | 90 | 13.7 | 1.3 | 0 |
| 46. Bis-chocolate wafer (Lacta®) (30 g portion) | 149 | 19 | 1.8 | 7.1 |
| 47. Passatempo-strawberry filled sandwich biscuit (Nestlé®) (30 g portion) | 135 | 21 | 1.9 | 4.8 |
| 48. Fandangos (Elma Chips®) (22 g portion) | 100 | 16 | 1.5 | 3.5 |
| 49. Teens Bauny-rolls (Marilam®) (30 g portion) | 134 | 20 | 2.4 | 4.8 |
RESULTS AND DISCUSSION
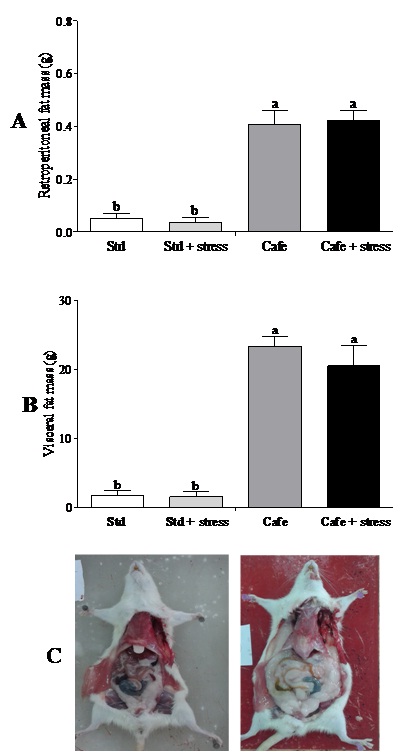
At the end of the experiment, only the factor “nutrition” (Factor 1) presented effect on the relative retroperitoneal fat (F(1,40)=71.202; p<0.001) (Figure 3A) and visceral mass (F(1,40)=32.887; p<0.001) (Figure 3B). Figure 3C shows representative images of the visceral fat visual aspect observed in the animals of the Std and Cafe groups (with or without stress). Therefore, these data indicate that the cafeteria diet effectively induced obesity in the animals.
Cafeteria diet was able to induce obesity in rodents, an important predictor for metabolic diseases, according to other studies [21,22]. The gain in body mass in those animals that consumed the cafeteria diet is related to high calorie content of the cafeteria diet [21]. However, the hypothesis that chronic stress could lead to obesity was not confirmed in our study. Bartolomucci et al., [10] have also shown that chronic stress can raise glucocorticoid levels, leading to pleasant and compulsive behaviors, as the intake of sweet and fat-rich food and to an increase in abdominal fat deposits and consequently obesity.
An attenuation of responses to stress has been observed in animals subjected to hypercaloric and high-carbohydrate diets. There are evidences that chronic stress can promote energy storage in the abdominal adipose tissue [39], but this was not observed in our study. Recently, in a similar study also performed in rats [22], we did not observe differences between the total daily food intakes (in grams) (up to eight experimental weeks), or effects of the factors obesity, stress or interaction after start of the stress protocol [22]. Possibly, the stress condition did not influence the parameters related to consumption, in relation to the nutritional detailing of diets. These results are directly related to the nutritional composition of the food offered to the animals.
Macedo [40] analyzing weight and biochemical parameters in male wistar rats fed with cafeteria diet and subjected to chronic stress did not observe the interference of the stress in body mass gain, in delta weight, in Lee index and in the adipose tissue weight.
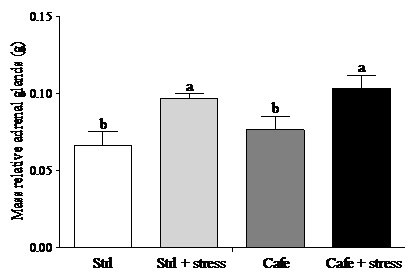
Regarding the adrenal glands, according to Macedo [40], under chronic stress conditions there is continuous stimulation of the adrenal by adrenocorticotropic hormone leading to hypertrophy of these glands. Here, we used the weight of adrenal as indirect stress parameter showing that the animals were stressed. The effect of factor 2 “condition” (stress exposure) was observed on relative adrenal gland mass (F(1,44) = 6.681, p = 0.032), with increased adrenal weights in stressed animals compared with non-stressed rats. (Figure 4). This result corroborates with previous studies, showing that exposure to daily restraint stress can cause adrenal gland hypertrophy [41-43].
In relation to the erythrogram, there was no interaction between the factors “nutrition” and “condition” independently of the parameters analyzed (Table 3). Besides, the animals did not present values indicative of an anemic condition, defined by hematocrits, hemoglobin concentration and globular volume. The mean corpuscular volume and the mean cell hemoglobin concentration are parameters used to morphologically assess anemia types [44]. Since animals from this study did not present anemia, no significant changes were observed in these variables.
| Factor 1 (“nutrition”) | Factor 2 (“condition”) | Interaction (F1 x F2) | |
| Erythrogram | |||
| E (tera/L) | F(1,44) = 4.176, p = 0.054 | F(1,44) = 0.264, p = 0.612 | F(1,44) = 0.773, p = 0.389 |
| Hem (%) | F(1,44) = 2.951, p = 0.101 | F(1,44) = 0.270, p = 0.608 | F(1,44) = 0.258, p = 0.616 |
| Hb (g/dL) | F(1,44) = 1.192, p = 0.287 | F(1,44) = 0.838, p = 0.370 | F(1,44) = 0.358, p = 0.555 |
| MCV (fL) | F(1,44) = 0.721, p = 0.405 | F(1,44) = 0.090, p = 0.767 | F(1,44) = 1.701, p = 0.206 |
| MCHC (g/dL) | F(1,44) = 1.975, p = 0.175 | F(1,44) = 0.160, p = 0.693 | F(1,44) = 0.005, p = 0.943 |
| Lipidogram | |||
| Cholesterol (mg/dL) | F(1,44) = 1.546, p = 0.227 | F(1,44) = 0.608, p = 0.444 | F(1,44) = 0.999, p = 0.329 |
| Triglycerides (mg/dL) | F(1,44) = 1.116, p = 0.303 | F(1,44) = 0.701, p = 0.411 | F(1,44) = 0.217, p = 0.645 |
| HDL (mg/dL) | F(1,44) = 0.019, p = 0.890 | F(1,44) = 0.008, p = 0.977 | F(1,44) = 2.034, p = 0.169 |
| LDL (mg/dL) | F(1,44) = 2.971, p = 0.100 | F(1,44) = 1.516, p = 0.232 | F(1,44) = 0.379, p = 0.544 |
| VLDL (mg/dL) | F(1,44) = 1.116, p = 0.303 | F(1,44) = 0.701, p = 0.411 | F(1,44) = 0.217, p = 0.645 |
Regarding the lipidogram, no interactions between the factors “nutrition” (Factor 1) and “condition” (Factor 2) were observed for the analyzed parameters, or even individual effects of these factors (Table 3). These results were expected, once the diets offered to the animals were not hyperlipidemic. Hoefel et al., [45], studying Wistar rats, suggested a positive correlation between the consumption of hyperlipidemic diets with metabolic changes. These authors showed that the hyperlipidemic diet with saturated fat, when consumed ad libitum, causes negative effects on both the plasma and the hepatic lipid profiles.
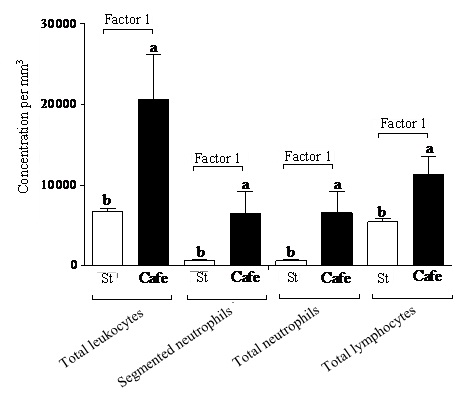
Regarding the leukogram, no interactions (p>0.05) between the factors “nutrition” and “condition” were observed for the evaluated parameters. Only the effect of the factor “nutrition” (Factor 1) was observed (Table 4), once the obese animals (subjected or not to stress) presented higher concentrations of total leukocytes (Cafe: 20550.00/mm3; Std: 6675.00/mm3), segmented neutrophils (Cafe: 6507.58/mm3; Std: 615.75/mm3), total neutrophils (Cafe: 6538.16/mm3; Std: 631.50/mm3) and lymphocytes (Cafe: 11363.50/mm3; Std: 5447.41/mm3) (Figure 5).
| Factor 1 (“nutrition”) | Factor 2 (“condition”) | Interaction (F1 x F2) | |
| Total leukocytes (/mm3) | F(1,44) = 5.554, p = 0.028* | F(1,44) = 1.191, p = 0.666 | F(1,44) = 0.539, p = 0.470 |
| Segmented neutrophils (/mm3) | F(1,44) = 4.539, p = 0.045* | F(1,44) = 0.181, p = 0.674 | F(1,44) = 0.248, p = 0.623 |
| Total neutrophils (/mm3) | F(1,44) = 4.579, p = 0.049* | F(1,44) = 0.172, p = 0.682 | F(1,44) = 0.249, p = 0.622 |
| Total lymphocytes (/mm3) | F(1,44) = 6.652, p = 0.017* | F(1,44) = 0.168, p = 0.685 | F(1,44) = 1.052, p = 0.317 |
Our data suggest to neutrophilia and lymphocytosis in the obese animals evidenced changes in the immunological processes. The increased lymphocyte and neutrophil concentrations are evidences of changes in the immunological system of the obese animals, which can be related to the molecule secretion by adipocytes. According to Fain et al., [46] and Wajchenberg [47], adipocytes secrete leptin in concentrations directly proportional to the adipose tissue mass and to nutritional condition of the organism. Considine et al., [48] point to the fact that the adipose mass is one of the factors strongly associated with Lp concentrations in blood. Thus, the high Lp production by adipocytes drives a higher pro-inflammatory cytokines secretion by monocytes and, consequently, an increase of T lymphocytes. Evidences in vitro and in animals suggest that leptin plays an important role in the regulation of the humoral inflammatory response by means of the direct effects in T lymphocytes, monocytes, neutrophils and endothelial cells [49]. Thus, the increase in body mass might leads an increase of the soluble leptin and, consequently, to the increase in the plasmatic levels of inflammatory markers associated with obesity [50], which would characterize a pro-inflammatory state capable to induce leukocytosis, as observed in the animals fed with cafeteria diet.
Another hypothesis that could explain leukocytosis is related to the epinephrine secreted by the adrenal medulla in chronic stress situations, as demonstrated by Mersmann [51]. According to Thrall et al., [52], the effect of epinephrine on the leukogram can be expressed as the increase in the total leukocyte count, particularly in neutrophils and/or lymphocytes, as observed in our study.
The statistical analysis also revealed the absence of interactions between the factors “nutrition” and “condition” occurred with total proteins, albumin and globulin (Table 5). Only the effect of the factor “nutrition” was observed in glucose levels, whereas the obese animals (subjected or not to chronic stress) presented a glucose concentration of 146.91 g/dL in comparison to 119.83 g/dL from standard diet animals fed.
|
Factor 1(“nutrition”) |
Factor 2 (“condition”) | Interaction F1 x F2 | |
| Total proteins (g/dL) | F(1,44) = 0.221, p = 0.642 | F(1,44) = 0.252, p = 0,620 | F(1,44) = 0.084, p = 0,740 |
| Albumin (g/dL) | F(1,44) = 1.650, p = 0.213 | F(1,44) = 0.015, p = 0,901 | F(1,44) = 0.184, p = 0,671 |
| Globulin (g/dL) | F(1,44) = 2.391, p = 0.137 | F(1,44) = 0.248, p = 0,623 | F(1,44) = 0.187, p = 0,669 |
| Glycemia (g/dL) | F(1,44) = 7.265, p = 0.013* | F(1,44) = 0.327, p = 0,573 | F(1,44) = 0.019, p = 0,883 |
Rosmond [53] states that obesity is commonly associated with a range of metabolic diseases, which can influence the secretion of different substances by the adipocytes. These substances act in complex ways that are still being studied. According to Campos et al., [54], these substances can cause morpho-functional changes in the adipocytes, which secrete higher TNF-α and interleukin 6 concentrations in obese organisms, which are antagonist to insulin. In this case, this antagonist action could explain the hyperglycemia observed in the obese animals of our study, although we did not investigate the parameters linked to insulin.
CONCLUSION
REFERENCES
- [No authors listed] (2006) Curbing the obesity epidemic. Lancet 367: 1549.
- Flegal KM, Kit BK, Orpana H, Graubard BI (2013) Association of all-cause mortality with overweight and obesity using standard body mass index categories: a systematic review and meta-analysis. JAMA 309: 71-82.
- Dulloo AG, Jacquet J, Solinas G, Montani JP, Schutz Y (2010) Body composition phenotypes in pathways to obesity and the metabolic syndrome. Int J Obes (Lond) 34: 4-17.
- World Health Organization (WHO) (2014) Obesity and overweight. World Health Organization, Geneva, Switzerland.
- Haslam DW, James WP (2005) Obesity. Lancet 366: 1197-1209.
- Taylor SE, Stanton AL (2007) Coping resources, coping processes, and mental health. Annu Rev Clin Psychol 3: 377-401.
- Vilela JE, Lamounier JA, Dellaretti Filho MA, Barros Neto JR, Horta GM (2004) [Eating disorders in school children]. J Pediatr (Rio J) 80: 49-54.
- Silva JR (2011) Restraint eating and sensitivity to stress: preliminary experimental evidence. Riv Psichiatr 46: 300-304.
- Tamashiro KL, Sakai RR, Shively CA, Karatsoreos IN, Reagan LP (2011) Chronic stress, metabolism, and metabolic syndrome. Stress 14: 468-474.
- Bartolomucci A, Cabassi A, Govoni P, Ceresini G, Cero C, et al. (2009) Metabolic consequences and vulnerability to diet-induced obesity in male mice under chronic social stress. PLoS One 4: e4331.
- Gluck ME, Geliebter A, Satov T (2001) Night eating syndrome is associated with depression, low self-esteem, reduced daytime hunger, and less weight loss in obese outpatients. Obes Res 9: 264-267.
- Björntorp P (2001) Do stress reactions cause abdominal obesity and comorbidities? Obes Rev 2: 73-86.
- Dallman MF, Pecoraro NC, la Fleur SE (2005) Chronic stress and comfort foods: self-medication and abdominal obesity. Brain Behav Immun 19: 275-280.
- Dallman MF, Pecoraro NC, La Fleur SE, Warne JP, Ginsberg AB, et al. (2006) Glucocorticoids, chronic stress, and obesity. Prog Brain Res 153: 75-105.
- Warne JP, Dallman MF (2007) Stress, diet and abdominal obesity: Y? Nat Med 13: 781-783.
- Dallman MF (2010) Stress-induced obesity and the emotional nervous system. Trends Endocrinol Metab 21: 159-165.
- Tomiyama AJ, Dallman MF, Epel ES (2011) Comfort food is comforting to those most stressed: evidence of the chronic stress response network in high stress women. Psychoneuroendocrinology 36: 1513-1519.
- Macedo IC, Medeiros LF, Oliveira C, Oliveira CM, Rozisky JR, et al. (2012) Cafeteria diet-induced obesity plus chronic stress alter serum leptin levels. Peptides 38: 189-196.
- de Oliveira C, Scarabelot VL, de Souza A, de Oliveira CM, Medeiros LF, et al. (2014) Obesity and chronic stress are able to desynchronize the temporal pattern of serum levels of leptin and triglycerides. Peptides 51: 46-53.
- Macedo IC, Rozisky JR, Battastini AMO, Ribeiro MFM, Torres ILS (2014). Obesity and Chronic Stress Modulate Adenine Nucleotide Hydrolysis in Rat Blood Serum. International Journal of Pharmaceutics Research Scholars 3: 28-40.
- Macedo IC, Rozisky JR, Oliveira C, Oliveira CM, Laste G, et al. (2015) Chronic stress associated with hypercaloric diet changes the hippocampal BDNF levels in male Wistar rats. Neuropeptides 51: 75-81.
- da Costa Estrela D, da Silva WA, Guimarães AT, de Oliveira Mendes B, da Silva Castro AL, et al. (2015) Predictive behaviors for anxiety and depression in female Wistar rats subjected to cafeteria diet and stress. Physiol Behav 151: 252-263.
- Asarian L, Geary N (2013) Sex differences in the physiology of eating. Am J Physiol Regul Integr Comp Physiol 305: R1215-1267.
- Franceschelli A, Herchick S, Thelen C, Papadopoulou-Daifoti Z, Pitychoutis PM (2014) Sex differences in the chronic mild stress model of depression. Behav Pharmacol 25: 372-383.
- Balog M, Miljanovi? M, Blažeti? S, Labak I, Ivi? V, et al. (2015). Sex-specific chronic stress response at the level of adrenal gland modified sexual hormone and leptin receptors. Croat Med J 56: 104-112.
- Lu J, Wu XY, Zhu QB, Li J, Shi LG, et al. (2015) Sex differences in the stress response in SD rats. Behav Brain Res 284: 231-237.
- Keller SM, Schreiber WB, Staib JM, Knox D (2015) Sex differences in the single prolonged stress model. Behav Brain Res 286: 29-32.
- Pratchayasakul W, Sa-Nguanmoo P, Sivasinprasasn S, Pintana H, Tawinvisan R, et al. (2015) Obesity accelerates cognitive decline by aggravating mitochondrial dysfunction, insulin resistance and synaptic dysfunction under estrogen-deprived conditions. Horm Behav 72: 68-77.
- Gurecká R, Koborová I, Janšáková K, Tábi T, Szök? É, et al. (2015). Prenatal dietary load of Maillard reaction products combined with postnatal Coca-Cola drinking affects metabolic status of female Wistar rats. Croat Med J 56: 94-103.
- Sivasinprasasn S, Sa-Nguanmoo P, Pratchayasakul W, Kumfu S, Chattipakorn SC, et al. (2015) Obese-insulin resistance accelerates and aggravates cardiometabolic disorders and cardiac mitochondrial dysfunction in estrogen-deprived female rats. Age (Dordr) 37: 28.
- Sivanathan S, Thavartnam K, Arif S, Elegino T, McGowan PO (2015) Chronic high fat feeding increases anxiety-like behaviour and reduces transcript abundance of glucocorticoid signalling genes in the hippocampus of female rats. Behav Brain Res 286: 267-270.
- Colman JB, Laureano DP, Reis TM, Krolow R, Dalmaz C, et al. (2015) Variations in the neonatal environment modulate adult behavioral and brain responses to palatable food withdrawal in adult female rats. Int J Dev Neurosci 40: 70-75.
- Andrade A, Pinto SC, Oliveira RS (2002) Animais de laboratório-criação e experimentação. FIOCRUZ, Rio de Janeiro, Brazil.
- Malafaia AB, Nassif PA, Ribas CA, Ariede BL, Sue KN, et al. (2013) Obesity induction with high fat sucrose in rats. Arq Bras Cir Dig 26: 17-21.
- Nutrição Animal Em Barretos (2010) Nuvital: Segurança em Nutrição Animal. Animal Nutrition In Barretos, Brazil.
- Reeves PG, Nielsen FH, Fahey-Junior GC (1993) AIN-93 purified diets for laboratory rodents: final report of the American Institute of Nutrition ad hoc writing committee on the reformulation of the AIN-76A rodent diet. J Nutr 123: 1939-1951.
- Ely DR, Dapper V, Marasca J, Corrêa JB, Gamaro GD, et al. (1997) Effect of restraint stress on feeding behavior of rats. Physiol Behav 61: 395-398.
- Levin BE, Triscari J, Sullivan AC (1986) Metabolic features of diet-induced obesity without hyperphagia in young rats. Am J Physiol 251: 433-440.
- Dallman MF, la Fleur SE, Pecoraro NC, Gomez F, Houshyar H, et al. (2004) Minireview: glucocorticoids--food intake, abdominal obesity, and wealthy nations in 2004. Endocrinology 145: 2633-2638.
- Macedo IC (2010) Estresse crônico associado à dieta hipercalórica em ratos Wistar: parâmetros ponderais e bioquímicos. Dissertação (Mestrado em Fisiologia), Universidade Federal do Rio Grande do Sul,
- Wellman CL (2001) Dendritic reorganization in pyramidal neurons in medial prefrontal cortex after chronic corticosterone administration. J Neurobiol 49: 245-253.
- Magariños AM, McEwen BS (1995) Stress-induced atrophy of apical dendrites of hippocampal CA3c neurons: involvement of glucocorticoid secretion and excitatory amino acid receptors. Neuroscience 69: 89-98.
- Bloss EB, Janssen WG, McEwen BS, Morrison JH (2010) Interactive effects of stress and aging on structural plasticity in the prefrontal cortex. J Neurosci 30: 6726-6731.
- Lopes STA, Biondo AW, Santos AP (2007) Manual de Patologia Clínica Veterinária. (3rd edn), UFSM, Santa Maria, Brazil.
- Hoefel AL, Hansen F, Rosa PD, Assis AM, Silveira SL, et al. (2011) The effects of hypercaloric diets on glucose homeostasis in the rat: influence of saturated and monounsaturated dietary lipids. Cell Biochem Funct 29: 569-576.
- Fain JN, Madan AK, Hiler ML, Cheema P, Bahouth SW (2004) Comparison of the release of adipokines by adipose tissue, adipose tissue matrix, and adipocytes from visceral and subcutaneous abdominal adipose tissues of obese humans. Endocrinology 145: 2273-2282.
- Wajchenberg BL (2000) Subcutaneous and visceral adipose tissue: their relation to the metabolic syndrome. Endocr Rev 21: 697-738.
- Considine RV, Sinha MK, Heiman ML, Kriauciunas A, Stephens TW, et al. (1996) Serum immunoreactive-leptin concentrations in normal-weight and obese humans. N Engl J Med 334: 292-295.
- Hukshorn CJ, Lindeman JH, Toet KH, Saris WH, Eilers PH, et al. (2004) Leptin and the proinflammatory state associated with human obesity. J Clin Endocrinol Metab 89: 1773-1778.
- Ziccardi P, Nappo F, Giugliano G, Esposito K, Marfella R, et al. (2002) Reduction of inflammatory cytokine concentrations and improvement of endothelial functions in obese women after weight loss over one year. Circulation 105: 804-809.
- Mersmann HJ (1989) Acute changes in blood flow in pigs infused with beta-adrenergic agonists. J Anim Sci 67: 2913-2920.
- Thrall MA, Weiser G, Allisson RW, Campbell TW (2012) Veterinary hematology and clinical chemistry. (2nd edn), Wiley-Blackwell, New Jersey, USA.
- Rosmond R (2004) Aetiology of obesity: a striving after wind? Obes Rev 5: 177-181.
- Campos KE, Sinzato YK, Damasceno DC, Rudge MVC (2006). Obesity and insulin resistance. Femina 34:592-595.
Citation: Guimarães ATB, Silva WAMD, Mendes BDO, Estrela DDC, Santos ADS, et al. (2016) Cafeteria Diet Associated with the Chronic Stress Does Not Alter Biochemical and Hematological Parameters in Wistar Rats. J Obes Weight Loss 2: 006.
Copyright: © 2016 Guilherme Malafaia, et al. This is an open-access article distributed under the terms of the Creative Commons Attribution License, which permits unrestricted use, distribution, and reproduction in any medium, provided the original author and source are credited.