Comparison of Phytochemical Compositions of Sorghum Bicolor (L) Moench Red Flour and Pale Brown Leaves
*Corresponding Author(s):
Abugri DADepartment Of Chemistry, College Of Arts And Sciences, Tuskegee University, Tuskegee, Alabama, United States
Tel:+1 3347244264,
Email:dabugri@mytu.tuskegee.edu
Abstract
There are increasing demands in plant derived natural food and their bioactive compounds with pharmaceutical, nutritional and health functional properties. No evidence exists regarding the bioactive and nutritive compounds of the red S. bicolor pale brown leaves which are consumed directly or indirectly as spice and herbs by humans and animals in some West Africa countries. We compared chlorophyll, carotenoids, phenolic acids, flavonoids, tannins, and fatty acid profile(s) of the flour and the pale brown leaves and their nutritional implication. The leaves were found to contain higher concentrations of total tannins (194.50-995.72mg/g), total phenolic (16.63-102.82mg/g), and flavonoids (0.20-0.36mg/g) and important essential fatty acids such as α-LA, EPA and DHA than the flour at P ?0.05. These findings are the first of its kind in the leaves and suggest that red sorghum flour and its pale leaves may be a valuable health and nutrition promoting functional food that could fight against infectious and cardiovascular related illness in humans and animals.
Keywords
INTRODUCTION
Sorghum Bicolor (L.) Moench is considered as the fifth most important cereal grain cultivated worldwide. The cereal is considered as an important staple food and medicinal crop consumed by over 750 million people in Sub-Saharan Africa, Latin America and India [1,2]. The grains have numerous benefits ranging from nutritional, chemical, pharmaceutical and food colorant [1,3-6].
In the USA, the cereal is used primarily for feeding animals and possibly ethanol production [7]. Although these uses of the grains are widely known, the leaf especially the pale brown type also have many potential uses which have not been exploited in the past partly because of lack of characterization of the leaf constituents and availability of ethnomedical information across countries. Furthermore, in Northern Ghana, the traditional folks use the leaves as herbal medicine for management of diseases such as anemia and iron deficiency [6].
Scientific information on phytochemical compounds composition of the Red S. bicolor pale brown leaves consumed in some African countries by humans and animals is scarce. Based on the numerous folk medicine benefits that the red Sorghum Bicolor pale leaves provide to consumers in some West African countries (e.g., Ghana), a thorough characterization of the different stages of the color of the S. bicolorleaves used in different food preparations, herbs and feed formulations is warranted. In this present study, the levels of the phenolic acids, flavonoids, condensed tannins, chlorophylls, carotenoids, and fatty acid composition in the red Sorghum Bicolor pale leaves were compared to the flour made from the sorghum grains that is used by people in Africa (especially in Ghana, Nigeria, Togo and Burkina Faso).
MATERIALS AND METHODS
Samples collection and preparation of extracts
All chemicals were of HPLC and ACS grade. Epigallocatechin, naringenin and apigenin were obtained from Santa Cruz biotechnology Inc. Santa Cruz, California, USA. Gallic acid, vallic acid, salicylic acids, Folin-Ciocalteu reagents were obtained from Sigma Aldrich USA.
A total of 30.0mL was used for extraction of compounds with a solvent mixture (Acetone: Hexane (HPLC grade)) in a ratio of 4:6. Methanol (LC-MS, HPLC, Spectrophotometry grade) and ethanol (99.9% AC reagent (2000 proof) all purchased from Fisher scientific, USA, were added to each test tube with 0.300g sample of flour or powdered leaves. The tubes were capped tightly with Teflon caps and incubated at 30?C for 20mins according to the procedure of Abugri et al., [6]. Samples were vortexed for 3mins and then centrifuged for 5mins using a clinical table top centrifuge (IEC Centra, CL2, International Equipment Company, Needham Heights, MA, USA) at 2000 rpm then filtered using Whatman No. 1 filter paper into new test tubes for various phenolics assays.
Total phenolic content determination
Total condensed tannins content determination
Total flavonoid content determination
Total chlorophyll, carotenoids and chlorophyll content determination
Fatty Acid Methyl Esters (FAMEs) preparation and Gas Liquid Chromatography (GLC) analysis
HPLC analysis of phenolic compounds
Statistical analysis
RESULTS AND DISCUSSION
Table 1, shows the individual fatty acids found in both leaves and flour. The fatty acids observed ranged from C6:0 to C24:0 which partially agreed with some previous studies in millet and sorghum varieties food, seed oils [12-14]. Among the individual fatty acids of the flour sample analyzed, linoleic acid (C18:2n6) alone constituted about 39.33% of the total fatty acids’ and was observed to be the dominant fatty acid in the flour of the seed. This finding of predominance agreed with previous studies reported by [12] in sorghum seeds. Other fatty acids of interest both nutritionally and biochemically with appreciable amounts were C18:0 (2.63%), C18:1 (22.07%), and C16:0 (21:13%). These observations concurred with previous works in total lipid fractions using different solvents to characterized glycolipids, phospholipids and neutral lipids in two varieties of sorghum seeds (SSH3 and L187) [12]. In the case of the leaves, C16:0 (21.49%) was the chief saturated fatty acid with the highest percent among all the total identified fatty acids.
| % FA | SBL | SBF |
| 6:0 | 1.23 ± 0.78 | 1.24 ± 0.03 |
| 7:0 | - | 0.08 ± 0.01 |
| 8:0 | 0.32 ± 0.09 | - |
| 10:0 | 1.88 ± 0.30 | - |
| 11:0 | 0.33 ± 0.02 | - |
| 11:1 | 0.68 ± 0.29 | - |
| 12:0 | 1.13 ± 0.33 | - |
| 12:1 | 0.62 ± 0.15 | 0.35 ± 0.04 |
| 13:0 | 1.83 ± 0.34 | - |
| 14:0 | 0.46 ± 0.10 | - |
| 14:1 | 0.62 ± 0.10 | - |
| 15:0 | 0.38 ± 0.00 | 0.17 ± 0.04 |
| 15:1 | 1.74 ± 0.23 | - |
| 16:0 | 21.49 ± 3.51 | 21.13 ± 1.27 |
| 16:1 | 3.31 ± 0.52 | 0.16 ± 0.06 |
| 17:0 | 2.21 ± 0.43 | 0.19 ± 0.05 |
| 18:0 | 6.50 ± 0.95 | 2.63 ± 0.19 |
| 18:1 | 4.39 ± 0.55 | 22.07 ± 0.27 |
| 18:1n9 t | 0.52 ± 0.19 | 1.38 ± 0.19 |
| 18:1n11 | 0.44 ± 0.09 | 0.95 ± 0.06 |
| 18:1n7 | 0.40 ± 0.11 | 1.85 ± 0.21 |
| 18:1n7t | 0.76 ± 0.58 | 0.93 ± 0.02 |
| 18:2n6 | 5.14 ± 0.60 | 39.33 ± 0.99 |
| 18:3n6 | 0.46 ± 0.07 | - |
| 18:3n3 | 4.56 ± 0.62 | 1.34 ± 0.12 |
| 20:1n11 | 1.63 ± 0.09 | - |
| 20:0 | - | 1.08 ± 0.28 |
| 20:1n9 | 1.56 ± 0.34 | - |
| 20:1n15 | 1.83 ± 0.20 | - |
| 20:2n6 | 1.92 ± 0.14 | - |
| 20:3n6 | 0.77 ± 0.10 | - |
| 20:4n6 | 6.75 ± 1.21 | - |
| 20:3n3 | 0.69 ± 0.22 | - |
| 20:5n3 | 6.56 ± 1.95 | - |
| C21:0 | 2.59 ± 0.90 | - |
| 22:2n6 | 1.39 ± 0.11 | `0.35 ± 0.12 |
| 22:5n3 | - | 1.37 ± 0.44 |
| 24:0 | 0.70 ± 0.03 | 2.73 ± 1.81 |
| 22:6n3 | 6.07 ± 0.28 | 0.55 ± 0.54 |
Another, most interesting trend found was that the leaf contain higher (p?0.05) percent of omega 3s Polyunsaturated Fatty Acids (PUFAs) compared to omega 6 Polyunsaturated Fatty Acids (PUFAs). In the flour the trend was the reverse, which means that the leaves and the flour will be greater source of omega 3 and 6 fatty acids, respectively. A concise summary of the fatty acids biomarkers in both the pale leaves and the red flour is presented in figure 1. The omega 6 and omega 3 PUFAs content in the leaves will contribute greatly to alleviating cardiovascular related diseases based on its ratio of 2:1 which is the recommended ratio [15]. However, the flour had higher ratio of omega 6/omega 3 which was about 10:1, which is above the recommended ratio in diets but less than the typical western diets ratio of 20:1 or 30:1 [15]. The ratio in the flour could have been modified by postharvest issues, environmental factors, maturity stages, genetics, physiological and morphological differences [6,16]. Generally, there was significant differences between all lipid biomarkers measured (Figure 1). Higher amounts of Unsaturated Fatty Acids (UFAs) than Saturated Fatty Acid (SFAs) were found in all flour and leaves which indicates that both are good natural sources of unsaturated essential fatty acids for nutritional and medicinal application. We observed higher percent of C20:5n3 (EPA), C22:5n3 (DPA) and C22:6n3 (DHA) content in the leaves which were comparable to that of those found in Catla catla fish [17]. This trend was strange to found in a terrestrial plant like the leaves of Sorghum Bicolor. We believe that it could have been attributed to environmental conditions and as well as extraction methodology drawbacks. However, we believed that the leaves will serve as important natural cheap source of omega 3 PUFAs for human nutrition.
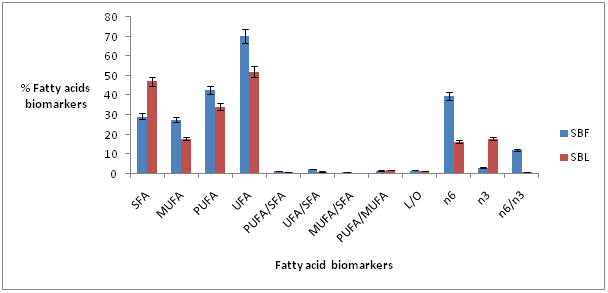 Figure 1: Total identified fatty acids biomarkers in S. bicolor red Flour (SBF) and pale brown Leaves (SBL).
Table 2, shows total chlorophylls, carotenoids, ratio of chlorophyll a/b and total chlorophyll to carotenoids ratio obtained in both S. bicolor pale leaves and flour. Generally, the leaves were observed to contain chlorophyll a and b and carotenoids, the most abundant pigment detected in this current study in the pale leaf was carotenoids. These pigments could be used as food colorants and as drug coating agents.
| Sample type | Chlorophyll a | Chlorophyll b | Total Chlorophyll a | Total Carotenoids | Chl a/Chl b | T Chlorophyll/T Carotenoids |
| Pale brown leaves | 2.43 ± 0.00 | 1.88 ± 0.01 | 4.31 ± 0.01 | 7.45 ± 0.04 | 1.29 | 0.58 |
| Sorghum Bicolor flour | 2.81 ± 0.02 | 2.11 ± 0.18 | 4.92 ± 0.20 | 8.88 ± 0.05 | 1.33 | 0.55 |
Figures 2 and 3, depict total phenolic content, total condensed tannins content, and total flavonoid content using different solvents of extractions. It was observed that the pale leaves contain a higher (p?0.05) content of condensed tannins than the flour. In releasing the tannins the solvent of higher performance was methanol followed by ethanol. This observation has been reported previously by [3] in mushrooms that solvents have an impact on the amount of bioactive compounds released into solutions for spectroscopy and chromatographic analysis. A possible explanation for the low amounts of tannins found with the acetone-hexane mixture, is that the acetone-hexane mixture used in the extractions could have created significant isomerization and tatomerization of primary tannins (proanthocyanidins) resulting in significant structural changes and rendering them less reactive and might not provide high absorbance with the wavelength used in the colorimetric technique as compared to the methanol and ethanol extracts. This explanation is supported by [5] and [18] who reported that acetone forms pyrano-anthocyanins from anthocyanins via oxidative addition mediated reactions and results in a shift of peaks absorbance wavelengths and makes it difficult to identify and quantify the total tannins amount in such solvents.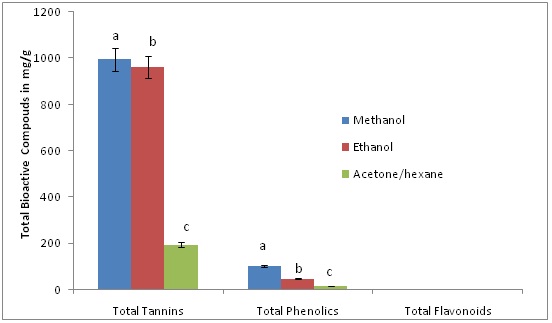 Figure 2: Effects of extraction solvent on total condensed tannins, phenolic and flavonoids content of Sorghum Bicolor flour. Different letters represented in bar graph indicate means with significant difference at (p?0.05).
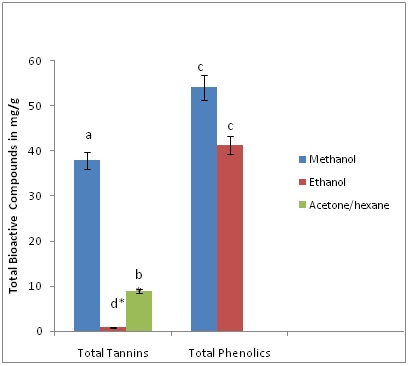
It was interesting to observe that total phenolic content was best extracted using methanol then lastly ethanol. This trend could be attributed to the time of incubation used for the extraction [19], particle size and the strength of the different solvents used [3]. Total flavonoids were low in both flour and the leaves (Figures 2 and 3).
The high condensed total tannins content obtained indicates that both the leaves and seed flour contain greater amounts of anthocyanin, proanthrocyanidins and their derivatives which may have nutritional, pharmaceutical and medical implications. It is believed that most tannins are found in larger quantities in sources such as sorghum seed, wine, leaves and berries [3,5,20].
Table 3, summarizes the content of phenolic compounds present in the flour and the leaves respectively. It was observed that both samples contain hydrobenzoic acids, flavonols, hydroxycinnamic acids, and flavone. The most prominent ones were flavonoids (apigenin, naringenin and epigallocatechin) identified from two different extracts (methanol and ethanol). The flavonoids that were abundant in the pale red sorghum leaves were the apigenin, naringenin and epigallocatechin (Table 3). The absence of the common phenolic acids and flavonoids often reported in sorghum and its products of the solvents tested could be attributed to the complexity of their bounded sites and other biomolecules and the phenolic acids in a cell matrix [7]. This implies that the reaction conditions used might have not been appropriate to completely release these bound phenolics into the different solvents use for detection by HPLC. Another possible factor could be that the free forms of the phenolics were very low and hence below the detection limits of the instrument. It is also anticipated that some of the solvents used might have depleted or cause dimerization of the phenolic compounds and flavonoids resulting in different retention times elution outside that of the internal and external standard used.
| Phenolic compound | Ethanol extract leaves | Methanol extracts leaves | Ethanol extracts flour | Methanol extracts flour |
| Hydroxybenzoic acids | ||||
| Gallic acid | 221.43 ± 21.12b | 1282.99 ± 21.12a | 53.95 ± 21.12b | 203.88 ± 21.12b |
| Flavones Apigenin | 163.17 ± 6.69a | 343.31 ± 6.69a | nd | nd |
| Flavanones Naringen | 3830.50 ± 223.9a | nd | 2650.93 ± 223.9a | nd |
| Flavonols (monomers/dimers) Epigallocatechin | 886.47 ± 79.95a | 1965.74 ± 79.95b | 663.81 ± 79.95a | 911.90 ± 79.95a |
The current results reported, especially that the major phenolic acid found in the sorghum leaves extract was gallic acid, which deviated from the red leaves reported in other studies [6]. The presence of flavonoids (narigenin, epigallocatechin gallate and apigenin) in the leaves will serve as good sources of antioxidants, anti-inflammatory, anti-allergic, anticancer and immune-modulator which can improve the immune system towards maintaining good health in consumers based on epidemiological evidence [7,21].
The findings obtained could be used as biochemical markers for the determination of best sorghum variety and quality of the cereal grains and leaves for human and animal consumption. This conjecture is supported by [22] who indicated that biochemical markers of grains are the key factors to consider for quality grains selection for food processing.
CONCLUSION
In summary the pale brown leaves and the flour of Sorghum Bicolor have important biochemical, nutritional and health benefits when incorporated into humans and animals diets based on the unique bioactive compounds found in them. These findings can be used as a useful tool in selecting and screening sorghums varieties and sorghum plant parts with high phenolic compounds content and lipids for cultivation, and for nutraceuticals purposes. Lastly, further studies should be focus on high throughout put screening of both the leaves and the flour for comprehensive profile of all secondary metabolites present.
REFERENCES
- Rooney LW (1978) Sorghum and Pearl Millet lipids. Cereal Chemistry 55: 584-590.
- Godwin ID, Gray SJ (2000) Overcoming productivity and quality constraints in sorghum: the role for genetic engineering. In: O’ Brien L, Henry RJ, (eds.). Transgenic cereals, American Association of Cereal Chemists, St. Paul, MN, USA. Pg no: 153-177.
- Abugri DA, Apea, OB, Pritchett G (2012) Investigation of a simple and cheap source of a natural indicator for acid-base titration: effects of system conditions on natural indicators. Green and Sustainable Chemistry 2: 117-122.
- Awika JM, Rooney LW (2004) Sorghum phytochemicals and their potential impact on human health. Phytochemistry 65: 1199-1221.
- Awika JM, Rooney LW, Waniska RD (2004) Properties of 3-deoxyanthocyanins from sorghum. J Agric Food Chem 52: 4388-4394.
- Abugri DA, Tiimob BJ, Apalangya VA, Pritchett G, McElhenney WH (2013) Bioactive and nutritive compounds in Sorghum Bicolor (Guinea corn) red leaves and their health implication. Food Chem 138: 718-723.
- Dykes L, Rooney LW, Waniska RD, Rooney WL (2005) Phenolic compounds and antioxidant activity of sorghum grains of varying genotypes. J Agric Food Chem 53: 6813-6818.
- Afify AEl-M MR, El-Beltagi HS, Abdel-Salam SM, Omran AA (2012) Oil and fatty acid contents of white sorghum varieties under soaking, cooking, germination and fermentation processing for improving cereal quality. Not Bot Horti Agrobo 40: 86-92.
- Price ML, Van Scoyoc S, Butler LG (1978) A critical evaluation of the vanillin reaction as an assay for tannin in sorghum grain. J Agric Food Chem 26: 1214-1218.
- Lichtenthaler HK, Buschmann C (2001) Chlorophylls and carotenoids: Measurement and characterization by UV-VIS Spectroscopy. Current Protocol of Food Analytical Chemistry.
- Nagata M, Yamashita I (1992) Simple method for simultaneous determination of chlorophyll and carotenoids in tomato fruits. Nippon Shokuhin Kogyo Gakkaishi 39: 925-928.
- Osagie AU (1987) Total lipids of sorghum grain. J Agric Food Chem 35: 601-604.
- Pontieri P, Fiore RD, Troisi J, Bean SR, Roemer E, et al. (2011) Chemical composition and fatty acid content of white food sorghum grown in different environments. Maydica 56: 1-7.
- Glew RS, Chuang L, Roberts JL, Glew RH (2008) Amino acid, fatty acid and mineral content of black finger millet (Eleusine coracana) cultivated on the Jos Plateau of Nigeria. Food Global Science 2: 115-118.
- Simopoulos AP (2002) The importance of the ratio of omega-6/omega-3 essential fatty acids. Biomed Pharmacother 56: 365-379.
- Serna-Saldivar SO, Rooney LW (1995) Structure and chemistry of sorghum and millets. In: Dendy DAV (ed.). Sorghum and millets: chemistry and technology, American Association of Cereal Chemists, St. Paul, MN, USA. Pg no: 69-124.
- Prabhakara Rao PG, Balaswamy K, Narsing Rao G, Jyothirmayi T, Karuna MSL, et al. (2013) Lipid classes, fatty acid and phospholipid composition of roe lipids from Catla catla and Cirrhinus mrigala. International Food Research Journal 20: 275-279.
- Lu Y, Foo LY (2001) Unusual anthocyanin reaction with acetone leading to pyranoanthocyanin formation. Tetrahedron Letters 42: 1371-1373.
- Krishnan P, Ravi I, Nayak SK (1996) Methods for determining leaf chlorophyll content of rice: A reappraisal. Indian Journal of Experimental Biology 34: 1330-1333.
- Frazier RA, Deaville ER, Green RJ, Stringano E, Wiloughby I, et al. (2010) Interactions of tea tannins and condensed tannins with proteins. J Pharm Biomed Anal 51: 490-495.
- MSDS Sheet, Santa Cruz Biotechnology Inc, California, USA.
- Abdoul-Latif F, Koné HO, Bayili RG, Diao M, Dicko MH (2011) Correlations among bioactive compounds in sorghum grains and their impact on agronomic and food qualities.
Citation: Abugri DA, Akudago JA, Pritchett G, Russell AE, McElhenney WH (2015) Comparison of Phytochemical Compositions of Sorghum Bicolor (L) Moench Red Flour and Pale Brown Leaves. J Food Sci Nutr 1: 003.
Copyright: © 2015 Abugri DA, et al. This is an open-access article distributed under the terms of the Creative Commons Attribution License, which permits unrestricted use, distribution, and reproduction in any medium, provided the original author and source are credited.