Journal of Neonatology & Clinical Pediatrics Category: Clinical
Type: Research Article
Continuously Tracking Growth of Preterm Infants from Birth to Two Years of Age
*Corresponding Author(s):
William R RiddleDepartment Of Radiology And Radiological Sciences, Vanderbilt University, R-1311, Medical Center North, Nashville, TN, United States
Tel:+1 6153222432,
Fax:+1 6153223764
Email:bill.riddle@vanderbilt.edu
Received Date: Apr 02, 2015
Accepted Date: May 18, 2015
Published Date: Jun 01, 2015
Abstract
The objective of this study is to provide gender-specific premature infant growth curves that can be incorporated with the 2006 World Health Organization growth standards to continously track weight, head circumference, and length from 22 weeks of gestion through 2 years of age. Gender-specific percentiles of birth weight, head circumference, and length for premature infants admitted to the Vanderbilt neonatal intensive care unit were used to define intrauterine growth curves from 22 to 36 weeks in terms of best-fit functions and LMS coefficients. Multiple regression and analysis of variance was used to compare the 10th, 50th, and 90th percentiles from the Vanderbilt neonatal intensive care unit with the published values for premature infants from eight studies in the United States, Australia, Italy, Israel, Turkey, Sweden, and the United Kingdom. The intrauterine growth curves were combined with the WHO growth curves and growth trajectories based on birth percentiles were generated with Z-scores. Multiple regression and analysis of variance was also used to compare the male and female 50th percentiles for birth weight from the nine studies. The 50th percentiles for birth weight, head circumference, and length from the Vanderbilt neonatal intensive care unit are statistically identical with the intrauterine values from the United States, Israel and Turkey. Five studies showed male and female 50th percentiles for birth weight differing in the 5.6% to 6.7% range. Values from a premature infant from 32w3d to 12 months and birth percentile growth trajectories were plotted on the combined intrauterine and World Health Organization growth curves. The intrauterine curves can be used to describe infants from different countries. The combined intrauterine and World Health Organization growth curves depict the growth continium of the prematurely born infant from a gestational age of 22 weeks to 2 years of age.
Keywords
Head circumference for age; Length for age; Premature growth curves; Weight for age
ABBREVIATIONS
BW: Birth Weight
GA: Gestational Age HC: Head CircumferenceLEN: LengthLMP: Last Menstrual PeriodLMS: Three age specific cubic spline curves the L curve (Box-Cox power to remove skewness), the M curve (Median), and the S curve (coefficient of variation)NICU: Neonatal Intensive Care UnitSD: Standard DeviationU: Mean WHO: World Health Organization
GA: Gestational Age HC: Head CircumferenceLEN: LengthLMP: Last Menstrual PeriodLMS: Three age specific cubic spline curves the L curve (Box-Cox power to remove skewness), the M curve (Median), and the S curve (coefficient of variation)NICU: Neonatal Intensive Care UnitSD: Standard DeviationU: Mean WHO: World Health Organization
INTRODUCTION
Growth monitoring is a standard component of community pediatric services throughout the world [1]. Intrauterine growth charts are used to monitor the growth of premature infants in the Neonatal Intensive Care Unit (NICU). After discharge from the NICU, it is an accepted practice to plot the growth of a prematurely born infant on a term infant growth chart after determining a correction factor for the infant’s age. The correction factor commonly used, which if based on a table from reference [2], is the difference between a 40 week gestation and the gestational age of the infant [3]. For term infants from ages 0 to 2 years, the Centers for Disease Control and Prevention (USA) and the Scientific Advisory Committee on Nutrition (UK) recommend using the 2006 World Health Organization (WHO) growth standards [4]. Growth of a term infant is evaluated beginning from its birth percentiles. Premature infants are often undernourished at discharge from the NICU [5] and the percentiles at a gestational age of 40 weeks may not reflect the infant’s birth percentiles. Since there are over 12 million babies born prematurely each year [6], growth charts to continuously track growth of prematurely born infants from birth to two years of age are needed.
While there have been many published growth charts for premature infants, none of these has been embraced as a universal standard. One of the greatest problems in constructing intrauterine growth curves is the determination of gestational age [7]. Most intrauterine growth curves were developed prior to the routine use of ultrasound scanning. For these studies, gestational age was estimated solely by the mother’s reported Last Menstrual Period (LMP), which may be biased due to erroneous recall by the mother or early bleeding in the pregnancy [8]. Since the 1980s, prenatal ultrasounds are often utilized to provide more precise estimates of gestational age. Nine studies from the United States, Australia, Italy, Israel, Turkey, Sweden and the United Kingdom with gender-specific percentiles for birth weight, head circumference, and length were compared. If some of these studies are statistically identical, we propose that the values can be used as a standard. The objective of this study is to provide gender-specific premature infant growth curves that can be incorporated with the 2006 WHO growth standards to continously track weight, head circumference, and length from 22 weeks of gestion through 2 years of age.
While there have been many published growth charts for premature infants, none of these has been embraced as a universal standard. One of the greatest problems in constructing intrauterine growth curves is the determination of gestational age [7]. Most intrauterine growth curves were developed prior to the routine use of ultrasound scanning. For these studies, gestational age was estimated solely by the mother’s reported Last Menstrual Period (LMP), which may be biased due to erroneous recall by the mother or early bleeding in the pregnancy [8]. Since the 1980s, prenatal ultrasounds are often utilized to provide more precise estimates of gestational age. Nine studies from the United States, Australia, Italy, Israel, Turkey, Sweden and the United Kingdom with gender-specific percentiles for birth weight, head circumference, and length were compared. If some of these studies are statistically identical, we propose that the values can be used as a standard. The objective of this study is to provide gender-specific premature infant growth curves that can be incorporated with the 2006 WHO growth standards to continously track weight, head circumference, and length from 22 weeks of gestion through 2 years of age.
MATERIALS AND METHODS
When comparing percentiles from different studies, it is essential to know how gestational age was determined and exclusion criteria. The details for the nine studies that were compared are as follows.
Percentiles from Thomas (USA)
The gender-specific 50th percentiles for birth weight from Thomas et al., [9] are based on infants from 85 Pediatrix medical group hospitals in the United States (1996-1998). Gestational age, in completed weeks, was assigned by a neonatologist based on obstetrical history, prenatal ultrasounds, and the postnatal physical examination [10]. No infants were excluded.
Percentiles from Dobbins (Australia)
The gender-specific percentiles for birth weight from Dobbins et al., [11] are based on data of singleton live births from the national perinatal data collection of the Australian Institute of Health and Welfare (1998-2007). Gestational age, in completed weeks, was based on the LMP or the best available clinical estimate (including early pregnancy ultrasound examination). Extreme outliers, defined as values greater than 2 times the interquartile range (25th to 75th percentiles) below the first quartile and above the third quartile for each GA [12], were excluded. For normally distributed data, this is equivalent to +/-3.37 standard devolutions.
Percentiles from Bertino (Italy)
The gender-specific percentiles for birth weight, head circumference, and length from Bertino et al., [13] are from 34 NICUs in Italy (2005-2007). Gestational age, in completed weeks plus days, was based on the LMP and ultrasound assessment within the first trimester. When the difference between the gestational age derived from the LMP and the ultrasound assessment was greater than one week (3% of the infants), the ultrasound assessment was used. Infants with fetal hydrops and major congenital anomalies diagnosed at birth were excluded. Since the gestational ages were in terms of completed weeks plus days, half a week was subtracted from the reported gestational ages.
Percentiles from Davidson (Israel)
The gender-specific percentiles for birth weight, head circumference, and length from Davidson et al., [8] are based on singleton live births from the neonatal registry of the Rabin Medical Center in Petah Tikva, Israel (1991-2005). From 1991 to 1997, gestational age, in completed weeks, was based on the LMP. From 1998 to 2005, early fetal ultrasound (crown-rump length) was used to correct the gestational age computation when the discrepancy between the recorded LMP and the fetal ultrasound was greater than 1 week. Infants outside +/- 5 standard deviations were excluded. Since the number of infants was not stratified by gender, half were assigned to each gender.
Percentiles from Kurtoglu (Turkey)
The gender-specific percentiles for birth weight, head circumference, and length from Kurtoglu et al., [14] are from the medical records of infants born in 2009 at 11 hospitals in Kayseri, Turkey. Gestational ages were recorded by the obstetricians or trained nurses in labor wards. Infants outside +/- 2 standard deviations were excluded. Since the number of infants was not stratified by gender, half were assigned to each gender.
Percentiles from Niklasson (Sweden)
The gender-specific percentiles for birth weight, head circumference, and length from Niklasson and Albertsson-Wikland [15] are based on infants from the Swedish national birth registry (1990-1999). In Sweden, gestational age is based on ultrasound estimation [16]. Stillborns, multiple births, caesarean deliveries, and values outside +/- 6 standard deviations were excluded. The 10th, 50th and 90thpercentiles for birth weight, head circumference, and length were generated from the published means (U) and Standard Deviations (SD). The 10th percentile is equal to U-1.282×SD, the 50th percentile is equal to U, and the 90th percentile is equal to U+1.282×SD. Since the number of infants was not stratified by gender, half were assigned to each gender.
Percentiles from Cole (UK)
The gender-specific percentiles for birth weight, head circumference, and length from Cole et al., [17] are from five UK studies (1983-1993). The method for determining gestational age and exclusion criteria were not specified. Since the number of infants was not stratified by gender, half were assigned to each gender.
Percentiles from Olsen (USA)
The gender-specific percentiles for birth weight, head circumference, and length from Olsen et al., [18] are based on infants from 248 Pediatrix medical group hospitals in the United States (1998-2006). Gestational age, in completed weeks, was estimated by neonatologists using obstetric history, obstetric examinations, prenatal ultrasounds, and postnatal physical examinations [10]. Infants from multiple births; with missing weight, head circumference, length, or gender values; with congenital anomalies; that died before discharge; or extreme outliers were excluded. Extreme outliers were defined as values greater than 2 times the interquartile range (25th to 75th percentiles) below the first quartile and above the third quartile for each GA [12]. For normally distributed data, this is equivalent to +/-3.37 standard devolutions.
Vanderbilt NICU percentiles (USA)
With the approval of the Vanderbilt Institutional Review Board, birth measurements of infants admitted within the first 24 hours after birth to the Vanderbilt NICU for the years 1985 through 1997 were retrieved from a longitudinal database maintained by the neonatology division. There were 6,787 live born infants with gestational ages below 37 weeks (including 1,234 infants of less than 29 weeks of gestation). This subset is 89% singleton, 55% male, 76% Caucasian, 18% African American, and 6% other races. Birth weight was recorded for all of the infants. Head circumference was recorded for 90% of the group and length was recorded for 89%. Birth weight, head circumference, and length were measured by the admitting nurse while gestational age, gender, and race were assigned by the admitting neonatologist. Birth weight was measured in grams with an electronic scale. Head circumference and length were measured in centimeters with a paper tape. Race was based on the mother’s race. Gestational age, in completed weeks, was based on obstetrical history, prenatal ultrasounds, and the postnatal physical examination [10]. No infants were excluded. The data were exported into Excel (Microsoft Office) (Redmond, Washington). After sorting by gender, the mean, standard deviation, and 5th, 10th, 25th, 50th, 75th, 90th and 95th percentiles for birth weight, head circumference, and length at each gestational age were determined.
To summarize and smooth the data, several mathematical models were evaluated: exponential [y = a exp (b x)], power [y = a xb], linear [y = a x + b], quadratic [y = a x2 + b x + c], and cubic [y = a x3 + b x2 + c x + d]. An exponential function analysis fits a linear function to semi-logarithmic data (logarithm Y axis) and a power function analysis fits a linear function to full-logarithmic data (logarithm X and Y axes). The mathematical models were evaluated with SAS statistical software (Cary, NC) to determine the best model based on the Akaike’s information criterion [19] and the Bayesian information criterion [20].
The exponential function, which describes uninhibited growth with a constant growth velocity, was the best model for birth weight. The percentiles for birth weight (in grams) were described with the following function:
The LMS method is used to construct growth charts [21]. It estimates the percentiles in terms of three age specific cubic spline curves: the L curve (Box-Cox power to remove skewness), the M curve (Median), and the S curve (coefficient of variation). The gender-specific LMS coefficients for birth weight, head circumference, and length were determined with LMS chartmaker light version 2.54 (http://www.healthforallchildren.com/?product=lmschartmaker-light). The degrees of freedom for the fitted LMS spline curves were, respectively, 2, 6 and 4 for weight and 0, 4 and 3 for length and head circumference.
To summarize and smooth the data, several mathematical models were evaluated: exponential [y = a exp (b x)], power [y = a xb], linear [y = a x + b], quadratic [y = a x2 + b x + c], and cubic [y = a x3 + b x2 + c x + d]. An exponential function analysis fits a linear function to semi-logarithmic data (logarithm Y axis) and a power function analysis fits a linear function to full-logarithmic data (logarithm X and Y axes). The mathematical models were evaluated with SAS statistical software (Cary, NC) to determine the best model based on the Akaike’s information criterion [19] and the Bayesian information criterion [20].
The exponential function, which describes uninhibited growth with a constant growth velocity, was the best model for birth weight. The percentiles for birth weight (in grams) were described with the following function:
where variable GA is gestational age in weeks, constant A has units of grams, and constant B is the growth velocity for weight in units of g/kg/day. Power functions best described head circumference and length. When the power functions for the 50th percentile of HC and LEN were compared to the linear functions with zero intercept, the largest difference between the two models was 1 mm. The simpler linear model with zero intercept was selected to describe HC and LEN and the percentiles (in cm) were described by the following functions:(1)
(2)
where variable GA is gestational age in weeks, constant C is the growth velocity for head circumference in cm/week, and constant D is the growth velocity for length in cm/week. Using these models, best-fit equations for the 5th, 10th, 25th, 50th, 75th, 90th and 95th percentiles for birth weight, head circumference, and length were generated with PSI-Plot (Poly Software Incorporated, Pearl River, NY).(3)
The LMS method is used to construct growth charts [21]. It estimates the percentiles in terms of three age specific cubic spline curves: the L curve (Box-Cox power to remove skewness), the M curve (Median), and the S curve (coefficient of variation). The gender-specific LMS coefficients for birth weight, head circumference, and length were determined with LMS chartmaker light version 2.54 (http://www.healthforallchildren.com/?product=lmschartmaker-light). The degrees of freedom for the fitted LMS spline curves were, respectively, 2, 6 and 4 for weight and 0, 4 and 3 for length and head circumference.
Longitudinal data from a premature infant
Weight, head circumference, and length values from a preterm infant born in 2009 were obtained from Vanderbilt University Medical Center’s synthetic derivative, which is a database containing clinical information from Vanderbilt’s electronic medical record that has been stripped of personal identifiers. There are 33 values while in the NICU starting at 32 weeks and 8 values from follow-up exams to 11 months old.
Combined intrauterine and WHO growth curves
The intrauterine values for gestational ages from 22 to 36 weeks were generated with equations 1-3. The values for gestation-adjusted ages from 1 to 24 months were generated with the LMS coefficients from the 2006 WHO growth standards [4]. The age 0 values, which represent gestational ages from 37 to 42 weeks, were not used. While Roche [3] suggested using a correction factor for the preterm infant’s age of 40 weeks, there was better coupling between the intrauterine and term infants charts when 39 weeks was used. The gestation-adjusted age (in weeks) is equal to the infant’s gestational age minus 39 weeks. The values between a gestational age of 36 weeks and a gestation-adjusted age of 1 month were linear functions connecting the 36 week intrauterine values with the 1 month term infant values. Bertino et al., [22] observed linear growth over this time period.
Birth percentile growth trajectories
Growth trajectories based on birth percentiles were generated with Z-scores. The Z-scores for weight, head circumference, and length of premature infants at birth were determined using the 10th, 50th and 90th percentiles of equations 1-3 [23]. The intrauterine growth trajectories from birth to 36 weeks were generated using these Z-scores. The term infant growth values from 1 to 24 months were generated using the birth Z-scores and the LMS values from the 2006 WHO growth charts. The values between 36 weeks and 1 month were linear functions connecting the 36 week intrauterine values with the 1 month 2006 WHO values.
Comparing premature percentiles
Multiple regression and analysis of variance [24] was used to compare the male and female percentiles for birth weight, head circumference, and length from the Vanderbilt NICU with the published values for premature infants from Thomas [9], Dobbins [11], Davidson [8], Bertino [13], Kurtoglu [14], Niklasson [15], Cole [17], and Olsen [18]. Multiple regression and analysis of variance was also used to compare the male and female 50th percentiles for birth weight from the nine studies. Multiple regression and analysis of variance determines best-fit linear equations for the individual datasets and evaluates if the slopes and intercepts of the equations are statistically equivalent (with a p-value of 0.05). If the slopes and intercepts are statistically equivalent, the datasets are identical and the best-fit equations can be used to describe both datasets. If the intercepts are statistically different and the slopes are statistically equivalent, then the best-fit equations are parallel. Since the best-fit equations for birth weight are exponential, the logarithms of the weight percentiles (which are linear) were compared. When the logarithms of weight are parallel, the weight curves have the same growth rate (constant B from equation1) and differ by a ratio of the two constant A’s from equation 1.
RESULTS
Data from Vanderbilt NICU
The Vanderbilt NICU data are expressed in terms of observed percentiles, LMS coefficients, and best-fit equations. Tables 1 and 2 contain the number of infants, means, standard deviations, and the 5th, 10th, 25th, 50th, 75th, 90th and 95th percentiles for birth weight, head circumference, and length by gestational age for the male and female infants. Table 3 contains the male and female constants for the best-fit equations of the 5th, 10th, 25th, 50th, 75th, 90th and 95th percentiles for birth weight, head circumference, and length. Table 4 contains the male and female LMS coefficients for birth weight, head circumference, and length. Figures 1 and 2 show graphical comparisons between the LMS percentiles and the best-fit functions for the 5th, 50th and 95th percentiles for birth weight, head circumference, and length. The LMS percentiles and the best-fit function percentiles for birth weight, head circumference, and length are superimposable with the best-fit functions being better defined for gestational ages less than 26 weeks.
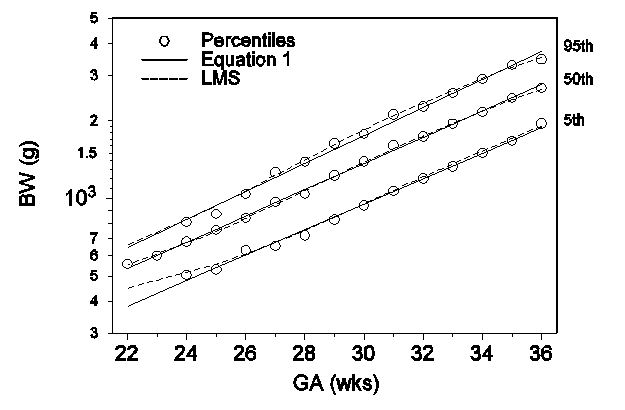
Figure 1: Comparison between the 5th, 50th and 95th percentiles for male birth weight from the Vanderbilt NICU using equation 1 and the LMS method.
Figure 1: Comparison between the 5th, 50th and 95th percentiles for male birth weight from the Vanderbilt NICU using equation 1 and the LMS method.
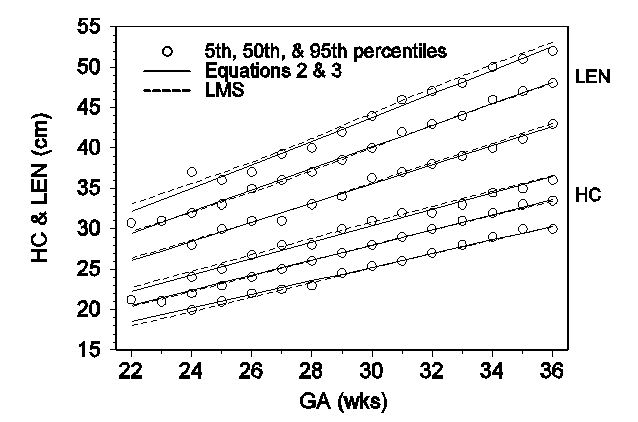
Figure 2: Comparison between the 5th, 50th and 95th percentiles for male head circumference and length from the Vanderbilt NICU using equations 2 & 3 and the LMS method.
| GA (wks) | N | mean | SD | Percentiles | ||||||
| 5th | 10th | 25th | 50th | 75th | 90th | 95th | ||||
| Weight (g) | ||||||||||
| 22 | 6 | 568 | 50 | 556 | ||||||
| 23 | 22 | 610 | 81 | 551 | 600 | 654 | ||||
| 24 | 83 | 676 | 95 | 505 | 561 | 619 | 680 | 732 | 790 | 810 |
| 25 | 85 | 736 | 116 | 531 | 590 | 670 | 756 | 820 | 848 | 870 |
| 26 | 120 | 833 | 122 | 630 | 688 | 765 | 842 | 903 | 991 | 1041 |
| 27 | 146 | 968 | 181 | 655 | 740 | 861 | 970 | 1067 | 1199 | 1260 |
| 28 | 180 | 1047 | 203 | 719 | 769 | 910 | 1040 | 1177 | 1301 | 1389 |
| 29 | 197 | 1219 | 249 | 828 | 944 | 1041 | 1230 | 1369 | 1472 | 1636 |
| 30 | 237 | 1389 | 278 | 939 | 1056 | 1220 | 1390 | 1557 | 1712 | 1781 |
| 31 | 276 | 1605 | 315 | 1068 | 1205 | 1432 | 1608 | 1792 | 1977 | 2116 |
| 32 | 457 | 1748 | 320 | 1197 | 1348 | 1550 | 1743 | 1950 | 2124 | 2273 |
| 33 | 463 | 1949 | 381 | 1331 | 1510 | 1735 | 1950 | 2126 | 2394 | 2563 |
| 34 | 505 | 2186 | 447 | 1502 | 1661 | 1889 | 2170 | 2455 | 2699 | 2911 |
| 35 | 455 | 2464 | 484 | 1676 | 1843 | 2150 | 2459 | 2750 | 3070 | 3292 |
| 36 | 482 | 2689 | 469 | 1956 | 2100 | 2400 | 2685 | 2979 | 3269 | 3469 |
| Total: | 3714 | |||||||||
| HC (cm) | ||||||||||
| 22 | 4 | 21.3 | 21.3 | |||||||
| 23 | 13 | 21.2 | 1.6 | 20.0 | 21.0 | 22.0 | ||||
| 24 | 63 | 22.3 | 1.7 | 20.0 | 20.5 | 22.0 | 22.0 | 23.0 | 23.0 | 24.0 |
| 25 | 78 | 22.9 | 1.3 | 21.0 | 21.0 | 22.0 | 23.0 | 23.7 | 24.0 | 25.0 |
| 26 | 112 | 24.2 | 1.6 | 22.0 | 23.0 | 23.0 | 24.0 | 25.0 | 26.0 | 26.7 |
| 27 | 133 | 25.3 | 1.7 | 22.5 | 23.0 | 24.0 | 25.0 | 26.0 | 27.0 | 28.0 |
| 28 | 163 | 25.9 | 1.7 | 23.0 | 24.0 | 25.0 | 26.0 | 27.0 | 28.0 | 28.0 |
| 29 | 188 | 27.0 | 1.6 | 24.5 | 25.0 | 26.0 | 27.0 | 28.0 | 29.0 | 30.0 |
| 30 | 216 | 28.1 | 1.9 | 25.4 | 26.0 | 27.0 | 28.0 | 29.0 | 30.0 | 31.0 |
| 31 | 259 | 29.1 | 1.8 | 26.0 | 27.0 | 28.0 | 29.0 | 30.0 | 31.0 | 32.0 |
| 32 | 418 | 29.9 | 1.7 | 27.0 | 28.0 | 29.0 | 30.0 | 31.0 | 32.0 | 32.0 |
| 33 | 419 | 30.6 | 1.8 | 28.0 | 28.7 | 29.9 | 31.0 | 31.9 | 33.0 | 33.0 |
| 34 | 442 | 31.6 | 1.8 | 29.0 | 29.5 | 30.0 | 32.0 | 33.0 | 34.0 | 34.5 |
| 35 | 409 | 32.6 | 1.9 | 30.0 | 30.5 | 31.5 | 33.0 | 33.7 | 35.0 | 35.0 |
| 36 | 420 | 33.4 | 2.0 | 30.0 | 31.0 | 32.0 | 33.5 | 34.5 | 35.0 | 36.0 |
| Total: | 3337 | |||||||||
| LEN (cm) | ||||||||||
| 22 | 4 | 30.8 | 30.8 | |||||||
| 23 | 13 | 30.6 | 2.3 | 30.0 | 31.0 | 31.0 | ||||
| 24 | 61 | 32.4 | 2.6 | 28.0 | 29.0 | 31.0 | 32.0 | 33.5 | 35.5 | 37.0 |
| 25 | 76 | 33.2 | 2.0 | 30.0 | 31.0 | 32.0 | 33.0 | 34.0 | 36.0 | 36.0 |
| 26 | 105 | 34.5 | 1.8 | 31.0 | 32.0 | 33.0 | 35.0 | 36.0 | 36.0 | 37.0 |
| 27 | 131 | 35.8 | 2.6 | 31.0 | 32.0 | 34.0 | 36.0 | 38.0 | 39.0 | 39.3 |
| 28 | 158 | 36.9 | 2.1 | 33.0 | 34.0 | 35.5 | 37.0 | 38.0 | 39.0 | 40.0 |
| 29 | 186 | 38.5 | 2.6 | 34.0 | 35.0 | 37.0 | 38.5 | 40.0 | 42.0 | 42.0 |
| 30 | 213 | 40.1 | 2.4 | 36.3 | 37.0 | 38.5 | 40.0 | 42.0 | 43.0 | 44.0 |
| 31 | 261 | 41.7 | 2.9 | 37.0 | 38.0 | 40.0 | 42.0 | 43.5 | 45.0 | 46.0 |
| 32 | 414 | 42.9 | 2.9 | 38.0 | 40.0 | 41.0 | 43.0 | 45.0 | 46.0 | 47.0 |
| 33 | 411 | 44.0 | 2.7 | 39.0 | 41.0 | 42.5 | 44.0 | 46.0 | 47.0 | 48.0 |
| 34 | 444 | 45.4 | 3.1 | 40.0 | 42.0 | 43.9 | 46.0 | 47.0 | 49.0 | 50.0 |
| 35 | 404 | 46.9 | 3.2 | 41.2 | 43.0 | 45.0 | 47.0 | 49.0 | 50.0 | 51.0 |
| 36 | 409 | 48.0 | 2.8 | 43.0 | 44.0 | 46.0 | 48.0 | 50.0 | 51.5 | 52.0 |
| Total: | 3290 | |||||||||
| GA (wks) | N | mean | SD | Percentiles | ||||||
| 5th | 10th | 25th | 50th | 75th | 90th | 95th | ||||
| Weight (g) | ||||||||||
| 22 | 7 | 521 | 103 | 454 | ||||||
| 23 | 24 | 589 | 69 | 538 | 592 | 642 | ||||
| 24 | 68 | 642 | 91 | 504 | 540 | 579 | 643 | 697 | 761 | 796 |
| 25 | 87 | 701 | 105 | 520 | 561 | 635 | 705 | 770 | 842 | 859 |
| 26 | 102 | 805 | 154 | 622 | 651 | 705 | 780 | 876 | 1006 | 1097 |
| 27 | 139 | 918 | 218 | 625 | 668 | 778 | 905 | 1025 | 1194 | 1260 |
| 28 | 180 | 1047 | 203 | 719 | 769 | 910 | 1040 | 1177 | 1301 | 1389 |
| 29 | 197 | 1219 | 249 | 828 | 944 | 1041 | 1230 | 1369 | 1472 | 1636 |
| 30 | 237 | 1389 | 278 | 939 | 1040 | 1150 | 1360 | 1497 | 1659 | 1741 |
| 31 | 263 | 1493 | 342 | 959 | 1084 | 1272 | 1492 | 1695 | 1863 | 2020 |
| 32 | 410 | 1673 | 338 | 1185 | 1304 | 1471 | 1655 | 1851 | 2049 | 2191 |
| 33 | 364 | 1880 | 368 | 1335 | 1450 | 1639 | 1880 | 2092 | 2331 | 2521 |
| 34 | 388 | 2077 | 412 | 1450 | 1579 | 1834 | 2041 | 2278 | 2536 | 2768 |
| 35 | 302 | 2274 | 479 | 1505 | 1720 | 1960 | 2227 | 2557 | 2862 | 3152 |
| 36 | 310 | 2588 | 561 | 1791 | 1915 | 2218 | 2551 | 2906 | 3301 | 3555 |
| Total: | 3073 | |||||||||
| HC (cm) | ||||||||||
| 22 | 3 | 20.7 | 20.0 | |||||||
| 23 | 16 | 22.4 | 2.3 | 21.4 | 22.0 | 22.6 | ||||
| 24 | 58 | 22.0 | 1.1 | 20.0 | 21.0 | 21.0 | 22.0 | 23.0 | 23.0 | 23.2 |
| 25 | 74 | 23.1 | 2.2 | 21.0 | 21.0 | 22.0 | 23.0 | 23.5 | 25.0 | 27.1 |
| 26 | 98 | 23.7 | 1.6 | 21.9 | 22.0 | 23.0 | 23.5 | 24.5 | 25.5 | 26.0 |
| 27 | 126 | 24.7 | 1.6 | 22.4 | 23.0 | 23.6 | 24.5 | 25.5 | 27.0 | 27.4 |
| 28 | 156 | 25.6 | 1.6 | 23.0 | 23.5 | 25.0 | 25.8 | 27.0 | 28.0 | 28.0 |
| 29 | 200 | 26.7 | 1.6 | 24.0 | 24.5 | 25.7 | 27.0 | 27.5 | 29.0 | 29.0 |
| 30 | 217 | 27.8 | 2.2 | 25.0 | 26.0 | 27.0 | 28.0 | 29.0 | 30.0 | 30.1 |
| 31 | 252 | 28.5 | 1.9 | 25.6 | 26.0 | 27.0 | 29.0 | 30.0 | 31.0 | 31.0 |
| 32 | 369 | 29.2 | 1.7 | 26.5 | 27.0 | 28.0 | 29.0 | 30.0 | 31.0 | 32.0 |
| 33 | 330 | 30.2 | 2.0 | 27.0 | 28.0 | 29.0 | 30.1 | 31.0 | 32.5 | 33.0 |
| 34 | 347 | 31.1 | 2.1 | 28.0 | 29.0 | 30.0 | 31.0 | 32.0 | 33.0 | 34.0 |
| 35 | 264 | 31.8 | 2.1 | 28.6 | 30.0 | 31.0 | 32.0 | 33.0 | 34.0 | 35.0 |
| 36 | 262 | 32.8 | 2.2 | 29.5 | 30.0 | 31.5 | 33.0 | 34.0 | 35.0 | 36.0 |
| Total: | 2772 | |||||||||
| LEN (cm) | ||||||||||
| 22 | 3 | 28.3 | 28.0 | |||||||
| 23 | 15 | 31.6 | 2.0 | 30.0 | 31.0 | 32.0 | ||||
| 24 | 54 | 32.0 | 2.8 | 29.7 | 30.5 | 32.0 | 33.0 | 34.4 | 35.2 | |
| 25 | 72 | 32.9 | 2.9 | 28.8 | 29.1 | 31.0 | 33.0 | 34.0 | 36.0 | 36.2 |
| 26 | 92 | 33.8 | 2.4 | 30.0 | 31.0 | 32.0 | 34.0 | 35.0 | 36.5 | 38.0 |
| 27 | 125 | 35.3 | 2.5 | 32.0 | 32.5 | 34.0 | 35.0 | 36.5 | 38.3 | 39.0 |
| 28 | 153 | 36.6 | 2.2 | 33.0 | 33.1 | 35.5 | 37.0 | 38.0 | 39.0 | 40.0 |
| 29 | 194 | 38.3 | 3.0 | 32.8 | 34.7 | 37.0 | 38.0 | 40.0 | 42.0 | 42.4 |
| 30 | 210 | 39.9 | 2.5 | 36.0 | 37.0 | 38.0 | 40.0 | 41.0 | 43.0 | 44.0 |
| 31 | 247 | 41.0 | 2.9 | 36.0 | 37.0 | 39.0 | 41.0 | 43.0 | 44.7 | 45.4 |
| 32 | 373 | 42.1 | 2.8 | 38.0 | 39.0 | 40.5 | 42.0 | 44.0 | 45.5 | 46.0 |
| 33 | 326 | 43.7 | 2.9 | 39.0 | 40.0 | 42.0 | 44.0 | 46.0 | 47.0 | 48.0 |
| 34 | 342 | 44.8 | 2.9 | 40.0 | 41.0 | 43.0 | 45.0 | 47.0 | 48.5 | 49.0 |
| 35 | 264 | 45.8 | 3.3 | 41.0 | 42.0 | 43.5 | 46.0 | 48.0 | 50.0 | 51.0 |
| 36 | 260 | 47.4 | 3.0 | 42.0 | 43.5 | 45.5 | 47.8 | 49.0 | 51.0 | 52.0 |
| Total: | 2730 | |||||||||
| Percentile | A (g) | B (g/kg/day) | C (cm/week) | D (cm/week) |
| Female constants | ||||
| 5th | 34.32 | 15.64 | 0.8259 | 1.1715 |
| 10th | 34.32 | 16.03 | 0.8484 | 1.2043 |
| 25th | 38.02 | 16.2 | 0.8834 | 1.2629 |
| 50th | 36.53 | 16.98 | 0.9192 | 1.3213 |
| 75th | 40.87 | 16.98 | 0.9499 | 1.3720 |
| 90th | 43.71 | 17.18 | 0.9838 | 1.4250 |
| 95th | 41.90 | 17.69 | 1.0037 | 1.4513 |
| Male constants | ||||
| 5th | 31.07 | 16.29 | 0.8423 | 1.1835 |
| 10th | 35.15 | 16.21 | 0.8651 | 1.2264 |
| 25th | 38.41 | 16.43 | 0.8948 | 1.2819 |
| 50th | 40.56 | 16.75 | 0.9333 | 1.3381 |
| 75th | 41.49 | 17.12 | 0.9636 | 1.3885 |
| 90th | 41.86 | 17.52 | 0.9927 | 1.4332 |
| 95th | 40.54 | 17.95 | 1.0129 | 1.4592 |
| Weight for Age Curve | HC for Age Curve | Length for Age Curve | |||||||||
| L Curve | M Curve | S Curve | L Curve | M Curve | S Curve | L Curve | M Curve | S Curve | |||
| GA | Value | Value | Value | Value | Value | Value | Value | Value | Value | ||
| Female Curves | |||||||||||
| 22 | 0.36140 | 518.91 | 0.12525 | 1 | 20.577 | 0.07864 | 1 | 29.385 | 0.08283 | ||
| 23 | 0.34310 | 576.51 | 0.13963 | 1 | 21.383 | 0.07675 | 1 | 30.561 | 0.08077 | ||
| 24 | 0.32477 | 635.57 | 0.15468 | 1 | 22.194 | 0.07488 | 1 | 31.736 | 0.07870 | ||
| 25 | 0.30638 | 704.16 | 0.17041 | 1 | 23.023 | 0.07307 | 1 | 32.923 | 0.07662 | ||
| 26 | 0.28792 | 791.20 | 0.18583 | 1 | 23.882 | 0.07134 | 1 | 34.150 | 0.07459 | ||
| 27 | 0.26937 | 895.43 | 0.19877 | 1 | 24.780 | 0.06981 | 1 | 35.443 | 0.07277 | ||
| 28 | 0.25063 | 1,017.57 | 0.20741 | 1 | 25.709 | 0.06860 | 1 | 36.801 | 0.07126 | ||
| 29 | 0.23167 | 1,161.39 | 0.21229 | 1 | 26.650 | 0.06774 | 1 | 38.199 | 0.07009 | ||
| 30 | 0.21279 | 1,316.41 | 0.21377 | 1 | 27.570 | 0.06705 | 1 | 39.590 | 0.06913 | ||
| 31 | 0.19437 | 1,477.30 | 0.21198 | 1 | 28.448 | 0.06632 | 1 | 40.937 | 0.06840 | ||
| 32 | 0.17595 | 1,651.39 | 0.20793 | 1 | 29.302 | 0.06571 | 1 | 42.245 | 0.06783 | ||
| 33 | 0.15709 | 1,841.61 | 0.20432 | 1 | 30.163 | 0.06545 | 1 | 43.530 | 0.06737 | ||
| 34 | 0.13778 | 2,045.89 | 0.20322 | 1 | 31.026 | 0.06543 | 1 | 44.784 | 0.06696 | ||
| 35 | 0.11825 | 2,264.15 | 0.20505 | 1 | 31.889 | 0.06555 | 1 | 46.024 | 0.06655 | ||
| 36 | 0.09862 | 2,493.75 | 0.20834 | 1 | 32.755 | 0.06575 | 1 | 47.271 | 0.06603 | ||
| 22 | 1.01841 | 552.61 | 0.11408 | 1 | 20.359 | 0.07056 | 1 | 29.676 | 0.06818 | ||
| 23 | |||||||||||