Complementary and Alternative Medicine (CAM): Single, Multiple and High-Density Function Locations in Intermediately Sized Centers in Ontario, Canada
*Corresponding Author(s):
Stephen P MeyerSchool Of Northern And Community Studies Geography Unit, Laurentian University, Ontario, Canada
Tel:+1 7056751151, 3431
Email:smeyer@laurentian.ca
Abstract
Research on the geography of Complementary and Alternative Medicine (CAM) is emerging; yet, assessing function at CAM locations remains novel. This paper uses nearest neighbor analysis, closest facilities analysis and point density tools, within the Geographic Information Systems (GIS) environment, to compare the geographies of single, multiple and high-density function locations in 14 intermediately sized centers in the Canadian province of Ontario. Based on a sample of 2,326 CAM functions, 72.9% are concentrated in space and are situated: inside the same neighborhood, at the same address and/or ‘within’ the same CAM provider. Deductively, these clustering benefits, or agglomeration economies, accrue to both CAM practitioners and CAM patients. There is deviation by region, as northern residents travel further to CAM function (more than 6.3 kilometers) compared to those in the south (typically less than 4.0 kilometers). Spatial properties by CAM type show distinctiveness with massage therapy functions more likely to be outside, and naturopathic services within, CAM function concentrations and chiropractic, acupuncture and homeopathic functions intermediate by comparison.
Keywords
INTRODUCTION
Complementary and Alternative Medicine (CAM) and its inherent holistic approach to health care, has many forms including: massage, chiropractic, acupuncture, naturopathic, homeopathic and so on. Those interested in CAM are probably most familiar with articles (both academic and otherwise) that are not particularly geographical in context. Common areas of focus include highlighting CAM procedures and/or evaluating the effectiveness of CAM approaches. Contributions to the CAM literature that are parenthetically geographical in scope are accumulating; and often these studies profile CAM users in specific places and/or evaluate CAM’s position within wider health care systems and its potential to integrate with Conventional Medicine (CM) facilities in particular cities or rural areas. An important subset of the literature is also emerging comprised of studies that utilize datasets that contain actual (or an aggregation of) CAM location points. Such analysis provides for a far more direct spatial assessment of CAM resources over space.
Wardle et al., mapped geocoded points of homeopaths, naturopaths, chiropractors, acupuncturists and osteopaths in rural Southwest Wales, Australia and found that CAM practitioners are prevalent in all rural areas whether well served or under served by CM providers [1]. Egan et al., reported that the distribution of CAM units available for people with cancer in England, Scotland, Wales and Northern Ireland are uneven amongst and within these countries [2]. Most of these units are within the hospital grounds and counseling is the most common CAM treatment. Other studies use location based data for regression analysis in: the Netherlands to predict alternative medical use by settlement characteristics, patient traits and perceptions towards CAM and CM; the United States to show that overall health professional shortage areas are related to chiropractic practice volume; and Arizona and Washington to establish relationships between the number of naturopaths per county and proximity to naturopathic medical school and population density [3-5]. Using both regression and spatial autocorrelation cluster analysis, Sanders et al., assessed clinic locations for health care providers offering musculoskeletal therapies (physiotherapy, chiropractic, acupuncture and the like) and general practitioners in Auckland, New Zealand [6]. They determined that privately funded offices cluster in central areas whereas publically funded clinics disperse more evenly across the study area. In Auckland, clinic location appears to be correlated with proximity to major roads and urban centers, socio economic status and ethnicity. There is evidence that CAM office frequency is higher in regions of the Republic of Ireland where religious affiliation is less prevalent [7]. By also emphasizing location data, Williams showed that the spatial pattern of CAM offices behaves in a contagious and hierarchical manner with diffusion from larger urban areas in British Columbia and Ontario [8]. Through spatial autocorrelation analysis and, like Williams, with a methodology steeped in diffusion theory, Albert and Butar found that the licensing of naturopathic medicine occurs in a contagious fashion in the United States and Canada and therefore spatial proximity is important in predicting where new licenses will materialize (at the state and province level, respectively) [9]. Albert reiterated that ND certification spreads in a contagious fashion, from licensed states to adjacent or proximal non-licensed states, and highlight New York and Colorado as key areas for continued diffusion in the United States once NDs become licensed in these jurisdictions [10].
Meyer has published several papers utilizing the actual addresses of CAM location points to assess a variety of geographic trends for Ontario municipalities throughout the province and/or for regions within Ontario cities. Some of the highlights include the following. General nearest neighbor and nearest neighbor hierarchical clustering procedures show that CAM offices significantly cluster within four intermediate sized cities [11]. CAM displays a more even pattern across the urban rural continuum in Ontario in comparison to CM offices and certain CAM and CM specializing municipalities are associated with community well being indicators and urban density measures [12]. With the use of spatial autocorrelation analysis, location quotients and standard distance calculations, it is shown that acupuncture offices create a unique and highly polarized pattern in comparison to CAM in general and CM offices in the Toronto metropolitan area. These acupuncture office clusters occur primarily in neighborhoods with high proportions of people with Chinese and Southeast Asian ethnic origins [13]. Larger urban areas generally exhibit superior levels of spatial accessibility to both CAM and CM compared to more peripheral/rural areas, but in many areas of the province the difference is not striking and this challenges the often assumed ‘urban rich, rural poor’ assessment of health care resources common to studies that consider only access to CM [14]. Regression analysis results show the association between place specific criteria, such as urbanization, diverse markets and closeness to other CAM operations, with various types of CAM office frequency (chiropractic, massage, holistic, acupuncture, naturopathic and homeopathic) [15]. The spatial distributions of acupuncture treatment locations throughout metropolitan Toronto were categorized in terms of visibility characteristics (as measured by proximity to main roads and commercial land use) and advertising tendencies (as estimated by advertising budgets and the size of yellow page ads). Many of these offices are situated in high visibility/high volume areas and pursue aggressive advertising approaches to attract patrons. In contrast, other offices depend on an impeccable reputation, locate in low visibility areas, and pursue a more modest approach to advertising [16]. By analyzing office location data and survey information, evidence of an interesting paradox emerges; collectively many Naturopaths (NDs) locate in or near visible sites even though the majority of their patients would seek their expertise regardless of where they locate. Most patients of NDs indicate they put far more weight on quality of service than on spatial accessibility [17]. Spatial autocorrelation and nearest neighbor analyses reveal that most naturopaths are indeed proximate to significant clusters of Doctors of Medicine (MDs), however survey data show that while greater integration with the CM sector is welcomed (by naturopaths and their patients), this is not occurring to any great degree in practice. Spatial proximity between NDs and MDs may provide the opportunity for deeper integration in delivering patient care, but significant barriers persist largely due to the perception that many MDs lack respect for and/or knowledge of naturopathic approaches [18].
This study adds to the ‘geography of CAM’ literature, but it does so by going beyond assessing just CAM location and evaluates the spatial properties of CAM function at specific location points within fourteen Ontario cities.
MATERIALS AND METHODS
A sample of 2,326 CAM functions was compiled that contain registered massage therapy (which in some cases include osteopathy), chiropractic, acupuncture (which may also include other forms of Traditional Chinese Medicine), naturopathic medicine and homeopathy. These five classes of function were collected specifically for 14 Census Metropolitan Areas (CMAs) of over 100,000 or Census Agglomerations (CAs) 50,000 to 100,000 in Ontario [19]. These locations are Barrie, Belleville, Greater Sudbury, Kingston, Kitchener Waterloo Cambridge, London, North Bay, Oshawa, Peterborough, Sarnia, Sault Ste. Marie, St. Catharines Niagara, Thunder Bay and Windsor. Given the exclusion of the province’s three most populated metropolitan areas (Toronto, Ottawa and Hamilton) and that CAs attain at least 50,000 in population, these 14 CMAs/CAs represent a subset of intermediately sized centers in Ontario [20]. For spatial diversity, CMAs/CAs from the eastern, central, western and northern parts of the province was chosen (Figure 1).
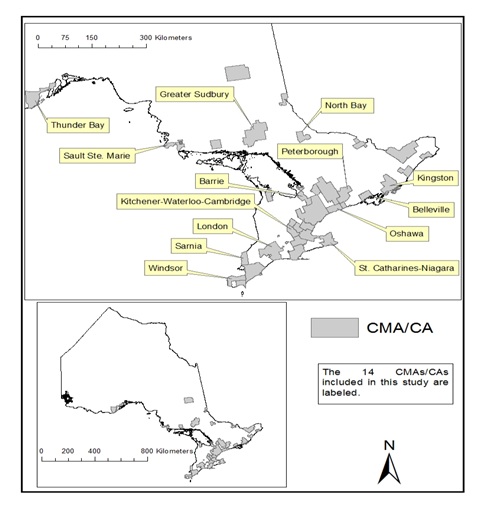 Figure 1: Census Metropolitan Areas (CMAs) and Census Agglomerations (CAs) in the province of Ontario.
The address of each CAM function was recorded into a unique dataset. Two key data sources were used to build this database: Info Canada [21] and Yellow Pages Canada [22]. Info Canada uses telephone directories, annual reports and various governmental records to compile information and the company telephone verifies each case [21]. Additional CAM functions not listed by Info Canada were retrieved through the Yellow Pages Canada website (during May and June of 2014). The cartographic boundary files (CMAs/CAs and provincial boundaries) and road network files were downloaded from the Statistics Canada website [23,24]. The address locator tool in ESRI’s Geographic Information Systems (GIS) software ArcGIS was used to geocode the CAM function addresses as points on to the road network layer [25].
There are four main objectives of this study:
1. To assess and compare the spatial properties of CAM locations in terms of single function, multifunction and high-density cluster function.
2. To measure distances from points of demand to nearest single, multiple and high-density function locations.
3. To compare CAM function type (massage, chiropractic, acupuncture, naturopathic and homeopathic) in relation to single, multiple and high-density function locations.
4. To discuss these findings in terms of agglomeration economies implications. Three key procedures carried out with ArcGIS helped satisfy the first three objectives: nearest neighbor analysis, a point density procedure and closest facilities analysis.
The Nearest Neighbor Ratio (NNR) indicates if an observed pattern of points deviates from a theoretical (expected) random distribution sufficiently enough to be deemed significantly clustered or dispersed [26]. NNRs range from 0 (completely clustered) to greater than 2 (extreme dispersion). NNRs were computed and compared for CAM functions and CAM locations within the aforementioned 14 centers. This procedure allowed for CAM function locations to be objectively compared in terms of clustering, dispersion and/or random pattern propensities.
CAM function density surfaces identify where high concentrations of CAM services occur within each CMA/CA. The point density tool created density raster layers from the CAM function points. Each raster cell contains CAM functions per square kilometer. Five classes were identified with the natural breaks (Jenks) method of classification. The top two density class intervals were isolated (with the reclassify tool) and displayed as High-Density CAM Function Clusters (HDCFCs). Each HDCFC was converted from raster to vector polygons. Figure 2 provides an illustration of the HDCFC polygons for the Greater Sudbury CMA. The derived HDCFCs contain both single and multiple function office locations and indicate ‘neighborhoods’ where CAM function is comparatively abundant.
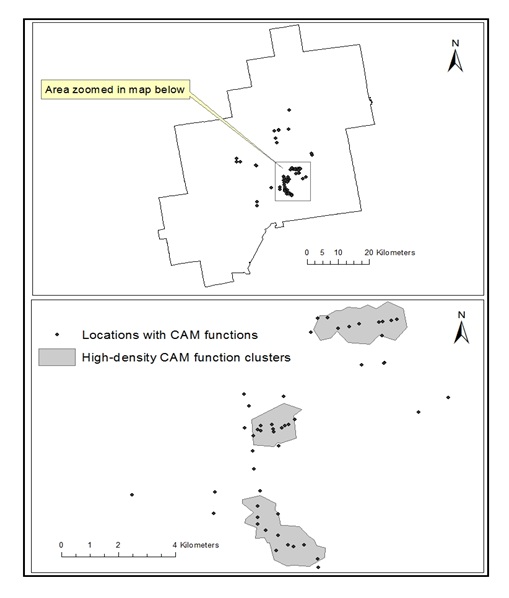 Figure 2: Complementary and Alternative Medicine (CAM) function locations in the Greater Sudbury census metropolitan area.
The ArcGIS network analyst extension measures the mean distance travelled from demand points to various locations of CAM function. An understanding of the distances between demand points and CAM function provides information on patient/customer accessibility to CAM supply. The mean distance travelled from 100 randomly selected points, in each of the 14 aforementioned centers, was measured to closest CAM functions. These demand points mimic household and/or workplace locations. The random selection of these demand points was as follows. In each CMA/CA, 100 road segments were randomly selected with the IBM SPSS Statistics [27] software. The road network is made up of road segments that are joined at intersections. Since there are many more intersections, and thus road segments, where there are more people and/or economic activity, the random sample is inherently weighted by population density. Then, the ‘create random point’ tool randomly placed a point on each of the 100 selected road segments in each of the 14 CMAs.
Agglomeration economies, whether localization or urbanization, are benefits that firms or organizations achieve by being close in space. Localization economies accrue to similar firms doing similar things in close proximity and urbanization economies are advantages firms of any type gain by being in urban, particularly metropolitan, high-density areas. In the context of CAM, localization advantages can manifest to the CAM professional and/or patient by: reducing costs through sharing office resources and staff with colleagues, being proximate to specialized tacit knowledge, and offering patients the ability to choose from a range of CAM functions in one convenient location. CAM operators offering services in high volume, central and highly visible locations (urbanization advantages) may benefit from increased sales in comparison to CAM operators in more peripheral locales. Spatial proximity of CAM function can occur: within the same HDCFC (with many CAM functions available within walking distances), within the same office setting (in which a chiropractor, massage therapist and a naturopath coexist, for instance) or ‘within the same professional’ (a CAM provider skilled in homeopathy, naturopathy and acupuncture, for example). The observed patterns of CAM function in light of agglomeration economies implications are presented in the discussion section.
OBSERVATIONS
CAM by function in 14 cities
| Census Metropolitan Area (CMA) and Census Agglomeration (CA) | Population 2011a | Number of CAM locations | Number of CAM functions | CAM functions per 10,000 people |
| Barrie (CMA) | 187,013 | 100 | 174 | 9.3 |
| Belleville (CA) | 92,540 | 31 | 63 | 6.81 |
| Greater Sudbury (CMA) | 160,770 | 69 | 118 | 7.34 |
| Kingston (CMA) | 159,561 | 69 | 104 | 6.52 |
| Kitchener-Waterloo-Cambridge (CMA) | 477,160 | 244 | 375 | 7.86 |
| London (CMA) | 474,786 | 180 | 289 | 6.09 |
| North Bay (CA) | 64,043 | 37 | 64 | 9.99 |
| Oshawa (CMA) | 356,177 | 120 | 201 | 5.64 |
| Peterborough (CMA) | 118,975 | 76 | 133 | 11.12 |
| Sarnia (CA) | 89,555 | 43 | 77 | 8.6 |
| Sault Ste. Marie (CA) | 79,800 | 32 | 53 | 6.64 |
| St. Catharines-Niagara (CMA) | 392,184 | 181 | 310 | 7.9 |
| Thunder Bay (CMA) | 121,596 | 58 | 131 | 10.77 |
| Windsor (CMA) | 319,246 | 125 | 234 | 7.33 |
| Total above | 3,093,406 | 1,365 | 2,326 | 7.52 |
| Number of functions at a location | Characteristics |
| Two functions (295 locations) | Two functions the same - 113 (38.3%)Two functions different - 182 (61.7%) |
| Three functions (125 locations) | Three functions the same - 25 (20.0%)Two functions the same, one different - 59 (47.2%)Three functions different - 41 (32.8%) |
| Four functions (50 locations) | Four functions the same - 1 (2.0%)Three functions the same, one different - 16 (32.0%)Two pairs the same - 14 (28.0%)Two the same, two distinct - 15 (30.0%)Four different - 4 (8.0%) |
| Five functions (28 locations) | Five functions the same - 2 (7.1%)Four functions the same, one different - 4 (14.3%)Three the same, two the same - 5 (17.9%)Three the same, the rest different - 4 (14.3%)Two pair the same, one different - 10 (35.7%)Two the same, the rest different - 3 (10.7%) |
| Six functions or more (24 locations) | More than five functions the same - 7 (29.2%)Three or four functions the same - 16 (66.7%)Two pair the same, two distinct - 1 (4.1%) |
| Census Metropolitan Area (CMA) and Census Agglomeration (CA) | NNRs for CAM functions | NNRs for CAM locations | NNRs for single function CAM locations | NNRs for multifunction CAM locations |
| Barrie (CMA) | 0.18 | 0.67 | 0.73 | 0.8 |
| Belleville (CA) | 0.46 | 1.13c | 1.56b | 0.90c |
| Greater Sudbury (CMA) | 0.24 | 0.46 | 0.53 | 0.83c |
| Kingston (CMA) | 0.5 | 0.79 | 1.05 | 1.08c |
| Kitchener-Waterloo-Cambridge (CMA) | 0.39 | 0.7 | 0.69 | 0.93c |
| London (CMA) | 0.24 | 0.54 | 0.67 | 0.59 |
| North Bay (CA) | 0.29 | 1.14c | 1.16 | 1.87b |
| Oshawa (CMA) | 0.4 | 0.84 | 0.84 | 0.97c |
| Peterborough (CMA) | 0.28 | 0.54 | 0.66 | 0.92c |
| Sarnia (CA) | 0.53 | 0.98c | 1.33b | 0.97c |
| Sault Ste. Marie (CA) | 0.43 | 0.91c | 1.55b | 1.09c |
| St. Catharines-Niagara (CMA) | 0.28 | 0.55 | 0.56 | 0.7 |
| Thunder Bay (CMA) | 0.38 | 1.00c | 1.29b | 1.20c |
| Windsor (CMA) | 0.2 | 0.52 | 0.51 | 0.83 |
bsignificantly dispersed at a confidence interval of at least 99% or cinsignificant/randomc.
| Census Metropolitan Area (CMA) and Census Agglomeration (CA) | % of all CAM functions in HDCFCs | % of all CAM locations in HDCFCs | % of all CAM single function locations in HDCFCs | % of all CAM multifunction locations in HDCFCs |
| Barrie (CMA) | 42.5 | 39 | 32.7 | 45.1 |
| Belleville (CA) | 33.3 | 25.8 | 17.5 | 35.7 |
| Greater Sudbury (CMA) | 50.8 | 44.9 | 39.5 | 53.8 |
| Kingston (CMA) | 29.8 | 24.6 | 20 | 33.3 |
| Kitchener-Waterloo-Cambridge (CMA) | 23.2 | 21.3 | 21.8 | 20.1 |
| London (CMA) | 36.3 | 33.3 | 29.2 | 40.3 |
| North Bay (CA) | 26.6 | 18.9 | 9.5 | 31.3 |
| Oshawa (CMA) | 30.3 | 26.7 | 25 | 29.5 |
| Peterborough (CMA) | 37.6 | 27.6 | 20.4 | 40.7 |
| Sarnia (CA) | 30 | 18.6 | 11.1 | 31.3 |
| Sault Ste. Marie (CA) | 67.9 | 46.8 | 42.1 | 76.9 |
| St. Catharines-Niagara (CMA) | 41.6 | 36.5 | 30.9 | 45.6 |
| Thunder Bay (CMA) | 53.4 | 36.2 | 25 | 46.7 |
| Windsor (CMA) | 29.1 | 24 | 17.4 | 32.1 |
| Total above | 36 | 30.3 | 25.1 | 38.4 |
Travelling to CAM functions
| Census Metropolitan Area (CMA) and Census Agglomeration (CA) | Closest CAM location | Closest single function CAM location | Closest multifunction CAM location |
| Barrie (CMA) | 4.7 | 5.9 | 5.3 |
| Belleville (CA) | 3.9 | 4.7 | 4.6 |
| Greater Sudbury (CMA) | 6.7 | 6.9 | 9.5 |
| Kingston (CMA) | 9.4 | 10.1 | 14.3 |
| Kitchener-Waterloo-Cambridge (CMA) | 1.5 | 1.7 | 2.3 |
| London (CMA) | 3.6 | 4.6 | 4.4 |
| North Bay (CA) | 6.3 | 8.4 | 6.8 |
| Oshawa (CMA) | 2.1 | 2.5 | 2.6 |
| Peterborough (CMA) | 6.9 | 7.3 | 9.6 |
| Sarnia (CA) | 4.8 | 5.1 | 5.8 |
| Sault Ste. Marie (CA) | 6.9 | 7.2 | 7.4 |
| St. Catharines-Niagara (CMA) | 2.3 | 2.6 | 3.4 |
| Thunder Bay (CMA) | 9 | 9.3 | 9.7 |
| Windsor (CMA) | 2.4 | 2.8 | 3.5 |
| Census Metropolitan Area (CMA) and Census Agglomeration (CA) | Closest two function CAM location | Closest ‘three or more function’ CAM location | Closest HDCFCa |
| Barrie (CMA) | 5.5 | 7.8 | 9.4 |
| Belleville (CA) | 5.6 | 4.9 | 12.4 |
| Greater Sudbury (CMA) | 12.1 | 10.1 | 15.2 |
| Kingston (CMA) | 14.4 | 15.3 | 15.7 |
| Kitchener-Waterloo-Cambridge (CMA) | 2.7 | 3.1 | 5.4 |
| London (CMA) | 4.8 | 5.9 | 8.8 |
| North Bay (CA) | 8.7 | 7.4 | 10.5 |
| Oshawa (CMA) | 3.7 | 3.9 | 8 |
| Peterborough (CMA) | 9.9 | 12.8 | 14.3 |
| Sarnia (CA) | 6.1 | 6.6 | 8.8 |
| Sault Ste. Marie (CA) | 7.8 | 8.6 | 7.4 |
| St. Catharines-Niagara (CMA) | 3.8 | 7.8 | 10.3 |
| Thunder Bay (CMA) | 10 | 10.2 | 10.6 |
| Windsor (CMA) | 3.9 | 5.9 | 6.9 |
CAM function by type
| Function type and total number of functions | % of functions in single function location | % of functions in multifunction location | % of functions within HDCFC | % of functions outside HDCFC |
| Massage (1,032) | 44.9 | 55.1 | 33.2 | 66.8 |
| Chiropractor (830) | 28.2 | 71.8 | 35.9 | 64.1 |
| Acupuncture (259) | 30.1 | 69.9 | 39.4 | 60.6 |
| Naturopath (163) | 31.9 | 68.1 | 49.1 | 50.9 |
| Homeopath (42) | 50 | 50 | 38.1 | 61.9 |
| Total above (2,326) | 36.5 | 63.5 | 36.1 | 63.9 |
| Type | Median of closest function location | Median of closest single function location | Median of closest multifunction location |
| Massage | 5.1 | 5.9 | 5.7 |
| Chiropractor | 5.4 | 7.6 | 6 |
| Acupuncture | 7.8 | 9.9 | 8.2 |
| Naturopath | 8.7 | 10.1 | 9.5 |
| Homeopath | 10.5 | 12.8 | 11.3 |
DISCUSSION
The HDCFCs are located in the central locations of downtowns or areas adjacent to downtowns, in the 14 cities of this study, and the formation of these concentrations undoubtedly relates to agglomeration advantage. The centrality of these locations not only provides strong visibility via traffic volume, but also accessibility through main public transit routes and other urbanization economies advantages. Localization economies are also strongly indicated. Whether populated by single or multiple function CAM locations, the richness of CAM services found in HDCFCs gives CAM patrons the ability to consult several CAM services within a ‘neighborhood’ in one trip and the ability for CAM professionals to make referrals to other colleagues within the same building or ‘just down the block’. Localization advantage also accrues to CAM professionals who can meet ‘face to face’ with a nearby colleague to exchange knowledge. Hence, for many CAM operators, who are both health care providers and small business owners, the attraction of central, high volume areas and the ability to be ‘seen’ is no different from what motivates other commercial proprietors to be in high visibility sites [16,17]. Moreover, the ability to exchange industry specific information with like-minded professionals in close proximity is a well-known explanation for high technology firm clusters and spatial closeness could in a similar way benefit CAM professionals with interest in exploring new medical therapies and procedures [28].
Those operating at locations offering multiple CAM functions within the same office/building also enjoy scale advantages; yet, the nature of these benefits may vary with the mix of CAM professionals on site. Three scenarios are possible. First, multiple CAM practitioners offering distinct services and choosing to share office space (or at least be in the same building) means that localization advantages in particular must be occurring. Perhaps the CAM practitioners keep costs down by sharing administrative staff and medical equipment and enhance their expertise by gaining knowledge through collegial exchanges with professionals ‘they see every day’ [11,15]. Another consideration relates to the reality that most CAM patients pay for services ‘out of pocket’, since CAM is not covered by government health plans in Ontario and rarely completely included in employee health benefit packages [17]. As a result, patrons of CAM tend to be more affluent and in essence ‘need be shared’ by CAM providers. This leads to an important realization: if a goal is to maximize the revenues of an entire CAM office (and not just the individual health care providers within), then geographic proximity enhances the ability to share the pool of affluent clients. Referrals and recommendations to ‘in-house’ colleagues can be made and scheduling devised for synchronized consultation/treatment to maximize customer convenience and increase revenues of the office. A patient might be encouraged to receive a chiropractic adjustment directly after a naturopathic consultation, for example. Second, even in a situation with overlap in the same function, which occurs with some regularity in these 14 cities, direct CAM competitors (three massage therapists in the same building, for example) must still benefit from urbanization and/or localization economies. This would be like fast food establishments that routinely concentrate in space with direct competitors to benefit from urbanization economies advantages such as customer volume and visibility [29]. Of course, in terms of health care, three massage therapists at the same address might benefit from sharing office infrastructure as well. Third, if the multifunction location occurs exclusively because a single CAM professional delivers several CAM services, the scale advantages are largely internal to the CAM operator (and not just specifically external to an entire cluster of professionals), but still significant. Holding constant quality of care and reputation, CAM practitioners who render multiple functions may be more marketable and perhaps more profitable than those offering only one. For example, consider a chiropractor who also has proficiency in massage therapy and acupuncture. This CAM provider not only can attract new clients beyond those seeking chiropractic adjustments, but might also prolong an established client’s treatment regime with a range of techniques to address a chronic or stubborn health concern.
There are two forms of single function CAM locations. The first involves practitioners within HDCFCs and, while not office sharing with other professionals or skilled in multiple CAM techniques, these practitioners are still proximate to many other CAM functions by being within an area of the city very dense in CAM service. Presumably, these CAM operators benefit from the aforementioned localization and urbanization advantages accruing in HDCFCs. The second category of single function CAM location is comprised of practitioners outside of HDCFCs and while this represents only 27.1% of all CAM function, this subset of CAM operators appear to be least affected by agglomeration advantage. Given the comparative proximity to potential patients, it is predictable that many of these practitioners practice throughout the city, perhaps from their place of residence. Cultivating a soothing environment in which to apply treatment is a goal of many CAM providers. Such a situation might be easier to achieve in an office/house setting situated more peripherally than in a busy part of downtown in a sterile building. Locating outside of HDCFCs in more outlying locations may also result in reduced rent costs, particularly if office space allocation is part of the residence. In addition, an efficacious and trustworthy reputation may offset the need for multiple functions and a central location that is more visible [17].
CONCLUSION AND FUTURE STUDY
In conventional medicine, health teams are common and geography would appear to be biasing location decisions. Walk-in clinics typically have several MDs on site and medical centers often feature many doctors, specialists, pharmacies, lab facilities, medical technicians and other health care functions within one building or in very close proximity. The evidence from this research shows that similar trends occur with CAM function. Aside from a subset of single function CAM located outside of HDCFCs, most of the CAM functions (72.9%) cluster in space, which, by deduction, accrues various agglomeration economies advantages to patients and professionals. One might speculate that government bodies and the like design the majority of CM service concentrations in an apriority fashion; whereas CAM function clusters develop more organically and incrementally as certain CAM practitioners eventually discover the advantages of agglomeration economies. More research on the process of medical concentration formation would be instructive.
The principal finding of CAM concentration remains predominantly robust regionally and by type, but some important irregularities do occur. For instance, patients travelling to CAM function in northern communities cover greater distance than those in the southern part of the province. Moreover, naturopathic and massage functions are at opposite ends of the spectrum in terms of HDCFC membership and single function propensity. Subsequent study could assess travel distances to other consumer services, along with CAM function, and determine if ‘north/south’ differences are typical of commercial activity in general or CAM function specific. It would also be informative to more completely evaluate why there is a greater tendency for massage therapists to be ‘lone wolfs’ and for naturopaths to be more strongly inclined to offer their services in close proximity to other CAM functions. As with uncovering how medical concentrations in general evolve, supplementary research regarding the location motivations of naturopath, massage and other CAM function would benefit from interview/questionnaire based data and some form of qualitative analysis.
While the emphasis of this paper was on the geographic properties of CAM function and not on clinical efficacy, future research could consider potential relationships between space and CAM treatment outcomes. One might evaluate if the successful utilization of particular CAM procedures or remedies are consistent over space or if spatial bias occurs. While Meyer established that acupuncture offices are more abundant in parts of Toronto with a high proportion of Chinese and Southeast Asian residents, other spatial cultural aspects could be explored in terms of CAM effectiveness [28]. In addition, CAM efficacy and/or office location preferences could also be studied in light of income characteristics of neighborhoods within cities. Inevitably, when assessing CAM effectiveness, specialized datasets would need to be collected from a sample of CAM providers and CAM patients.
REFERENCES
- Wardle J, Adams J, Magalhaes RJ, Sibbritt D (2011) Distribution of Complementary and Alternative Medicine (CAM) providers in rural New South Wales, Australia: a step towards explaining high CAM use in rural health? Aust J Rural Health 19: 197-204.
- Egan B, Gage H, Hood J, Poole K, McDowell C, et al. (2012) Availability of complementary and alternative medicine for people with cancer in the British National Health Service: results of a national survey. Complement Ther Clin Pract 18: 75-80.
- Verheij RA, De Bakker DH, Groenewgen PP (1999) Is there a geography of alternative medical treatment in The Netherlands? Health Place 5: 83-97.
- Smith M, Carber L (2002) Chiropractic health care in health professional shortage areas in the United States. Am J Public Health 92: 2001-2009.
- Albert DP, Butar FB (2004) Distribution, concentration and health care implications of naturopathic physicians in the United States. Complement Health Pract Rev 9: 103-117.
- Sanders LJ, Aguilar GD, Bacon CJ (2013) A spatial analysis of the geographic distribution of musculoskeletal and general practice healthcare clinics in Auckland, New Zealand. Appl Geogr 44: 69-78.
- Hughes BM (2006) Regional patterns of religious affiliation and availability of complementary and alternative medicine. J Relig Health 45: 549-557.
- Williams AM (2000) The diffusion of alternative health care: a Canadian case study of chiropractic and naturopathic practices. Can Geogr 44: 152-166.
- Albert DP, Butar FB (2004) Diffusion of naturopathic state licensing in the United States and Canada. Compl Health Pract Rev 9: 193-207.
- Albert D (2009) New York and Colorado as Critical States in the Diffusion of State Licensing of Naturopathic Physicians. Compl Health Pract Rev 14: 59-69.
- Meyer SP (2008) The Spatial Pattern of Complementary and Alternative Medical Offices Across Ontario and Within Intermediate-Sized Metropolitan Areas. Urban Geogr 29: 662-682.
- Meyer SP (2010) A geographic assessment of ‘total’ health care supply in Ontario: complementary and alternative medicine and conventional medicine. Can Geogr 54: 104-122.
- Meyer SP (2011) A spatial analysis of acupuncture practitioners in Ontario, Canada: assessing regional and intra-metropolitan trends. In: Marcelo Saad (ed.). Acupuncture - Concepts and Physiology. INTECH, Rijeka, Croatia.
- Meyer SP (2012) Comparing spatial accessibility to conventional medicine and complementary and alternative medicine in Ontario, Canada. Health Place 18: 305-314.
- Meyer SP (2012) Place-Specific Explanations for the Geographic Patterns of Complementary and Alternative Practitioners: Contrasting Chiropractic, Massage, Holistic, Acupuncture, Naturopathic and Homeopathic Operations in Ontario. Int J Bus Soc Sci 3: 24-39.
- Meyer SP (2013) Evaluating the geography and the visibility tendencies of acupuncture treatment locations in metropolitan Toronto. In: Chen LL, Cheng TO (eds.). Acupuncture in Modern Medicine. InTech, Rijeka, Croatia.
- Meyer SP, Kieswetter A (2016) Naturopathic doctor offices in Ontario, Canada: the relevance of visible locations and patient proximity. In: Paul Cherniack, Tass Holmes (eds.). Alternative Medicine: Perceptions, Uses and Benefits and Clinical Implications. Nova Biomedicial, NY, USA.
- Meyer SP (2017) Naturopaths in Ontario, Canada: geographic patterns in intermediately-sized metropolitan areas and integration implications. J Complement Integr Med 14.
- http://www5.statcan.gc.ca/olc-cel/olc.action?objId=92-150-G&objType=2&lang=en&limit=0
- http://www12.statcan.gc.ca/census-recensement/2011/dp-pd/tbt-tt/Index-eng.cfm
- CanadaOne (2014) Canadian Business Directory. Info Canada, Mississauga, Canada.
- http://www.yellowpage.ca/
- Statistics Canada (2011) Census - Boundary Files. Statistics Canada, Canada.
- Statistics Canada (2011) Census - Road Network Files. Statistics Canada, Canada.
- ESRI (2012) ArcGIS Version 10.1. Environmental Systems Research Institute, Redlands, San Bernardino, USA.
- Ebdon D (1985) Statistics in Geography, (2ndedn), Basil Blackwell Ltd, Oxford, UK.
- IBM SPSS Statistics (2011) SPSS Version 20.0. IBM, Armonk, USA.
- Branzanti C (2015) Creative clusters and district economies; towards a taxonomy to interpret the phenomenon. Eur Plan Stud 23: 1401-1418.
- McCann BT, Folta TB (2008) Location matters: where we have been and where we might go in agglomeration research. J Manage 34: 531-565.
Citation: Meyer SP (2017) Complementary and Alternative Medicine (CAM): Single, Multiple and High-Density Function Locations in Intermediately Sized Centers in Ontario, Canada. J Altern Complement Integr Med 3: 027.
Copyright: © 2017 Stephen P Meyer, et al. This is an open-access article distributed under the terms of the Creative Commons Attribution License, which permits unrestricted use, distribution, and reproduction in any medium, provided the original author and source are credited.