Malnutrition in Japan is Threatening Longevity in the Future
*Corresponding Author(s):
Hiroshi ShibataInstitute For Gerontology, J.F Oberlin University, Tokyo, Japan
Tel:+81 81427979774,
Email:shibata-ild@nifty.com
Abstract
Objective: The average life expectancy in Japan became similar to that in developed Western countries in 1980s. However, the nutritional status of Japanese individuals has continuously deteriorated since. This study evaluated these phenomena using the Japanese time-sequential data and worldwide cross-cultural data.
Methods: Japanese trends data of total energy, protein, fat and carbohydrate intake were derived from Japanese National Nutrition Surveys between 1950 and 2014. Total energy intake according to sex and age was also analyzed using these same databases. Trends in average birth weight and the rate of low birth weight (<2,500g) were calculated from Japanese Vital Statistics between 1951 and 2015. A cross-cultural comparison regarding trends of total energy supply (Food Balance Sheets) was made using the 2013 Food and Agriculture Organization (FAO) database between 1992 and 2011. The rates of high (≥30) and low Body Mass Index (BMI) (<18.5) were compared among selected countries based on the WHO Global Database on Body Mass Index (1 November 2016).
Results: The total energy intake of Japanese individuals increased until 1970, from which time it decreased progressively. Concordantly, the trend in the decrement of average birth weight and the marked increase of low birth weight (<2,500g) were observed since 1975. The total energy intake remained unchanged only among individuals aged ≥70 years, although it declined in other age groups over the past two decades. The total energy supply between 1992 and 2011 more or less increased worldwide. However, it declined only in Japan. Cross-cultural data revealed that there was a low proportion of Japanese individuals with high BMI (≥30) and a high rate with low BMI (<18.5) as commonly found in developing countries.
Conclusion: The present Japanese longevity is a result of the low age-adjusted mortality among individuals aged ≥70 years. The optimistic perspective for longevity in the future should be viewed taking into consideration the deleterious effect on nutritional status in younger generations and low birth weight.
Keywords
INTRODUCTION
In the past, Japan had an extremely short average life expectancy compared with developed western countries. Several developed western countries surpassed the average life expectancy of 50 years during the end of the 19th century and beginning of the 20th century [1]. However, the Japanese average life expectancy of 50 years of age remained unchanged during the late 1930s. It was in 1947, after the Second World War, that the average life expectancy of Japanese individuals of both sexes reached 50 years, lagging approximately half a century compared to developed western countries.
This short life expectancy was largely attributed to malnutrition, mainly owing to scant animal protein intake [2,3]. During that time, one of the major causes of death was inflammatory diseases. However, the decline of mortality for these diseases led to the prolongation of the life expectancy in developed western countries [4]. The mortality caused by inflammatory diseases is closely related to the intake of a certain level of animal protein. The higher the intake of meat, the earlier the country reaches average life expectancy of 50 years, as observed in Australia, New Zealand, United States and Sweden [1]. Intake of meat in Japan was below one-third compared to that in Australia. On average, Japanese consumed only 3g of animal protein a day, representing 5% of the total daily protein intake. Thus, this nutritional state was unlikely to translate into a lower mortality by inflammatory diseases. Until 1950, the leading cause of death in Japan was Tuberculosis according to Japanese Vital Statistics.
Since the Second World War, the average life expectancy in Japan has extraordinarily increased and this is mainly attributed to the improvement of the nutritional status associated with the country’s economic growth. In mid-1970s, Japanese life expectancy reached that in developed western countries shortly after the Second World War. This progression brought about the notion that Japanese cuisine is healthy. In 2013, Japanese Cuisine “Washoku†was included in the UNESCO World Cultural Heritage list. This furthered the optimistic view of quite a few investigators and decision makers regarding longevity and health status in Japan. However, the fact is that Japan has faced malnutrition over the past three decades. The literature has shown the association between nutritional states and longevity, as well as health status, among middle-aged Japanese individuals [5-10). Moreover, the nutritional concerns have been recently raised in younger generations, including children [11-16]. The present study aimed to provide evidence of malnutrition, especially in younger generations in Japan and to identify feasible causes.
METHODS
In order to evaluate nutritional states in Japan, two types of data were considered necessary: time-sequential data and cross-cultural data. For time-sequential data, Japanese National Nutrition Surveys and Japanese Vital Statistics were used. The Japanese National Nutrition Surveys were undertaken by the General Headquarters’ advice for the surveillance of Japanese nutritional status after Second World War in 1946. Since then, the survey is carried out yearly. In 1995, for the first time, the data were launched according to age groups. In the present study, trends of total energy intake and the three major nutrient components were observed between 1950 and 2014. During the same period, trends of birth weight and rates of low birth weight (<2,500g) were derived from the Japanese Vital Statistics.
Trends of total energy intake, according to age group and sex, were calculated for 1995, 2008 and 2014 (latest). Additionally, we investigated the data in 2008. It was possible that health check-ups for detecting so-called “Metabolic Syndrome†might deteriorate the pattern of nutrient intake among middle-aged and elderly individuals who were mostly still part of the workforce. Health insurance associations are obliged to undertake the health check-ups every year. In 2008, the Japanese Government warned every health insurance association that a penalty would be imposed if the rate of respondents to the health check-ups did not reach 50%. All Japanese workers and employees belong to a health insurance association of some kind. The trend by age and sex for the proportion of the BMI classification defined by the Japan Society for the Study of Obesity was observed in the sample for Japanese National Nutrition Survey since 1995.
Cross-cultural data were obtained from food supply data based on Food Balance Sheets by the Food and Agricultural Organization of the United Nations (1992-2011). Total energy supply was compared between Japan and other Geographic Regions worldwide. Cross-cultural comparisons concerning rates of high Body Mass Index (BMI) (≥30.0) and low BMI (<18.5) were made using the World Health Organization Database on BMI (updated 2016-11-1).
RESULTS
Table 1 shows trends in total energy intake and the three major components per capita per day from 1950 to 2014. Japan was defeated in the Second World War in 1946; thus, data from the Japanese National Nutrition Surveys are available also between 1946 and 1949. In light of the extraordinary impact on Japanese nutritional status brought by the defeat in 1946, those data were not shown here. However, it was considered to be worth stressing that the latest average energy intake of 1,863kcal in 2016 became lower than that of 1,903kcal in 1946. Japanese average energy intake increased until 1970, reaching 2,210kcal; since then, it has been decreasing, as shown in table 1. Figure 1 indicates the trends of average birth weight and rates of low birth weight (>2,500g) in Japan over the past of six decades. It is of interest that, in accordance with the increment of the average energy intake (Table 1), average birth weight increased with decreasing rates of low birth weight. However, the latest data revealed the lowest average birth weight and highest rate of low birth weight in 2015 since data collection began in 1951. Table 2 reveals the trends of total energy intake by sex and age groups from 1995 and on, when the data by age groups was launched. Numbers in parenthesis show percentages, considering the intake in 1995 as 100%. In both sexes, the total energy intake tended to decrease in all age groups, with the exception of those aged ≥70 years, despite the fact that only in this age group average ages increased yearly because there was no upper limit set in this age group. The impact of the policy enhancing health-check-ups on energy intakes was uncertain. As shown in table 3, BMI tended to decline in all age groups for both sexes with in the aged 70 years and over, which finding was in accordance with the trends for total energy intake (Table 3).
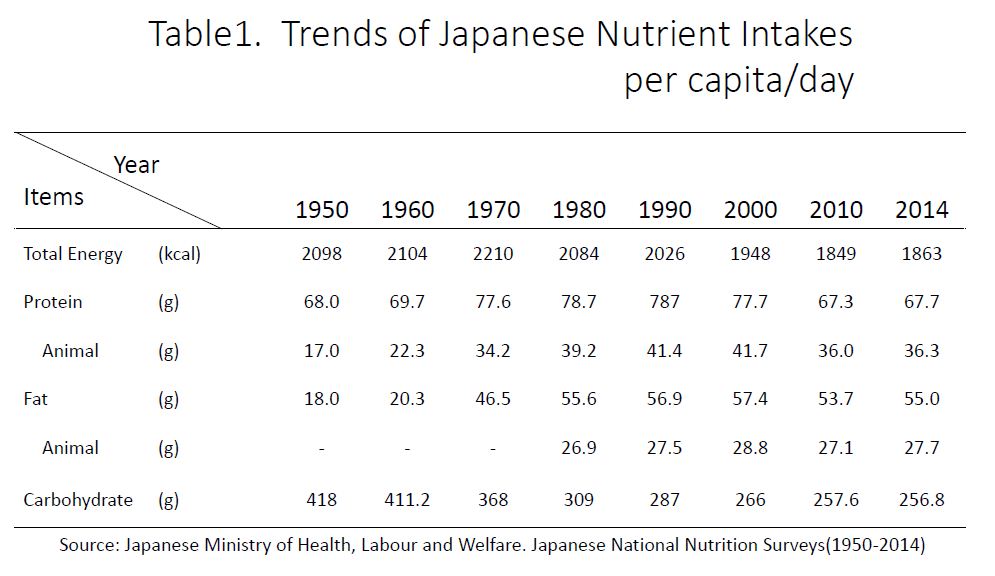
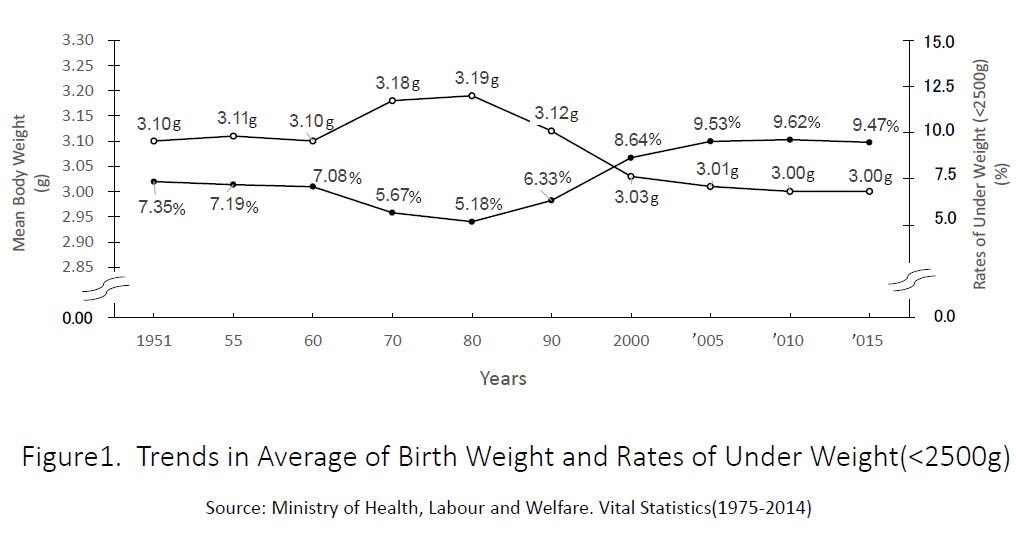
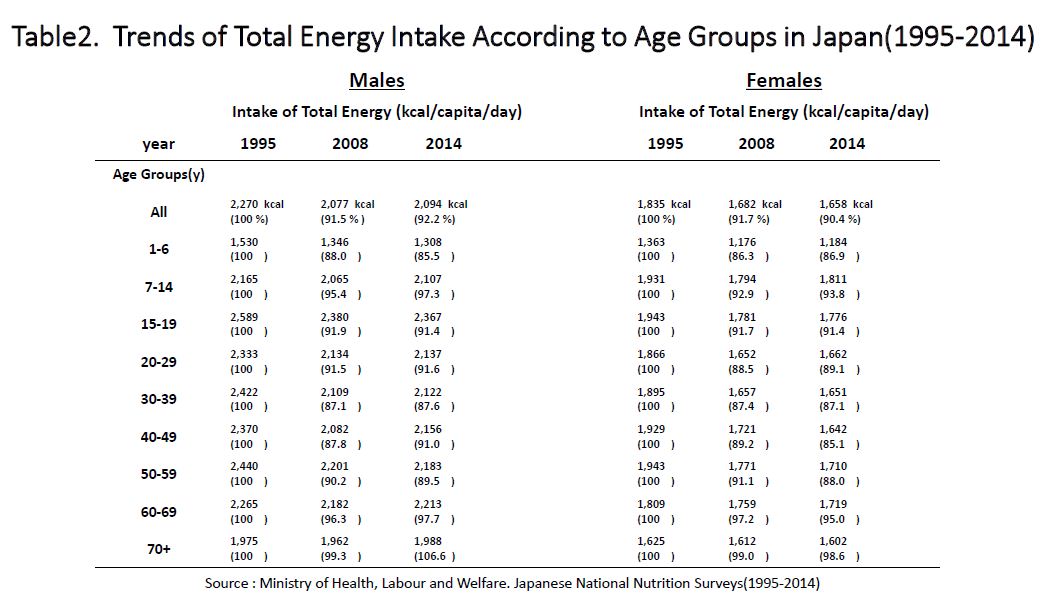
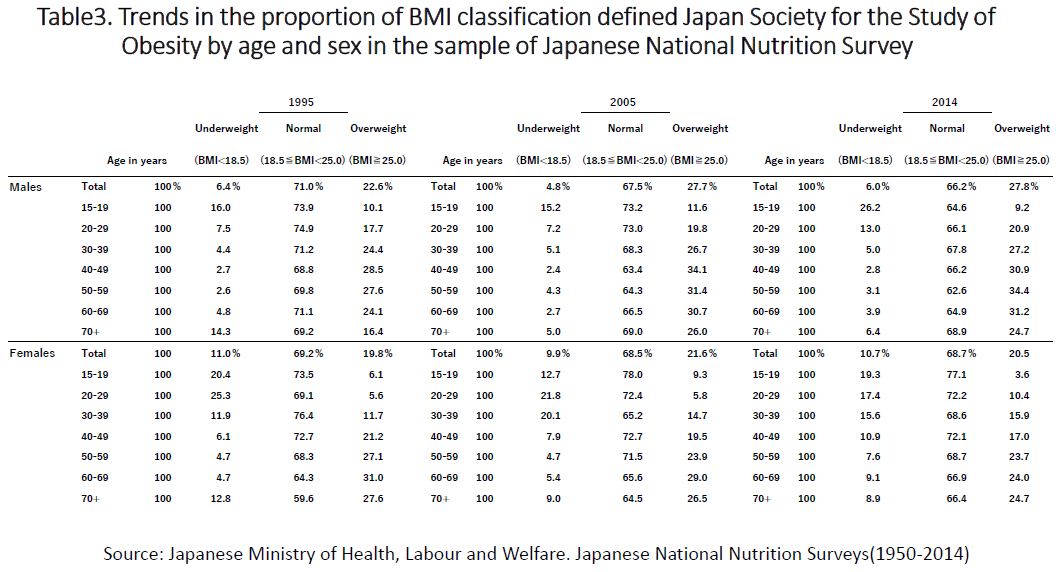
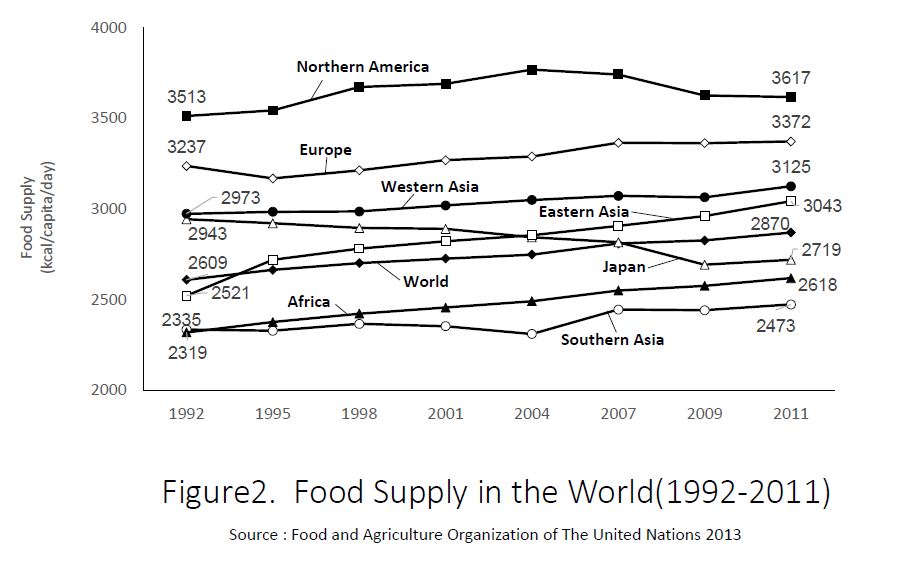
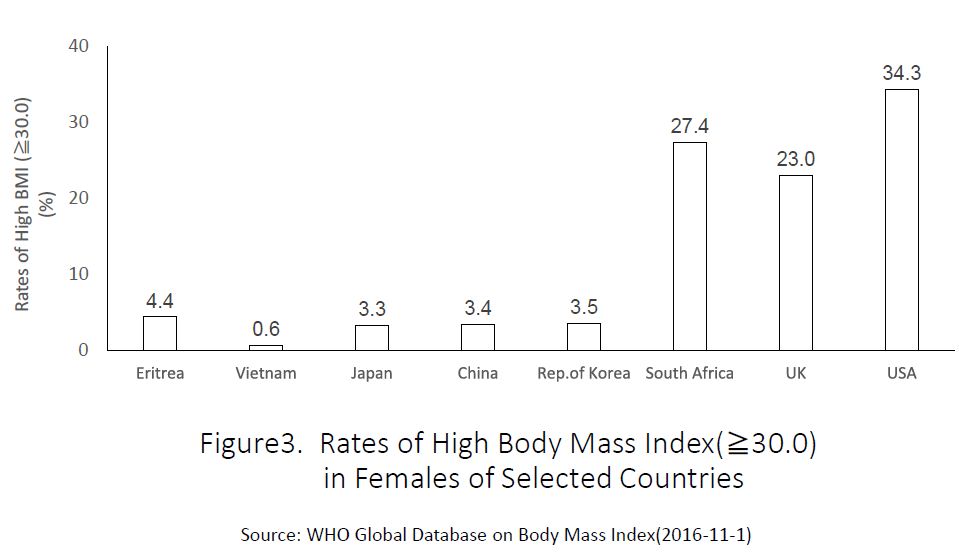
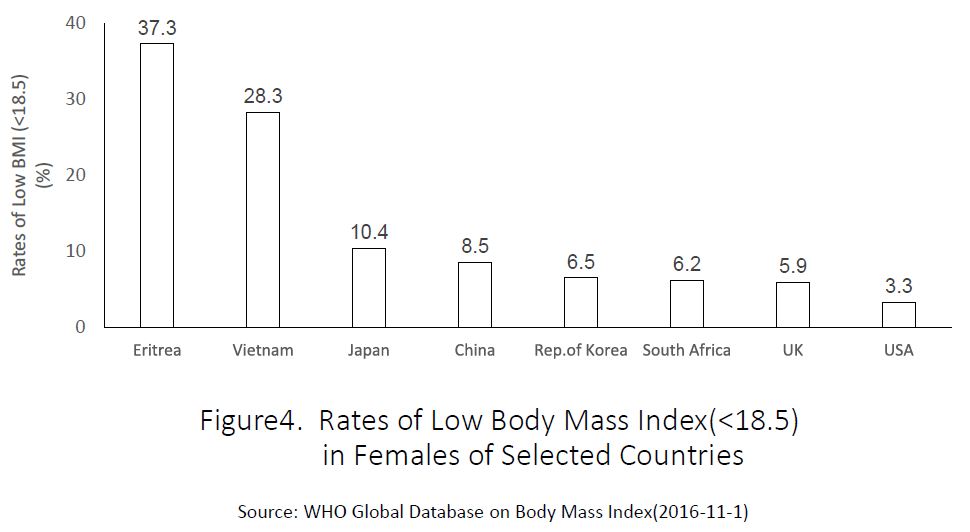
Figure 2 compares the trends of total energy supply based on Food Balance Sheets in each geographic area and Japan between 1992 and 2011. In all areas, energy supply trended to increase, although the degree of increment was greater in developing areas (e.g., Eastern Asia and Africa) and lower in developed areas (e.g., Northern America and Europe). However, Japan showed a marked declining trend in total energy supply over the past two decades. The present trend was in accordance with that of the intake data investigated by Japanese National Nutrition Surveys. The findings indicated about a 30% lower total energy supply as the supply data included uneaten and discarded foods. The rate of high BMI (≥30) in the selected countries is shown in figure 3. The rate in the USA is known to be the highest in the world. The rate in Japan was low compared to that commonly observed in developing countries. In contrast to high BMI, low BMI (<18.5) was more common in developing countries. The rate of low BMI in Japan was close to those in developing countries rather than to those in developed countries (Figure 4). Recent rates of low BMI (<18.5) in Japanese women showed increasing trends and were the highest in the world compared with the rates commonly found in developing countries with extremely low GDP (e.g., Africa), although these data are not shown here. Thus, both domestic time-sequential and cross-cultural data showed that the nutritional status in Japan has worsened over the past four decades.
DISCUSSION
Human beings are considered to have the genetic capacity to live up to 100 years. However, it was a little more than a century ago that nations achieved average life expectancies of 50 years of age. Developed Western Countries achieved this longevity at the end of the 19th century and beginning of the 20thcentury [1,4]. The present longevity is considered to be largely owing to improvement of the nutritional status brought by the industrial revolution, which contributed to improved breeding and mass production of domestic animals.
Japan lagged behind for almost half a century compared with developed western countries in reaching an average life expectancy of 50 years [1-4]. The lag resulted from the delay in the improvement of nutritional status that was more commonly observed in most developing countries. The practice of Buddhist beliefs, which discourage the consumption of animal foods other than seafood, is partly attributable for such poor nutritional status [6]. However, the lag in attaining an equivalent longevity paradoxically made Japan a good sample for identifying factors related with longevity. Japanese longevity started to increase in the mid-20th century and reached the level of that of developed western countries within 40 years. During that time, epidemiological methods and indicators such as the BMI, serum cholesterol, and serum albumin were developed and improved for their application in epidemiological studies of longevity, as well as that of non inflammatory diseases (17,18].
Both inter-and intra-population studies carried out for the Japanese elderly revealed that poor nutritional status was deleterious for longevity [2,3,5,6,10]. Shibata et al., compared food and nutrient intake in the individuals aged 65 years between Ōgimi Village, Okinawa Prefecture (well-known for the longevity of its residents), Nangai Village and Akita Prefecture (well-known for the extremely short life expectancy of its residents) [6]. Intake of animal protein, fat and calcium were significantly higher in Ōgimi Village than in Nangai Village. Both serum cholesterol and serum albumin in the 1980s were maintained at the same level as in the 1970s in Ōgimi Village, whereas the levels in the 1980s were much lower than in the 1970s in Nangai Village [6]. The food intake pattern in Okinawa has been unique compared to that of Japan in general. People in Okinawa do not practice Buddhist beliefs and, therefore, are not stigmatized for eating animal food other than seafood [6]. Buddhist belief was introduced to Japan, through China and Korea in A.D. 538, and several emperors in succession after this time prohibited killing mammals. Therefore, domestic animals were not raised for food. However, Okinawa did not belong to Japan at that time. Therefore, it was free of Buddhist beliefs and the emperor’s policy. Therefore, until the 1980s, the average life expectancy in Okinawa was the highest compared to all the prefectures in Japan. However, the ranking in Okinawa has continued to drop ever since. This trend is attributed to a more marked decline in total energy intake, protein and fat in Okinawa than in the other prefectures, based on the health stereotypes associated with the higher health risks of high fat intake.
Intra-population studies also showed that poor nutritional status, expressed in low BMI, low serum cholesterol and low serum albumin, as well as undesirable food intake, were risk factors for early death [5,6,8,19,20]. Poor nutritional status not only shortens life expectancy but it also deteriorates the functional capacity, cognitive function, and subjective well-being, categorized as quality of life in the elderly [2,21,22]. A previous study assessed a nutritional intervention for the elderly living in the community. In that trial, improvement of food intake was achieved in a 4-year period and both blood hemoglobin and serum albumin increased [23]. Poor nutritional status has been described as a causative factor not only for inflammatory diseases but also for cerebrovascular diseases [9,18]. In Japan, cerebrovascular diseases were the leading cause of death between 1956 and 1980, time during which the Japanese nutritional status improved. In 1965, the intake of meat and dairy products began to increase while the intake of rice tended to decrease. In accordance with the above change of food intake, the mortality secondary to cerebrovascular diseases continued to decrease. The ratio of animal protein to total protein consumed daily reached 50% in 1979 for the first time in the Japanese history [2,3]. In 1981, cerebrovascular diseases became the second leading cause of death along with malignancy [2].
Interestingly, the mortality and incidence of coronary heart diseases were higher in those with low serum albumin among community residents aged ≥71 years [24]. The elderly in the United States, though often prejudiced as being overnourished, are not entirely free from malnutrition. In fact, malnutrition commonly affects the elderly in most countries. It is noteworthy, however, that the nutritional status has not worsened with the exception of the oldest age group in Japan over time (Table 2).
The cause of worsened nutritional status in the younger age groups (Table 2) cannot be easily established because the factors involved are complex. The present authors assume that the cause differs between the middle-aged, old-aged and younger-aged groups. We consider that the creation of the committee for determining the criteria for the so-called “Metabolic Syndrome†in 2004 is responsible for accelerating malnutrition in the middle-aged and early old-aged groups. This committee completely neglected results of epidemiologic studies [19]. At that time, most epidemiologic data showed that BMI was related to mortality in reverse J shape fashion, with the lowest mortality among those with BMI ranging between 23 and 27. However, the committee proposed the ideal BMI as 22. This is the reason why the association between BMI and other variables for screening “Metabolic Syndrome†using intra abdominal visceral area measured by computed tomography scan was evaluated [25]. It was stated that those with a BMI of 22 had less abnormalities. However, it is our personal opinion that the findings of this paper are completely incorrect. Despite dealing with a sample with a wide age range (between 18 and 84 years), data were analyzed without adjusting for age or categorizing the subjects by age groups. The apparent best BMI being 22 is a result confounded by age. Furthermore, this paper failed to prove the hypothesis according to which the number of abnormal findings increased with the size of the fat area. Very few investigators have officially criticized this paper, including the present authors. This may be a reflection of the current situation in the field of health policies in current Japanese Society.
A thin body (low BMI) is preferred among young women worldwide, including Asian countries [12,26-29]. However, the action for lowering food intake to attain such an ideal thin body is likely to be most pronounced among Japanese women. The pattern of nutrient intake in younger women influences birth weight and food intake of children, especially those aged 1 to 6 years, who are yet to eat the food provided at school. These findings were shown in the present study. Over the past two decades, the field of epigenetics has shown that reduced fetal growth is a verified risk factor for several intrinsic diseases [30,31]. Malnutrition in younger age groups does not instantly lower average life expectancy because in Japan the number of deaths of individuals aged ≥70 years accounts for 82% of all deaths. As shown in the present study, the nutritional status of those aged ≥70 years has not worsened over time. There is a yearly prolongation of the average life expectancy in Japan.
Thus, Japan is highly ranked in the world in terms of longevity; this is mostly because of the yearly decrease of age-adjusted mortality in older age groups. However, we cannot have an optimistic perspective with regard to average life expectancy in the future based on the present nutritional status of the younger age groups entering middle-and old-age. Ando S and Osada H investigated the different image among Japanese individuals with a wide age range (from 18 to 84 years). In the younger age groups, dissatisfaction with thin bodies was common and there was a higher consciousness of appearance [32]. However, with advancing age, concern with appearance declined and the oldest age group was more conscious of health and functioning than younger age groups. Are the present young women directing toward similar preferences to those of present old women?
ACKNOWLEDGMENTS
The authors deeply appreciate the cooperation of Professor Watanabe S. MD, PHD, Graduate School of Gerontology J. F, Oberlin University, Ogami S. Senior Advisor, International Longevity Center (Japan) and Itani A, MA.
REFERENCES
- Svanborg A, Shibata H, Hatano S, Matsuzaki T (1985) Comparison of ecology, ageing and state of health in Japan and Sweden, the present and previous leaders in longevity. Acta Med Scand 218: 5-17.
- Shibata H (2001) Nutritional factors on longevity and quality of life in Japan. J Nutr Health Aging 5: 97-102.
- Shibata H, Kumagai S (2002) Nutrition and longevity. Reviews in Clinical Gerontology 12: 97-107.
- Livi-Bacci M (2012) A Consice History of World Population (5thedn), Wiley-Blackwell, Oxford, UK.
- Shibata H, Haga H, Ueno M, Nagai H, Yasumura S, et al. (1991) Longitudinal changes of serum albumin in elderly people living in the community. Age Ageing 20: 417-420.
- Shibata H, Nagai H, Haga H, Yasumura S, Suzuki T, et al. (1992) Nutrition for the Japanese elderly. Nutr Health 8: 165-175.
- Shibata H, Kumagai H, Watanabe H, Suzuki A, Yasumura S, et al. (1995) Relationship of Serum Lipids to 10-year Deaths from All Causes and Cancer in Japanese Urban Dwellers Aged 40 Years and Over. J Epidemiol 5: 87-94.
- Shibata H, Haga H, Nagai H, Suyama Y, Yasumura S, et al. (1992) Predictors of all-cause mortality between ages 70 and 80: the Koganei study. Arch Gerontol Geriatr 14: 283-297.
- Iso H, Sato S, Kitamura A, Naito Y, Shimamoto T, et al. (2003) Fat and protein intakes and risk of intraparenchymal hemorrhage among middle-aged Japanese. Am J Epidemiol 157: 32-39.
- Murayama H, Liang J, Bennett JM, Shaw BA, Botoseneanu A, et al. (2015) Trajectories of Body Mass Index and Their Associations With Mortality Among Older Japanese: Do They Differ From Those of Western Populations? Am J Epidemiol 182: 597-605.
- Taniguchi Y, Shinkai S, Nishi M, Murayama H, Nofuji Y, et al (2014) Nutritional Biomarkers and subsequent cognitive decline among community-dwelling older Japanese: A prospective Study. J Gerontol A Biol Sci Med Sci 69: 1276-1283.
- Shih MY, Kubo C (2005) Body shape preference and body satisfaction of Taiwanese and Japanese female college students. Psychiatry Res 133: 263-271.
- Smith AR, Joiner TE (2008) Examining body image discrepancies and perceived weight status in adult Japanese women. Eat Behav 9: 513-515.
- Yachi Y, Tanaka Y, Nishibata I, Sugawara A, Kodama S, et al. (2013) Low BMI at age 20 years predicts gestational diabetes independent of BMI in early pregnancy in Japan: Tanaka Women's Clinic Study. Diabet Med 30: 70-73.
- Ohmi K, Marui E (2011) [Estimation of the excess death associated with influenza pandemics and epidemics in Japan after world war II: relation with pandemics and the vaccination system]. Nihon Koshu Eisei Zasshi 58: 867-878.
- Sugawara A, Sato M, Totsuka K, Saito K, Kodama S, et al. (2011) Factors associated with inappropriate weight loss attempts by early adolescent girls in Japan. Eat Weight Disord 16: 157-163.
- Shibata H, Suzuki T, Shimonaka Y (1997) Longitudinal Interdisciplinary study on Aging. Serdi Publisher, Paris, France.
- Jacobs D, Blackburn H, Higgins M, Reed D, Iso H, et al. (1992) Report of the Conference on Low Blood Cholesterol: Mortality Associations. Circulation 86: 1046-1060.
- Sasazuki S, Inoue M, Tsuji I, Sugawara Y, Tamakoshi A, et al. (2011) Body mass index and mortality from all causes and major causes in Japanese: results of a pooled analysis of 7 large-scale cohort studies. J Epidemiol 21: 417-430.
- Nagai M, Kuriyama S, Kakizaki M, Ohmori-Matsuda K, Sugawara Y, et al. (2010) Effect of age on the association between body mass index and all-cause mortality: the Ohsaki cohort study. J Epidemiol 20: 398-407.
- Shibata H, Watanabe S, Kumagai S, Haga H (1996) Health problems in aging populations. J Epidemiol 6: 71-78.
- Shibata H, Kumagai S, Watanabe S, Suzuki T (1999) Relationship of serum cholesterols and vitamin E to depressive status in the elderly. J Epidemiol 9: 261-267.
- Kumagai S, Watanabe S, Shibata H, Amano H, Hujiwara Y, et al (2003) An intervention study to improve the nutritional status of functionally competent community-living senior citizens. Geriatrics & Gerontology International 3: 21-26.
- Corti MC, Salive ME, Guralnik JM (1996) Serum Albumin and Physical Function as predictors of coronary heart disease Mortality and Incidence in older Persons. J Clin Epidemiol 49: 519-526.
- Examination Committee of Criteria for 'Obesity Disease' in Japan; Japan Society for the Study of Obesity (2002) New criteria for 'obesity disease' in Japan. Circ J 66: 987-992.
- Fitzgibbon ML, Blackman LR, Avellone ME (2000) The relationship between body image discrepancy and body mass index across ethnic groups. Obes Res 8: 582-589.
- Sano A, Le DS, Tran MH, Pham HT, Kaneda M, et al. (2008) Study on factors of body image in Japanese and Vietnamese adolescents. J Nutr Sci Vitaminol (Tokyo) 54: 169-175.
- Takimoto H, Yoshiike N, Kaneda F, Yoshita K (2004) Thinness among young Japanese women. Am J Public Health 94: 1592-1595.
- Yates A, Edman J, Aruguete M (2004) Ethnic differences in BMI and body/self-dissatisfaction among Whites, Asian subgroups, Pacific Islanders, and African-Americans. J Adolesc Health 34: 300-307.
- Barker DJ, Hales CN, Fall CH, Osmond C, Phipps K, et al. (1993) Type 2 (non-insulin-dependent) diabetes mellitus, hypertension and hyperlipidaemia (syndrome X): relation to reduced fetal growth. Diabetologia 36: 62-67.
- Barker DJ (1995) Fetal origins of coronary heart disease. BMJ 311: 171-174.
- Ando S, Osada H (2009) Age and gender differences in body image over the life span: Relationships between physical appearance, health and functioning. The Japanese Journal of Health Psychology 22: 1-16.
Citation: Shibata H, Shibata N (2017) Malnutrition in Japan is Threatening Longevity in the Future. J Gerontol Geriatr Med 3: 012.
Copyright: © 2017 Hiroshi Shibata, et al. This is an open-access article distributed under the terms of the Creative Commons Attribution License, which permits unrestricted use, distribution, and reproduction in any medium, provided the original author and source are credited.