What can we Expect of Cognition after 70? Cognitive Decline, Stability, and Gain between 70 and 79 Years in Three Swedish Birth Cohorts
*Corresponding Author(s):
Peter KarlssonDepartment Of Psychology, School Of Health And Welfare, University Of Gothenburg, Gothenburg, Halmstad, Sweden
Tel:+46 35167837,
Email:Peter.Karlsson@hh.se
Abstract
There is substantial heterogeneity in cognitive aging trajectories. Although the number of individuals showing cognitive decline increases with age, significant proportions remain stable or show gains. The aim of this study was to investigate birth cohort differences regarding proportions of individuals showing cognitive decline, stability, or gain between ages 70 and 79. We analyzed longitudinal data from three Swedish birth cohorts from the Gothenburg H70 Birth Cohort Studies, born 1901-02, 1906-07 and 1930, measured on four cognitive measures (i.e., verbal meaning, figure identification, logical reasoning and spatial ability). We used the standard error of measurement (SEM=s√(1-rxx) at baseline (i.e., 70 years of age) to categorize participants as showing cognitive decline (if scores decreased by >1 SEM between ages 70 and 79), cognitive stability (if change was ≤1SEM), or cognitive gain (if increasing by >1 SEM).
Analyses, using χ2- tests, showed that a substantial proportion remained stable over the 9-year period. Our findings also indicated significant cohort differences for all four cognitive measures, with weak to moderate effect sizes. Interestingly earlier born cohorts contained a higher proportion of participants showing cognitive gain and a smaller proportion showing cognitive decline, compared to later born cohorts. Possible explanations for these cohort differences may relate to cohort differences in cognitive reserve, selective survival and psychometric properties of the cognitive tests. These findings have implications for instance regarding the debate concerning postponing retirement age, and the use of cognitive tests in evaluations of for example work capability.
Keywords
INTRODUCTION
Aging is stereotypically often associated with universal cognitive decline [1]. A large body of research, however, demonstrates a substantial heterogeneity in cognitive aging trajectories [2-8] and Wilson et al., maintain that cognitive change in old age reflects factors that are specific to the individual rather than inevitable developmental processes [9]. Although the number of individuals showing cognitive decline increases with age, a significant proportion remain stable or may even show gains [1]. Schaie categorized participants of several age groups (i.e., 25-32, 32-39, 39-46, 46-53, 53-60, 60-67, 67-74, 74-81 and 81-88 years) from the Seattle longitudinal study as showing either cognitive decline, stability or gain, over a seven-year period [10]. Even though the proportion of participants showing cognitive gain or stability decreased in older age groups, and proportion showing decline increased, a significant proportion (≥ 55%) evinced cognitive stability and gain in all age groups, including the oldest.
Barnes et al., reported that 9% of the participants were cognitive maintainers, 58% minor decliners and 33% major decliners [2]. Yaffe et al., reported that thirty percent of their participants were categorized as maintainers, 53% as minor decliners and 16% as major decliners [8]. Cognitive aging is also a reflection of the historical context and the numerous life-course influences. In that context it is not surprising that many studies have shown that later born cohorts tend, on average, to perform better on several cognitive abilities which is often referred to as Flynn effects [11-18]. But, do these birth cohort differences manifest themselves also regarding proportions of individuals showing cognitive decline, stability, and gain? To the best of our knowledge there are no previous studies investigating possible birth cohort differences in heterogeneity of aging (i.e., cohort differences in the proportions of individuals showing cognitive decline, stability, or gain). Most studies investigating cohort differences in cognitive aging have addressed this question in more refined analyses of mean trends, rather than focusing on the straightforward question typically asked by older people themselves about the likelihood of stability and change in cognition in later life. Although mean trends analyses are informative and important, it is also important to focus on the heterogeneity of cognitive aging trajectories.
The aim of this study was to investigate proportions of individuals showing cognitive decline, stability, or gain between ages 70 and 79 years. A further aim was to study possible birth cohort differences in these proportions. For this purpose we analyzed data from three Swedish birth cohorts from the Gothenburg H70 Birth Cohort Studies, Sweden, born 1901-02, 1906-07 and 1930, with measurements at the same ages, 70 and 79, on four cognitive measures (i.e., verbal meaning, figure identification, logical reasoning and spatial ability). Using data from these three cohorts, we have previously reported findings indicating a steeper cognitive decline in later born cohorts [19,20]. For this reason our hypothesis is that there will be a higher proportion of decliners in later born cohorts.
DESIGN AND METHODS
Participants
|
|
|
Gender |
Measurement Occasions |
||
|
Cognitive Test |
N |
Women (%) |
Men (%) |
Age 70 M (SD) |
Age 79 M (S) |
|
Verbal Meaning |
|
||||
|
Cohort 1901-02 |
175 |
70.29 |
29.71 |
17.51 (6.37) |
17.53 (7.30) |
|
Cohort 1906-07 |
207 |
60.87 |
39.13 |
18.85 (6.35) |
16.64 (7.82) |
|
Cohort 1930 |
104 |
46.15 |
53.85 |
21.48 (5.26) |
21.36 (4.94) |
|
Total |
486 |
61.11 |
38.89 |
19.02 (6.29) |
19.39 (6.65) |
|
Logical Reasoninga |
|
||||
|
Cohort 1901-02 |
165 |
69.70 |
30.30 |
12.61 (4.60) |
12.41 (4.93) |
|
Cohort 1930 |
119 |
45.38 |
54.62 |
16.80 (4.60) |
14.49 (5.30) |
|
Total |
284 |
59.51 |
40.49 |
14.24 (5.03) |
13.93 (5.28) |
|
Spatial Ability |
|
||||
|
Cohort 1901-02 |
87 |
70.11 |
29.89 |
13.38 (6.64) |
11.73 (7.28) |
|
Cohort 1906-07 |
209 |
59.81 |
40.19 |
15.94 (6.90) |
11.57 (7.43) |
|
Cohort 1930 |
110 |
44.55 |
55.45 |
19.65 (6.83) |
15.74 (6.41) |
|
Total |
406 |
57.88 |
42.12 |
16.47 (7.19) |
13.84 (7.16) |
|
Perceptual Speed |
|
||||
|
Cohort 1901-02 |
81 |
71.60 |
28.40 |
16.45 (8.54) |
14.91 (6.81) |
|
Cohort 1906-07 |
206 |
59.71 |
40.29 |
19.51 (6.79) |
14.77 (7.50) |
|
Cohort 1930 |
127 |
45.67 |
54.33 |
25.79 (7.83) |
21.38 (7.04) |
|
Total |
414 |
57.73 |
42.27 |
20.69 (8.29) |
18.59 (7.80) |
Cohort 1906-07: This cohort was selected for inclusion in the H70 study, in the same manner as the first, in 1976-77. Twelve hundred and eighty-one participants, born between July 1, 1906- June 30, 1907 were selected and the response rate was 81% yielding another representative sample [23]. The participants in this cohort were given a number from 6-10, and participants with numbers 6 and 7 were selected for psychometric testing (n=513). For this subsample participation rate at age 70 was 75%. Attrition rate due to mortality was 26% from age 70-79, and attrition due to other reasons was 18%.
Cohort 1930: This cohort was selected for inclusion in the H70 study in the year 2000. Seven hundred and sixty-seven individuals born in 1930 on days 3, 6, 12, 18, 21, 24, or 30 of each month were sampled. The response rate was 71% at baseline. Comparisons of non-responders to responders yielded no significant differences regarding gender, marital status, 3-year mortality rate, inpatient psychiatric care [24] or specific diagnoses such as dementia or cardiovascular disorders [25]. Every second participant was randomly selected for psychometric testing (n=254), and the response rate for this subsample was 90% at age 70. Attrition rate due to mortality was 14% from age 70-79, and attrition due to other reasons was 31%.
Cognitive measures
Spatial ability was measured using a Swedish version of the Block Design test [28]. In this test participants are asked to organize colored wooden blocks in accordance with seven different patterns presented on cards (with increasing level of difficulty). The test has a 20 minute time limit and a maximum score of 42. Perceptual speed was measured with a Figure Identification test. Participants are asked to match, as fast as possible, a target figure with an identical figure placed in line with four distractor figures. The test has a time limit of 8 minutes and a maximum score of 60. These tests were administered in a similar manner for all three cohorts at the same ages, except that the Figure Logic test was omitted at ages 75 and 79 for the 1906-07 cohort. Therefore, data from the 1906-07 cohort, on the Figure Logic test, was omitted from the analyses. Further, for the 1901-02 cohort only half of the participants were given the perceptual speed and block design test at age 70. In order to minimize the risk of biasing influences of floor effects (due to factors such as dementia and other conditions producing a more severely compromised cognition) we omitted all participants with a score of zero (on either of the cognitive measures) at age 70, or a score of zero on both the 75- and 79-year measurements, from the analyses. In all, 60 participants were omitted from the analyses (25 from cohort 1901-02, 14 from cohort 1906-07, and 21 from cohort 1930).
Statistical Analyses
We also performed a sensitivity analysis to test the robustness of the results to the specific cut-off used to categorize participants as decliners, stable and gainers. Here we evaluated several alternative cut-offs. First we used SEM in the same manner as described above but setting the reliabilities to 0.80 and 0.70 when calculating SEM. Further, we used the standard deviations for the total sample at baseline, for each of the four cognitive measures, to categorize participants. Here we used both a change of >1 SD and >0.5 to categorize participants as showing decline or gain (otherwise showing stability). The results were largely the same no matter which cut-off we used. Therefore we have chosen to report only the results from the analyses using SEM based on the reliabilities reported in Dureman et al., [26].
RESULTS
The distributions of participants categorized as showing cognitive decline, stability or gain from age 70-79 are presented in table 2, stratified by cohort and cognitive measure. As expected, a substantial proportion showed decline from age 70 to 79, most pronounced in the perceptual speed test, i.e., 60-79%. A significant proportion, however, demonstrated stability or even improvements in all tests. This pattern is especially evident in the verbal meaning test where as many as 63 to 75% showed stable or improved performance. The Chi-Square tests indicated significant cohort differences in the distributions for all four cognitive measures, with weak to moderate effect sizes (for verbal meaning χ2 (4) = 11.28 p= 0.024, Cramer’s V= 0.11; logical reasoning χ2 (2) = 19.38 p= 0.000, Cramer’s V= 0.26; spatial ability χ2 (4) = 9.52 p = 0.049, Cramer’s V= 0.11; for perceptual speed χ2 (4) = 27.99 p = 0.000, Cramer’s V= 0.18).
Even though effect sizes are quite weak, a distinctive pattern, common to all four cognitive measures is apparent as shown in figure 1 (Table 2). For all cognitive measures, earlier born cohorts contained a higher proportion of participants showing cognitive gain, and a smaller proportion of participants showing decline, compared to later born cohorts. This pattern is especially evident when comparing the 1901-02 cohort to the 1930 cohort.
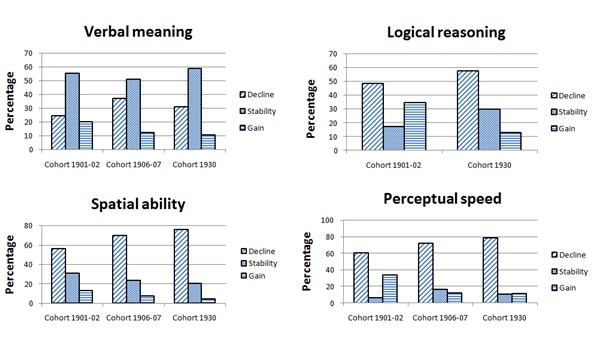 Figure 1: Proportion of participants showing cognitive decline, stability and gain from 70 to 79 years stratified by cohort.
|
|
Cohort 1901-02 |
Cohort 1906-07 |
Cohort 1930 |
||||||
|
Cognitivemeasure |
Decline |
Gain |
Decline |
Stability |
Gain |
Decline |
Stability |
Gain |
|
|
Verbal Meaning |
43 (24.6) |
97 (55.4) |
35 (20.0) |
77 (37.2) |
105 (50.7) |
25 (12.1) |
32 (30.8) |
61 (58.7) |
11 (10.6) |
|
LogicalReasoninga |
80 (48.5) |
28 (17.0) |
57 (34.5) |
|
|
|
71 (57.3) |
37 (29.8) |
16 (12.9) |
|
Spatial Ability |
49 (56.3) |
27 (31.0) |
11 (12.6) |
145 (69.4) |
49 (23.4) |
15 (7.2) |
83 (75.5) |
22 (20.0) |
5 (4.5) |
|
Perceptual Speed |
49 (60.5) |
5 (6.2) |
27 (33.3) |
148 (71.8) |
34 (16.5) |
24 (11.7) |
100 (78.7) |
13 (10.2) |
14 (11.0) |
Table 2: Proportions of participants categorized as showing cognitive decline, stability and gain, stratified by birth cohort and cognitive measure.
a; Data for cohort 1906-07 on the Logical Reasoning test was not collected at ages 75 and 79 and therefore omitted from the present analyses.
DISCUSSION AND IMPLICATIONS
We investigated birth cohort differences regarding proportions of participants showing cognitive decline, stability and gain from age 70 to 79, in four cognitive measures (spatial ability, perceptual speed, verbal meaning and logical reasoning) using data from three population-based samples. Our main findings indicate significant cohort differences for all four cognitive measures, with weak to moderate effect sizes. For all cognitive measures, earlier born cohorts, especially the 1901-02 cohort, consists of a smaller proportion of participants showing decline, and a larger proportion of participants showing cognitive gain compared to later born cohorts (the 1930 cohort in particular). This is in line with our hypothesis.
Interestingly, our overall findings related to the question whether we should expect decline or hope for stability and even gains in the years after age 70 show that a substantial proportion in fact remained stable or showed performance gains. For the verbal meaning test, which is highly experience and education based, this was in fact the case for as many as 62 to 75 percent. The range for logical reasoning was 45 to 52 percent, for spatial ability 24 to 44 percent and for the perceptual speed test 20 to 40 percent. Thus, the proportion demonstrating stability or gain was quite substantial across tests in all three cohorts. Possible reasons for these findings could relate to cohort differences in cognitive reserve. To the extent that later born cohorts, on average, possess a higher cognitive reserve, as indicated by their higher level of performance (Table 1), they should, in accordance with the reserve hypothesis, evince cognitive decline later in life (i.e., after more severe age-related brain pathology), compared to earlier-born cohorts. But, when they start to decline they are expected to decline at a faster rate [29-31]. This could possibly explain our findings, especially the higher proportion of decliners in later born cohorts.
Another possible explanation relates to cohort differences in selective survival. As life-expectancy has increased continuously in Sweden since the 19th century [32], the remaining average life-expectancy at age 70 is therefore somewhat higher in later born cohorts. This is also mirrored in the attrition rates due to mortality (with 35 %, 26 % and 12 % for the 1901-02, 1906-07, and 1930 cohort respectively). For this reason, later born cohorts may include a larger proportion of more frail individuals, who have survived almost into their 80’s but at the expense of greater manifest cognitive decline. However, this explanation would suggest a larger slope variability component (i.e., larger heterogeneity) in later born cohorts, especially the 1930 cohort, as compared with the earlier born cohorts. This was not supported by our data [19,20]. Further, studies comparing overall health and functioning indicates that the 1930 cohort is, on average, less frail than earlier birth cohorts [26,33].
An additional explanation for our findings may relate to the psychometric properties of the cognitive tests used in the H70. Gains in manifest test scores are not necessarily evidence of gains in the latent trait the tests are purported to measure. Rather, gains could also be related to practice/retest effects [34-36]. There are reports of substantial practice gains even when the repeated measurements are separated by several years [37-39]. Practice effects may also vary due to interaction between participant’s level of ability and task difficulty [40]. For example, on easy tasks the benefits of repeated testing may be greater for the less able individuals, while the more able may benefit more on difficult tasks. To the extent that the cognitive tests analysed in this study could be considered easy, cohort differences in practice effects may provide yet another possible explanation for our findings of a relatively steeper average decline among members of the 1930 cohort. However, Thorvaldsson et al., report limited practice effects in the cognitive test battery used in the H70 [41].
Also, the tests may vary in sensitivity to detect within-person change depending on level of performance. For instance, it could be easier to detect decline in high-performing individuals and gain among low-performers. Since later born cohorts, on average, perform at a higher level compared to earlier born, this would make it more likely to detect decline in later born cohorts and gain in earlier born. The main strength of this study is that we used data from age-homogenous, representative, population-based samples, measured at the same ages with the same cognitive tests. A major limitation relates to the lower baseline response rate in the 1930-cohort (71%) compared to the 1901-02 and 1906-07 cohorts (85% and 81% respectively), as a lower response rate is likely associated with a somewhat more selective sample. Further, there exists a possibility that attrition might have compromised the representativeness of the cohorts for, partly, different reasons in the three cohorts. For instance, attrition due to mortality was higher in the earlier born cohorts compared to the 1930 cohort, while attrition due to other reasons (e.g., relocation, refusal to participate) was higher in the 1930 cohort.
Lastly, using an arbitrarily chosen cut-off to categorize participants confers the risk of obtaining spurious findings, i.e., results that are specific for the particular cut-off rather than reflecting real cohort differences. Therefore we performed a sensitivity analysis to evaluate the robustness of our results to the cut-off chosen. Here we tested several ways to categorize participants but the analyses revealed the same results, no matter the cut-off used. Thus, we are fairly confident that our findings are not spurious and only a reflection of particular cut-offs when categorizing participants. In sum, we found that substantial proportions of individuals remain cognitively stable, or even show gains, from age 70 to 79. Further, our findings indicate significant cohort differences regarding these proportions. For all four cognitive measures, later born cohorts contains a smaller proportion of participants showing cognitive gain, and a larger proportion of participants showing decline compared to earlier born cohorts. One implication of these cohort differences is that although later born cohorts evidence higher average cognitive functioning (i.e., Flynn effects) we can expect a higher proportion of individuals showing cognitive decline in later born cohorts. This in turn may have implications in the debate regarding postponing retirement (as a strategy to deal with possible economic strain imposed by population aging).
Further, our results may also have implications concerning older individuals own expectations concerning aging, but may also be of importance for the planning and funding of healthcare. Finally, our findings of cohort differences also have important implications concerning the use of cognitive testing to assist in evaluations of for instance disability, dementia status and work capability. The reported birth cohort differences needs to be taken into account in practices such as standardizations of cognitive tests, establishment of norms and cut-off values and decision-making based on cognitive evaluations.
ACKNOWLEDGEMENT
The study was supported by a grant from FAS/Forte.
FUNDING
This work was supported by the Swedish Research Council (no 11267, 825-2007-7462, 825-2012-5041, 2013-8717, 2015-02830); Swedish Research Council for Health, Working Life and Welfare (no 2001-2646, 2001-28352003-0234, 2004-0150, 2006-0020, 2008-1229, 2012-1138, 2004-0145, 2006-0596, 2008-1111, 2010-0870, 2013-1202, AGECAP 2013-2300, 2013-2496, Epilife 2006-1506); the Swedish Alzheimer Foundation; Swedish Brain Power; The Alzheimer's Association Zenith Award (ZEN-01-3151); The Alzheimer's Association Stephanie B. Overstreet Scholars (IIRG-00-2159); The Bank of Sweden Tercentenary Foundation; Stiftelsen Söderström-Königska Sjukhemmet; Stiftelsen för Gamla Tjänarinnor; and Stiftelsen Handlanden Hjalmar Svenssons for sknings fond.
REFERENCES
- Schaie KW (2016) Theoretical perspectives for the psychology of aging in a lifespan context. In: Schaie KW, Willis SL (eds.). Handbook of the psychology of aging. Academic Press, London, UK. Pg no: 550.
- Barnes DE, Cauley JA, Lui LY, Fink HA, McCulloch C, et al. (2007) Women who maintain optimal cognitive function into old age. J Am Geriatr Soc 55: 259-264.
- Habib R, Nyberg L, Nilsson LG (2007) Cognitive and non-cognitive factors contributing to the longitudinal identification of successful older adults in the betula study. Neuropsychol Dev Cogn B Aging Neuropsychol Cogn 14: 257-273.
- Josefsson M, de Luna X, Pudas S, Nilsson LG, Nyberg L (2012) Genetic and lifestyle predictors of 15-year longitudinal change in episodic memory. J Am Geriatr Soc 60: 2308-2312.
- Persson J, Nyberg L, Lind J, Larsson A, Nilsson LG, et al. (2006) Structure-function correlates of cognitive decline in aging. Cereb Cortex 16: 907-915.
- Persson J, Pudas S, Lind J, Kauppi K, Nilsson LG, et al. (2012) Longitudinal structure-function correlates in elderly reveal MTL dysfunction with cognitive decline. Cereb Cortex 22: 2297-2304.
- Schaie KW (2005) Developmental Influences on Adult Intelligence: The Seattle Longitudinal Study. Oxford University Press, New York, USA.
- Yaffe K, Fiocco AJ, Lindquist K, Vittinghoff E, Simonsick EM, et al. (2009) Predictors of maintaining cognitive function in older adults: the Health ABC study. Neurology 72: 2029-2035.
- Wilson RS, Beckett LA, Barnes LL, Schneider JA, Bach J, et al. (2002) Individual differences in rates of change in cognitive abilities of older persons. Psychol Aging 17: 179-193.
- Schaie KW (2010) Adult cognitive development from a lifespan developmental perspective. Annual Report of Meiso University 28: 21-35.
- Ang S, Rodgers JL, Wänström L (2010) The Flynn Effect within Subgroups in the U.S: Gender, Race, Income, Education, and Urbanization Differences in the NLSY-Children Data. Intelligence 38: 367-384.
- Flynn JR (1987) Massive IQ Gains in 14 Nations: What IQ Tests Really Measure. Psychological Bulletin 101: 171-191.
- Nettelbeck T, Wilson C (2004) The Flynn effect: Smarter not faster. Intelligence 32: 85-93.
- Pietschnig J, Voracek M, Formann AK (2010) Pervasiveness of the IQ rise: A cross-temporal meta-analysis. PloS One 5: 14406.
- Rodgers JL, Wänström L (2007) Identification of a Flynn effect in the NLSY: Moving from the center to the boundaries. Intelligence 35: 187-196.
- Rönnlund M, Carlstedt B, Blomstedt Y, Nilsson LG, Weinehall L (2013) Secular Trends in cognitive test performance: Swedish conscript data 1970-1993. Intelligence 41: 19-24.
- Rönnlund M, Nilsson LG (2006) Adult life-span patterns in WAIS-R block design performance: Cross-sectional versus longitudinal age gradients and relation to demographic factors. Intelligence 34: 63-78.
- Uttl B, Van Alstine CL (2003) Rising verbal intelligence scores: Implications for research and clinical practice. Psychol Aging 18: 616-621.
- Karlsson P, Thorvaldsson V, Skoog I, Gudmundsson P, Johansson B (2015) Birth cohort differences in fluid cognition in old age: Comparisons of trends in levels and change trajectories over 30 years in three population-based samples. Psychol Aging 30: 83-94.
- Thorvaldsson V, Karlsson P, Skoog J, Skoog I, Johansson B (2017) Better Cognition in New Birth Cohorts of 70 Year Olds, But Greater Decline Thereafter. J Gerontol B Psychol Sci Soc Sci 72: 16-24.
- Rinder L, Roupe S, Steen B, Svanborg A (1975) Seventy-year-old people in Gothenburg. A population study in an industrialized Swedish city. Acta Med Scand 198: 397-407.
- Svanborg A (1977) Seventy-year-old people in Gothenburg a population study in an industrialized Swedish city. II. General presentation of social and medical conditions. Acta Med Scand Suppl 611: 5-37.
- Dey DK, Rothenberg E, Sundh V, Bosaeus I, Steen B (2002) Waist circumference, body mass index, and risk for stroke in older people: A 15 year longitudinal population study of 70- year-olds. J Am Geriatr Soc 50: 1510-1518.
- Sacuiu S, Gustafson D, Sjögren M, Guo X, Ostling S, et al. (2010) Secular changes in cognitive predictors of dementia and mortality in 70-year-olds. Neurology 75: 779-785.
- Falk H, Johansson L, Ostling S, Thøgersen Agerholm K, Staun M, et al. (2014) Functional disability and ability 75-year-olds: a comparison of two Swedish cohorts born 30 years apart. Age Ageing 43: 636-641.
- Dureman I (1971) Manual till DS-batteriet [Manual for the DS-battery]. Skandinaviska testförlaget, Stockholm, Sweden. Pg no: 103.
- Thorvaldsson V (2008) Change and variability in cognitive performance in old age: Effects of retest, terminal decline, and pre-clinical dementia. Dissertation, University of Gothenburg, Gothenburg, Sweden.
- Wechsler D (1981) Wechsler adult intelligence scale-revised. The psychological association, San Antonio, USA.
- Barulli D, Stern Y (2013) Efficiency, capacity, compensation, maintenance, plasticity: Emerging concepts in cognitive reserve. Trends Cogn Sci 17: 502-509.
- Stern Y (2009) Cognitive reserve. Neuropsychologia 47: 2015-2028.
- Whalley LJ, Deary IJ, Appleton CL, Starr JM (2004) Cognitive reserve and the neurobiology of cognitive aging. Ageing Res Rev 3: 369-382.
- Statistics Sweden (2013) The future population of Sweden 2013-2060. Statistics Sweden, Stockholm, Sweden.
- Hörder H, Skoog I, Frändin K (2013) Improved health among 75-year-olds: A population-based study of cohorts born 1911 and 1930. European Geriatric Medicine 4: 75.
- Lövdén M, Ghisletta P, Lindenberger U (2004) Cognition in the Berlin Aging Study (BASE): The first 10 years. Aging Neuropsychology and Cognition 11: 104-133.
- Salthouse TA (2014) Aging Cognition Unconfounded by Prior Test Experience. J Gerontol B Psychol Sci Soc Sci 71: 49-58.
- Thorvaldsson V (2016) Retest and practice effects. In: Whitbourne SK (ed.). The encyclopedia of adulthood and aging (Vol 3). Wiley, New Jersey, USA. Pg no 1656.
- Rönnlund M, Lövdén M, Nilsson LG (2007) Cross-sectional versus longitudinal age gradients of tower of Hanoi performance: The role of practice effects and cohort differences in education. Neuropsychol Dev Cogn B Aging Neuropsychol Cogn 15: 40-67.
- Rönnlund M, Nyberg L, Bäckman L, Nilsson LG (2005) Stability, growth, and decline in adult life span development of declarative memory: Cross-sectional and longitudinal data from a population-based study. Psychol Aging 20: 3-18.
- Salthouse TA, Schroeder DH, Ferrer E (2004) Estimating retest effects in longitudinal assessments of cognitive functioning in adults between 18 and 60 years of age. Dev Psychol 40: 813-822.
- Rabbitt P, Diggle P, Holland F, McInnes L (2004) Practice and drop-out effects during a 17-year longitudinal study of cognitive aging. J Gerontol B Psychol Sci Soc Sci 59: 84-97.
- Thorvaldsson V, Hofer SM, Berg S, Johansson B (2006) Effects of repeated testing in a longitudinal age-homogeneous study of cognitive aging. J Gerontol B Psychol Sci Soc Sci 61: 348-354.
Citation: Karlsson P, Thorvaldsson V, Skoog I, Johansson B (2019) What can we Expect of Cognition after 70? Cognitive Decline, Stability, and Gain between 70 and 79 Years in Three Swedish Birth Cohorts. J Gerontol Geriatr Med 5: 027.
Copyright: © 2019 Peter Karlsson, et al. This is an open-access article distributed under the terms of the Creative Commons Attribution License, which permits unrestricted use, distribution, and reproduction in any medium, provided the original author and source are credited.