Study of Echocardiographic Changes in Macrosomic Neonates
*Corresponding Author(s):
Ahmed E AhmedDepartment Of Pediatrics, Faculty Of Medicine, South Valley University, Qena, Egypt, Egypt
Tel: +20 1003329944,
Email:Yasen112010@gmail.com, drahmed.saad@med.svu.edu.eg
Abstract
Objectives: To assess the echocardiographic changes of macrosomic Infants of Diabetic Mothers (IDMs), macrosomic Infants of Non Diabetic Mothers (INDMs), and Average for Gestational Age infants (AGA).
Patients and methods: A cohort prospective case control clinical study includes 78 newborns admitted and attended the outpatient clinic of Neonatal Intensive Care Unit (NICU), Pediatric department, Qena University Hospital.
Results: Our study showed highly statistical significant difference in the mean of Interventricular Septum (IVS) in macrosomic IDMs and macrosomic INDMs (5.3±1.44 mm, 5±1.5 mm respectively) in comparison to control group (3.7±0.8 mm). Higher frequency of Asymmetrical Septal Hypertrophy (ASH) among macrosomic IDMs (51.9%) compared to other groups with statistically significant difference.
Conclusion: Asymmetrical septal hypertrophy was the commonest echocardiographic change found among IDMs, and HCM (Concentric Hypertrophy) was the commonest echocardiographic change found among INDMs. Both maternal diabetes (whatever its type) and macrosomia found to be risk factors for septal hypertrophy. Cases with asymmetrical septal hypertrophy due to maternal diabetes showed spontaneous improvement, while patients with concentric hypertrophy due to macrosomia of INDMs showed no reduction in septal or left ventricular posterior wall thickness.
Keywords
INTRODUCTION
The incidence of gestational diabetes is increasing worldwide, exposing large numbers of infants to hyperglycemia whilst in utero. This exposure may have a long-term negative impact on the cardiovascular health of the offspring. Variations exist in the reported prevalence rates of GDM within and between countries of the GCC with rates as low as 4.2% in Oman to as high as 24.9% in United Arab Emirates (UAE). Reported rates in other GCC countries are 16.3% in Qatar, 10.1% in Bahrain and 2.7% - 12.5% in Saudi Arabia [6]. The MENA region had the highest comparative prevalence of diabetes in the world in 2012, with four countries in the region among the top ten worldwide in terms of prevalence. The International Diabetes Federation (IDF) estimates that by 2030, patients with diabetes will double to current estimates of up to 59.9 million in the MENA region. Even though epidemiological studies document high diabetes prevalence in each country, there are specific regions within each country that have higher prevalence of diabetes than originally stated.
An elevated frequency of septal hypertrophy was found in IDMs. Septal hypertrophy suggests that diabetic mothers were not in good metabolic control, because it has been reported that careful glucose control during pregnancy reduces the incidence and severity of hypertrophic cardiomyopathy in the fetus but may still not prevent accelerated fetal cardiac growth [7]. Large Gestational Age (LGA) of INDMs also showed septal hypertrophy [8].
PATIENTS AND METHODS
Infants were divided into three groups: group (A): compromised 28 macrosomic Infants of Diabetic Mother (IDMs), group (B): 25 macrosomic Infants of Non Diabetic Mothers (INDM), and group (C): 25 Average for Gestational Age infants (AGA). The mothers of group A: 14 had (type I) diabetes, 4 had (type II) and 10 had gestational diabetes mellitus. Of group A, 28 infants were macrosomic according to their gestational ages [9]. We used birth weight greater than 4000 gm to define macrosomia in full term babies, as this is the most commonly proposed definition [1].
Data collection
• Maternal age and Parity
• Type of diabetes mellitus (type I, type II or gestational)
• Therapeutic history during pregnancy
• History of delivery of previous macrosomic babies
• Type of delivery
• History of obstructed labor
• Birth weight
• Gestational age
• History of respiratory distress or cyanosis
• History of pallor, plethora, petechiae
• History of congenital malformation
Laboratory methods
HbA1c: HbA1c was done for diabetic mothers for assessment of diabetic control at late pregnancy, sub optimally controlled diabetic mothers (HbA1c≥7 mg/dL) [10].
• Echocardiogram was performed by general electronics Vivid S5, 6 MHz phased array probe
• Cardiac measurements were determined by cross-sectional M-mode echocardiography performed in the first three days after birth. Appropriate transducers of 6 MHz were used to define cardiac structures. The echocardiograms were obtained in the standard precordial positions, The echocardiograms were obtained in the standard precordial positions, echocardiographic measurements including LVESd/LVEDd (LVESd: Left Ventricular End-Systolic Diameter, LVEDd: Left Ventricular End-Diastolic Diameter, IVS: Interventricular Septum thickness, PW: Posterior Wall thickness, IVS/PW: Interventricular Septum thickness to Posterior Wall thickness ratio, Ao: Aorta diameter, LA: Left Atrium diameter, FS%: Shortening Fraction, EF%: Ejection Fraction. All measurements were made at end-diastole in cm) for control group & macrosomic infants of nondiabetic mothers & infants of diabetic mothers
• 2D for assessment of heart anatomy
• Pulsed and continuous waves dopplar for assessment of flow across the valves
• Color flow mapping was used for assessment of presence of shunt and its direction. All measurements were compared to measurement of Mung Park, 2008
Statistical analysis
RESULTS
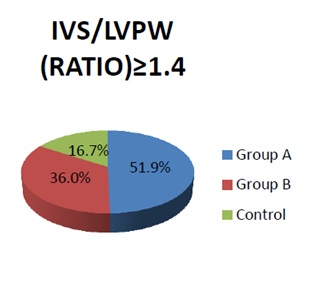
Figure 1: Relative frequency of the (ASH) of infants study.
Relative frequency of the (ASH) of infants study: The percentage frequency of the Asymmetrical Septal Hypertrophy (ASH) among macrosomic IDM was significantly high in comparison to other groups (p<0.05).
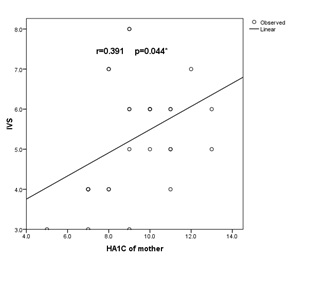
Figure 2: Correlation between Interventricular Septum thickness (IVS) and HA1c in macrosomic IDM (group A).
There was statistically significant positive correlation with (r=0.391) (p<0.05) between IVS and HA1C in macrosomic infants of diabetic mother (group A).
|
|
Control |
Group A |
Group B |
|||
|
No. |
% |
No. |
% |
No. |
% |
|
|
Maternal age (years) (mean+SD) |
23.6+3.3 |
28.94+4.1 |
27.6+4.3 |
|||
|
Type of DM |
||||||
|
Type I |
0 |
0.0 |
14 |
50.0 |
0 |
0.0 |
|
Type II |
0 |
0.0 |
4 |
15.0 |
0 |
0.0 |
|
GD |
0 |
0.0 |
10 |
35.0 |
0 |
0.0 |
|
Type of Drug |
||||||
|
Insulin |
0 |
0.0 |
25 |
89.0 |
0 |
0.0 |
|
Type of delivery |
||||||
|
Cs |
13 |
52.0 |
27 |
96.0 |
23 |
92.0 |
|
NVD |
12 |
48.0 |
1 |
4.0 |
2 |
8.0 |
|
Parity (n) (mean±SD) |
1.6+1 |
2.4+2 |
2+1.5 |
|||
|
Similar condition of previous macrosomic babies |
0 |
0.0 |
15 |
53.0 |
12 |
48.0 |
Table 1: Maternal demographic data of the included mother in the study.
|
|
Control |
Group A |
Group B |
p value |
|||
|
No. |
% |
No. |
% |
No. |
% |
||
|
Resuscitation |
|||||||
|
Yes |
2 |
8.0 |
15 |
53.0 |
12 |
48.0 |
<0.05* |
|
NICU admission |
|||||||
|
Yes |
2 |
8.0 |
12 |
43.0 |
9 |
36.0 |
<0.05* |
Table 2: Neonatal data of the studied infants versus control group.Infant need for resuscitation was significantly high among macrosomic babies in comparison to control group (p<0.05). As a sequence a significantly high percentage of macrosomic babies were admitted to NICU.Showed neonatal data of the studied infants versus control group.
|
|
Group A |
Group B |
Control |
p value |
|
Mean+SD |
Mean+SD |
Mean+SD |
||
|
Birth weight (Kg) |
4.18+0.28 |
4.11+0.28 |
2.95+0.3 |
<0.001** |
|
HR |
141.11+10.85 |
135+11.28 |
134.52+11.4 |
<0.05* |
|
RR |
61.44+11.02 |
60.64+11.79 |
51.28+8.15 |
<0.001** |
|
SBP |
72+5.36 |
67.4+6.23 |
54.4+6.4 |
<0.001** |
|
DBP |
43.4 1+3.6 |
39.96 + 3.82 |
32.6+4.57 |
<0.001** |
|
Temp (c) |
36.77+0.4 |
37.1 + 0.35 |
36.79+0.54 |
<0.05* |
|
Length (cm) |
48.15+2.03 |
49 + 1.96 |
45.76+2.37 |
<0.001** |
|
HC (cm) |
34.78+0.8 |
34.76+0.97 |
33.4+1.38 |
<0.001** |
Table 3: Anthropometric measurements and vital data of the studied infants versus control group.There was a significantly high mean values of each of birth weight, head circumference, respiratory rate, heart rate, systolic and diastolic blood pressure in macrosomic IDM in comparison to control group (p<0.001, p<0.001, p<0.001, p<0.05 and p<0.001 respectively). Also a significantly high mean values of each of length and body temperature in macrosomic infants of nondiabetic mothers in comparison to control group (p<0.001 and p<0.05 respectively).
|
Symptom |
Group A |
Group B |
Control |
p value |
|||
|
No. |
% |
No. |
% |
No. |
% |
||
|
Macrosomia |
28 |
100.0 |
25 |
100 |
0.0 |
0.0 |
NS |
|
Hypoglycemia |
21 |
75.0 |
0 |
0.0 |
0 |
0.0 |
- |
|
RDS |
8 |
28.0 |
3 |
12.0 |
4 |
16.0 |
NS |
|
TTN |
11 |
39.0 |
14 |
56.0 |
1 |
4.0 |
<0.05* |
|
Jaundice |
6 |
21.0 |
2 |
8.0 |
3 |
12 |
NS |
|
Plethoric |
8 |
28.0 |
0 |
0.0 |
0 |
0.0 |
<0.001** |
|
Cyanosis |
11 |
39.0 |
4 |
16.0 |
2 |
8.0 |
<0.05* |
|
Apnea |
2 |
7.0 |
0 |
0.0 |
0 |
0.0 |
NS |
|
Convulsion |
0 |
0.0 |
0 |
0.0 |
0 |
0.0 |
- |
Table 4: Clinical data of the studied infants versus control group.The percentage frequency of each of hypoglycemia, TTN, plethora, cyanosis were significantly high among macrosomic infants of diabetic mothers (75%-28%-39% respectively) in comparison to other groups (p<0.001, p<0.05, p<0.001, p<0.05 respectively).
|
CHD |
Control |
Group A |
Group B |
p value |
|||
|
No. |
% |
No. |
% |
No. |
% |
||
|
ASD secundum |
1 |
4.0 |
2 |
6.0 |
7 |
28.0 |
NS |
|
VSD |
2 |
8.0 |
1 |
4.0 |
1 |
4.0 |
|
|
PDA |
0 |
0.0 |
4 |
14.0 |
2 |
8.0 |
|
Table 5: Relative frequency of the Congenital Heart Disease (CHD) of the studied infants.No statistically significant difference regarding the frequency of occurrence or the type of the defect among the three groups.
|
Echocardiographic |
Group A |
Control |
p value |
|
IVS (mm) |
5.3+1.44 |
3.7+0.8 |
<0.001** |
|
LVEDd (mm) |
17+3.95 |
16.8+2.1 |
NS |
|
LVESd (mm) |
10.3+3.06 |
10.1+1.8 |
NS |
|
LVPWd (mm) |
3.78+1.01 |
3+0.5 |
<0.05* |
|
RV (mm) |
9.84+3.79 |
10.12+2.8 |
NS |
|
FS% |
39.78+5.34 |
40.2+4.8 |
NS |
|
PA (mm) |
10.26+2.9 |
9.28+2.28 |
NS |
|
LA (mm) |
13+3.27 |
13.12+2.83 |
NS |
|
AAO (mm) |
10.33+1.82 |
9.48+1.05 |
<0.05* |
|
AAO flow (cm sec) |
88.26+15.46 |
91.48+23.01 |
NS |
Table 6: Echocardiographic changes in macrosomic Infants of Diabetic Mothers (IDMs) (group A) versus control group.There were significantly high mean values of each of IVS, LVEWd, and AAO of macrosomic IDM in comparison to control group.
|
Ratio |
Group A |
Group B |
Control |
p value |
|||
|
No. |
% |
No. |
% |
No. |
% |
||
|
<1.4 |
13 |
48.1 |
16 |
64.0 |
20 |
83.3 |
<0.05* |
|
≥1.4 |
15 |
51.9 |
9 |
36.0 |
4 |
16.7 |
|
Table 7: Relative frequency of the Asymmetrical Septal Hypertrophy (ASH) of the studied infants.
|
Echocardiographic |
Control |
Group B |
p value |
|
IVS (mm) |
3.7+0.8 |
5+1.5 |
<0.001** |
|
LVEDd (mm) |
16.8+2.1 |
17.8+1.7 |
NS |
|
LVESd (mm) |
10.2+1.8 |
11.1+1.4 |
NS |
|
LVPWd (mm) |
3+0.5 |
3.4+0.9 |
NS |
|
RV (mm) |
10.1+2.8 |
10.4+2.8 |
NS |
|
FS% |
40.2+4.8 |
38.2+4.5 |
NS |
|
PA (mm) |
9.3+2.3 |
10+1.2 |
NS |
|
LA (mm) |
13.1+2.8 |
13.7+2.2 |
NS |
|
AAO (mm) |
9.5+1 |
10.9+1.4 |
<0.001** |
|
AAO flow (cm.sec) |
91.5+23 |
91.9+14.3 |
NS |
Table 8: Echocardiographic changes in macrosomic infants of non diabetic mother (group B) versus control group.
A significantly high mean values of each of IVS, and AAO of macrosomic INDM in comparison to control group (p<0.001).
A significantly high mean values of each of IVS, and AAO of macrosomic INDM in comparison to control group (p<0.001).
DISCUSSION
In present study (Table 2), it was found that high frequency of Infants of Diabetic Mothers (IDMs) that needed resuscitation 15 infants (53%), and the frequency of macrosomic of INDMs were found 12 infants (48%), this was in agreement with Ikeda et al., who reported that Infants of Diabetic Mothers (IDMs) are at an increased risk of respiratory distress, and operative delivery due to macrosomia also increases the risk for Transient Tachypnoea of the Newborn (TTN) [13].
Our study showed that macrosomic Infants of Diabetic Mothers (IDMs) exhibits higher NICU admissions (Table 2), this was in agreement with Vela-Huerta et al., who reported that Infants of Diabetic Mothers (IDMs) mainly having congenital anomalies, heart disease, significant respiratory illness, or hypoglycemia need for NICU for continued care and access to subspecialists [14].
In the present study (Table 3), it was found that macrosomic Infants of Diabetic Mothers (IDMs) and (INDMs) group showed significant difference regarding weight, length, and head circumference, this was in agreement with Ng SK et al., who reported that there was a significant difference between macrosomic and normal newborns regarding weight, height, and head size, and in disagreement with Krishnaveni et al., who reported that a basic anthropometric indexes did not differ between the LGA and AGA groups with the exception of head circumference [1,15]. Regarding blood pressure macrosomic infants of diabetic mother exhibited higher systolic and diastolic blood pressure, this was in agreement with Patel et al., who reported that offspring of diabetic women have been shown to have higher systolic and diastolic blood pressure than those born to non diabetic women [16]. Respiratory rate and heart rate were found to be higher in Infants of Diabetic Mothers (IDMs), this was in agreement with Vela-Huerta et al., who reported that Infants of Diabetic Mothers (IDMs) mainly having congenital anomalies, heart disease and significant respiratory illness [14].
In present study (Table 4), it was found that 21 infants of macrosomic Infants of Diabetic Mothers (IDMs) (75%) presented with neonatal hypoglycemia in first few hours after birth (1/2 h-1 h-2 h), 12 infants were corrected by administration of glucose and oral feeding as early as possible, and 9 infants presented with severe hypoglycemia that require NICU admission for IV administration of glucose (bolus dose 2 mL/kg of glucose 10% followed by a continuous infusion of glucose 10% at an infusion rate of 6-8 mg/kg/min), this was in agreement with Vela-Huerta et al., showed that hypoglycemia was found in (72.7%) in IDMs, and in agreement with Mäkelä et al., who reported that hypoglycemia is common presentation in IDMs, caused by hyperinsulinemia due to hyperplasia of fetal pancreatic beta cells consequent to maternal-fetal hyperglycemia [12,17]. Our study showed that high frequency of plethoric babies 28% among macrosomic IDMs, this was in agreement with Cetin et al., who reported that 34% of macrosomic IDMs presented with polycythemia caused by increased erythropoiesis triggered by chronic fetal hypoxia [18].
Regarding the frequency or type of the defect of CHD there was no significant difference among the three groups (macrosomic Infants of Diabetic Mothers (IDMs) - macrosomic infants of non diabetic mothers INDMs and control group) (Table 5). Echocardiographic evaluation of the studied macrosomic IDMs revealed that two (6%) neonates had a trial septal defect of the secundum type (ASD II), one (4%) of them had VSD, and four (14%) had PDA. These anatomic abnormalities were hemodynamically insignificant, this was disagreement with Potter et al., who reported that cardiac malformations in IDMs are five times higher than in normal pregnancies [10].
Macrosomic Infants of Diabetic Mothers (IDMs) showed significant difference regarding IVS and LVPWd compared to control group (Table 6), this was in agreement with Russell et al., who reported that myocardial hypertrophy is frequent in fetuses of diabetic mothers and it is thought to be secondary to maternal and fetal hyperglycemia [19].
In present study (Table 7 and Figure 1), it was found that 51.9% of macrosomic IDMs had asymmetrical hypertrophy of septum, this was in agreement with Sardesai et al., who reported that HCM in macrosomic IDMs is characterized by disproportionate hypertrophy of septum and ventricular walls [20]. By following up after 3 months our study showed that all cases of HCM in form of (asymmetrical septal hypertrophy) among IDMs improved and return to normal dimensions but HCM in the infants of non-diabetic mother INDM not improved, this was in agreement with Leipold et al., who reported that all cases of HCM among IDMs return gradually to a normal size in the first months after birth in contrast to the infant of a non-diabetic mother where HCM is usually progressive and associated with a very poor prognosis [21].
Macrosomic Infants of Non Diabetic Mothers (INDMs) show high significant difference regarding IVS (Interventricular Septum) compared to the control group (AGA) (Table 8), which was in agreement with Lindsay et al., who reported that LGA-INDMs showed septal hypertrophy [8].
Positive statistically significant correlation between IVS and HbA1c in infants of diabetic mothers (Figure 2), this was in agreement Ullmo et al., who reported an association between poor maternal glycemic control and HCM [22]. Also in agreement with Weber et al., reported that good maternal glycemic control during pregnancy assures a normal fetal cardiac growth. On the contrary, Rizzo et al., found an increase in the cardiac size in fetuses of diabetic mothers, in spite of a careful metabolic control [23,24].
CONCLUSION
CONFLICT OF INTEREST
REFERENCES
- Ng SK, Olog A, Spinks AB, Cameron CM, Searle J, et al. (2010) Risk factors and obstetric complications of large for gestational age births with adjustments for community effects: Results from a new cohort study. BMC Public Health 10: 460.
- Asplund CA, Seehusen DA, Callahan TL, Olsen C (2008) Percentage change in antenatal body mass index as a predictor of neonatal macrosomia. Ann Fam Med 6: 550-554.
- Kerényi Z, Tamás G, Kivimäki M, Péterfalvi A, Madarász E, et al. (2009) Maternal glycemia and risk of large-for-gestational-age babies in a population-based screening. Diabetes Care 32: 2200-2205.
- Mathew M, Machado L, Al-Ghabshi R, Al-Haddabi R (2005) Fetal macrosomia. Risk factor and outcome. Saudi Med J 26: 96-100.
- Mondestin MA, Ananth CV, Smulian JC, Vintzileos AM (2002) Birth weight and fetal death in the United States: The effect of maternal diabetes during pregnancy. Am J Obstet Gynecol 187: 922-926.
- International Diabetes Federation (2013) IDF Diabetes Atlas (6thEdn). International Diabetes Federation, Brussels, Belgium.
- Vela-Huerta MM, Vargas-Origel A, Olvera-López A (2000) Asymmetrical septal hypertrophy in newborn infants of diabetic mothers. Am J Perinatol 17: 89-94.
- Lindsay RS, Hamilton BA, Calder AA, Johnstone FD, Walker JD, et al. (2004) The relation of insulin, leptin and IGF-1 to birthweight in offspring of women with type 1 diabetes. Clin Endocrinol (Oxf) 61: 353-359.
- Fenton TR (2003) A new growth chart for preterm babies: Babson and Benda's chart updated with recent data and a new format. BMC Pediatr 3: 13.
- Potter CF, Kicklighter SD (2006) Infant of Diabetic Mother. Diabetes Care 100: 619-637.
- Bloomington (2012) Prenatal care routine. Gynacology and Obest J 19: 19-28.
- Vela-Huerta M, Aguilera-López A, Alarcón-Santos S, Amador N, Aldana-Valenzuela C, et al. (2007) Cardiopulmonary adaptation in large for gestational age infants of diabetic and nondiabetic mothers. Acta Pediatric 96: 1303-1307.
- Ikeda H, Shiojima I, Oka T, Yoshida M, Maemura K, et al. (2011) Increased Akt-mTOR signaling in lung epithelium is associated with respiratory distress syndrome in mice. Mol Cell Biol 31: 1054-1065.
- Vela-Huerta MM, Amador-Licona N, Anaya-Aguirre S, Guizar-Mendoza MJ, Velazquez-Bustamante A, et al. (2012) Insulin and leptin levels in appropriate-for-gestational-age infants of diabetic mother. Iran J Pediatr 22: 475-480.
- Krishnaveni GV, Hill JC, Leary SD, Veena SR, Saperia J, et al. (2005) Anthropometry, glucose tolerance, and insulin concentrations in Indian children: relationships to maternal glucose and insulin concentrations during pregnancy. Diabetes Care 28: 2919-2925.
- Patel S, Fraser A, Davey Smith G, Lindsay RS, Sattar N, et al. (2012) Associations of gestational diabetes, existing diabetes, and glycosuria with offspring obesity and cardiometabolic outcomes. Diabetes Care 35: 63-71.
- Mäkelä J, Lagström H, Kaljonen A, Simell O, Niinikoski H (2013) Hyperglycemia and lower diet quality in pregnant overweight women and increased infant size at birth and at 13months of age -- STEPS study. Early Hum Dev 89: 439-444.
- Cetin H, Yalaz M, Akisu M, Kultursay N (2011) Polycythaemia in infants of diabetic mothers: β-hydroxybutyrate stimulates erythropoietic activity. J Int Med Res 39: 815-821.
- Russel NE, Holloway P, Quinn S, Foley M, Kelehan P, et al. (2008) Cardiomyopathy and cardiomegaly in stillborn infants of diabetic mothers. Pediatr Dev Pathol 11: 10-14.
- Sardesai MG, Gray AA, McGrath MM, Ford SE (2001) Fatal hypertrophic cardiomyopathy in the fetus of a woman with diabetes. Obstet Gynecol 98: 925-927.
- Leipold H, Worda C, Schwindt J, Kautzky-Willer A, Bancher-Todesca D, et al. (2005) Severe diabetic fetopathy despite strictmetabolic control. Wien Klin Wochenschr 117: 561-564.
- Ullmo S, Vial Y, Di Bernardo S, Roth-Kleiner M, Mivelaz Y (2007) Pathologic ventricular hypertrophy in the offspring of diabetic mothers: a retrospective study. Eur Heart J 28: 1319-1325.
- Weber HS, Botti JJ, Baylen BG (1994) Sequential longitudinal evaluation of cardiac growth and ventricular diastolic filling in fetuses of well controlled diabetic mothers Pediatr Cardiol 15: 184-189.
- Rizzo G, Arduini D, Romanini C (1992) Accelerated cardiac growth and abnormal cardiac flow in fetuses of type I diabetic mothers. Obstet Gynecol 80: 369-376.
Citation: Mohy-Elddin ZM, Ahmed AE, Qubiasy HM, Rashwan NI, Beshary SA (2018) Study of Echocardiographic Changes in Macrosomic Neonates. J Med Stud Res 1: 006.
Copyright: © 2018 Ahmed E Ahmed, et al. This is an open-access article distributed under the terms of the Creative Commons Attribution License, which permits unrestricted use, distribution, and reproduction in any medium, provided the original author and source are credited.