A 12-Week, Multi-Center, Double-Blind, Randomized, Placebo-Controlled Clinical Trial for the Evaluation of the Efficacy and Safety of the Herbal Extract (EstroG-100®) on Menopausal Symptoms
*Corresponding Author(s):
Tak KimDepartment Of Obstetrics And Gynecology, Korea University Anam Hospital, 73, Goryeodae-ro, Seongbuk-gu, Seoul 02841, Republic Of Korea
Tel:+82 29205310,
Fax:+82 29215357
Email:tkim@kumc.or.kr
Abstract
Objective: To investigate the safety and efficacy of received EstroG-100®, a combined herbal extract of Cynanchum wilfordii Hemsley, Phlomis umbrosa Turczaninow, and Angelica gigas Nakai, in improving menopausal symptoms among Korean menopausal women.
Materials and methods: This study was designed as a multicenter, randomized, double-blind, placebo-controlled clinical trial in women aged 40-70 years with menopausal symptoms (Kupperman menopausal index [KMI] ≥ 20). The primary and secondary efficacy endpoints were the change in the total modified KMI score and the changes in the 12 items of the modified KMI score, respectively.
Results: The total modified KMI score significantly improved after a 12-week intake of EstroG-100® compared with the placebo. Of the secondary efficacy endpoints, paresthesia, nervousness, melancholia, vertigo, fatigue, arthralgia and myalgia, and formication improved significantly. There was no significant change observed in the serum E2 and FSH levels, endometrial thickness, and Body Mass Index (BMI), in both groups.
Conclusion: In this clinical trial, EstroG-100® was confirmed to be a safe and effective herbal treatment for a range of menopausal symptoms and enhanced the quality of life of perimenopausal women.
Keywords
EstroG-100; Kupperman menopausal index; Menopause; Plant extract; Randomized controlled trial; Vasomotor symptoms
introduction
Menopause refers to the permanent cessation of menstruation due to the loss of ovarian follicular activity. Clinically, menopause is recognized after 12 consecutive months of amenorrhea. Thus, the time of final menstruation is determined retrospectively. The aver-age age at which menopause occurs is approximately 51 years [1]. Postmenopausal women have been reported to experience hot flashes [2,3], urinary incontinence [4,5], vaginal atrophy [6], reduced sexual function [7,8], depression [9,10], and other diseases, such as coronary heart disease [11,12] and osteoporosis [13]. These are due to changes in the levels of hormones such as estrogen secondary to decreased ovarian function. In 1992, the American Medical Association published guidelines recommending that all menopausal women should consider Hormone Replacement Therapy (HRT). Since then, HRT has been regarded as the gold standard for treating the symptoms of menopausal women [14]. However, the risk of breast cancer, heart disease, and stroke increased by 26%, 29%, and 41%, respectively among approximately 16,000 menopausal women who used HRT to reduce menopausal symptoms [15].
Plant-based and natural female hormone replacements such as isoflavones, cimicifuga, and pomegranate, which have a low incidence of adverse effects, have drawn considerable attention. For many years, these herbal extracts have been used to relieve menopausal symptoms [16]. However, the mechanism of action of these plants have not been sufficiently investigated and data on their safety are limited [17-19]. Therefore, it is imperative to identify safe medicinal herbs that can improve menopausal symptoms. EstroG-100® is a standardized herbal root extract of Cynanchum wilfordii, Phlomis umbrosa and Angelica gigas. In this preparation, hot water is removed while the remaining materials is filtered to remove insoluble fibers and dried to a fine powder. The Ministry of Food and Drug Safety in Korea has registered these herbs as non-toxic food materials because they have been used safely as herbal remedies for several hundred years in Korea and China.
There have been a number of clinical, in-vitro, and in-vivo studies that have confirmed the safety and efficacy of EstroG-100®. In one of the two human studies conducted at Samsung Cheil Hospital School of Medicine Sungkyunkwan University in South Korea, using EstroG-100® for 3 months resulted in a statistically significant improvement in various menopausal symptoms (such as hot flash, sleep disorders, or joint pain) compared with the placebo group. Additionally, the treatment group that received EstroG-100® for 12 months showed statistically significant improvement in bone mineral density of the femur and triglyceride levels in the serum [20]. In another human study including White Hispanic, White non-Hispanic, and African-American women in California in the United States, the group receiving EstroG-100® showed statistically significant improvement in mean Kupperman Menopausal Index (KMI) scores, as well as in 10 different menopausal symptoms, including vasomotor symptoms, paresthesia, insomnia, nervousness, vertigo, fatigue, rheumatic pain, formication, and vaginal dryness compared with the placebo group [21]. In two clinical studies, EstroG-100® showed no significant changes in body weight, Body Mass Index (BMI), or serum E2 and FSH levels, which were observed during treatment with HRT and other phytoestrogens. However, there are no studies that used KMI as the primary endpoint in Korea. Accordingly, to confirm the results of a human trial using KMI in Korea, we conducted a 12-week, randomized, double-blinded, multicenter, placebo-controlled clinical trial on the safety and efficacy of EstroG-100®.
Materials And Methods
Study design
This clinical trial was designed as a 12-week multicenter randomized double-blind placebo-controlled study. Prior to trial initiation, the study protocol and Informed Consent Form (ICF) were reviewed and approved by the Institutional Review Board (IRB) of each of the three participating clinical trial sites: Korea University Anam Hospital, Ajou University Medical Center, and Yonsei University College of Medicine Severance Hospital. After voluntarily signing the ICF, eligible participants were enrolled based on their demographic characteristics, medical and medication history, and the results of physical examinations, vital signs, pathologic examinations, mammography, PAP smear test and modified KMI. Those who met the inclusion criteria were enrolled in the trial via stratified randomization. Stratified random assignment to treatment or control groups was carried out by assigning numbers 001-050 to those with 20 ≤ modified KMI ≤ 30, and 051-100 to those with modified KMI > 30. The enrolled participants received either the test product (EstroG-100®) or control product (placebo) for 12 weeks. The allocation ratio between the treatment and control groups was 1:1. Based on the randomization table produced prior to the clinical trial, A and B, which were generated using the randomization program of the SAS system, were sequentially assigned to participants starting from no. 1. The sponsor attached labels to the products prepared for the clinical trial according to the randomization table and supplied them to the trial sites before trial initiation.
EstroG-100® is a powdered extract that was prepared as follows: the raw materials (Cynanchum wilfordii Hemsley, Phlomis umbrosa Turczaninow and Angelica gigas Nakai) were handpicked and cut at a mass ratio of 1:1:1.08 (w/w/w), and the concentrated mixture was extracted, dried, and powdered. In this human clinical trial, the daily dose was set at 514 mg, considering the officially approved dose of EstroG-100® and the intake amount applied in previous clinical trials. EstroG-100® and the placebo were provided in a form with the same shape, texture and taste. Participants in the EstroG-100® and placebo groups took one pill twice a day over a period of 12 weeks.
The participants, who were enrolled in the clinical trial after being informed of their goals, submitted the signed ICF prior to participation, passed the eligibility screening, visited the sites four times, including the screening visit, and participated in the study for 12 weeks starting from the baseline visit (visit 2). At visit 1 (screening), data on demographic characteristics, medical and medication history, vital signs (blood pressure and heart rate), anthropometric measurements (height and weight), physical examination, mammography, PAP smear test, clinical laboratory tests (blood and urine), and modified KMI were collected, and the date of the next visit was recorded. At visit 2 (baseline, week 0), participants’ baseline characteristics were recorded, including any changes in medical and medication history, physical examination, blood test results (E2, FSH), and endometrial thickness. The inclusion/exclusion criteria were then applied to the screening and baseline data to determine the eligibility of the participants (pre-qualification testing), followed by random assignment to the treatment or control group. The participants were then provided with EstroG-100® or placebo with intake instructions, along with dietary guidance and a dietary survey, and the date of the next visit was set. At visit 3 (week 4) and visit 4 (week 12), adverse events, changes in concomitant medication and treatment, physical examination, vital signs (blood pressure and heart rate), anthropometric measurements (weight and BMI), dietary guidance and survey, intake compliance and modified KMI were assessed. The participants were then provided with EstroG-100® or placebo with intake instructions, and the date of the next visit was set. During the last visit (visit 4), clinical laboratory tests, blood tests (E2 and FSH), and endometrial thickness measurements were performed. The dietary guidelines for the participants in this study prohibited the intake of foods and drugs that could interfere with the effects of Cynanchum wilfordii Hemsley, Phlomis umbrosa Turczaninow, and Angelica gigas Nakai, and included functional foods as well as menopausal medications and treatments (hormone therapy and hormone analog treatment, including plant extracts).
Participants
This clinical study was approved on January 17, 2014, December 12, 2013, and December 16, 2013, by the IRBs of Ajou University Medical Center (IRB No. AJIRB-MED-FOD-13-271), Korea University Anam Hospital (IRB NO: AN13182-006), and Yonsei University College of Medicine Severance Hospital (IRB No. 4-2013-0728), respectively. This study was conducted according to the International Conference on Harmonization/WHO Good Clinical Practice (ICH-GCP) standards. All participants were provided with a full explanation of the study procedures and those who voluntarily signed the ICF were enrolled in the clinical trial. In total, 122 participants were screened for eligibility. Finally, 105 participants were randomly assigned to the treatment group (n = 51) and control group (n = 54), of whom two were later excluded from the treatment group (one meeting the exclusion criteria and one withdrawing consent) and four from the control group (two by meeting the exclusion criteria and two by withdrawing consent). Consequently, a total of 99 participants were included in the Full Analysis Set (FAS). Of these, one person in the treatment group was later excluded due to concomitant intake of a prohibited drug, and two people in the control group were excluded as outliers in safety items (E2/TG and blood pressure) by the Principal Investigator (PI). Consequently, 96 participants (48 per group) were included in the Per-Protocol Set (PPS) (Figure 1).
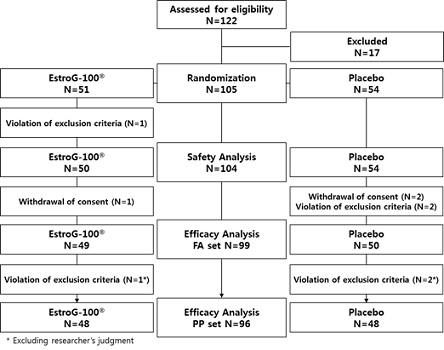 Figure 1: Study flow diagram.
Inclusion and exclusion criteria
Upon completion of the screening procedure, 105 women with menopausal symptoms were enrolled and randomized to the treatment (EstroG-100®) or control (placebo) groups.
The inclusion criteria were:
- Age 40–70 yrs
- Moderate-to-severe menopausal symptoms with a modified KMI score of ≥ 20
- Consent to participate in the trial before initiation. and the submission of a signed ICF
The exclusion criteria were:
- Body Mass Index (BMI) ≥ 30 kg/m2
- A medication history of hormones or hormone-like agents (such as plant ex-tracts) within the past three months
- Medical history of endometrial hyperplasia, uterine cancer, endometrial cancer, breast cancer, and hormone-related cancers associated with breast disease
- A medical history of severe migraine or a diagnosis of thromboembolism, cerebrovascular disease, myocardial infarction, unstable angina, or coronary angioplasty within the past 12 months
- A medical history of severe mental disorders, such as depression or anxiety disorders, and current use of psychotropic medications, such as antidepressants
- Atypical uterine bleeding at least 12 months after menopause
- Uncontrolled hypertension (160/100 mmHg or higher, measured after 10 min of seated rest)
- Diabetes with an uncontrollable blood glucose level (fasting plasma glucose concentration ≥ 180 mg/dL or resumption of antidiabetic medication within the past three months)
- Uncontrolled thyroid disease (apart from those judged to be eligible to participate in this clinical trial by the attending physician)
- Drug or alcohol abuse
- ALT or AST values more than 3-fold the upper limit of normal in the trial sites
- Serum creatinine more than twice the upper limit of normal
- Confirmation of a clinically significant abnormality on mammography or PAP smear (normal range: BI-RADS Category ≥3, PAP smear up to ASCUS [atypical squamous cells of undetermined significance])
- Participating in a different clinical trial within one month of the start of this clinical trial or planning to participate in another clinical trial during the trial period
- Cases judged inappropriate for this clinical trial by the PI
- Use of thyroid hormone preparations, clonidine, anticoagulants, or antithrombotic drugs (e.g., warfarin, aspirin and clopidogrel) within the past three months
- Intake of menopausal drugs or functional foods within the past month
- Continuous intake of foods based on Cynanchum wilfordii Hemsley, Phlomis umbrosa Turczaninow, and Angelica gigas Nakai within the past month
Outcome measurements
KMI is an international standard for assessing the degree and characteristics of menopausal discomfort, established by Dr. Kupperman to improve treatment efficiency by summating the indices representative of menopausal symptoms, based on his experience in treating menopausal women. The modified KMI consists of 12 items in six domains: vasomotor disorders, urinary symptoms, systemic neurological symptoms, motor symptoms, digestive symptoms, and systemic symptoms. Each item is rated on a 4-point scale (0-3) according to symptom intensity. For the final evaluation, weights were applied to individual item scores (item 1 = 4 points, items 2 to 4 = 2 points, and items 5 to 12 = 1 point).
Primary efficacy evaluation method
The participants received the test product (EstroG-100®) or placebo every day, and the change in the total modified KMI score was assessed at weeks 4 and 12. The degrees of symptom improvement in both groups were analyzed and compared to ascertain whether there were statistically significant differences.
Secondary efficacy evaluation method
At weeks 4 and 12 of daily intake of the test product (EstroG-100®) or placebo, the changes in the scores of the 12 items of the modified KMI, namely hot flashes or cold sweats (vasomotor symptoms), numbness and tingling (paresthesia), difficulty sleeping (insomnia), nervousness, feeling blue or depressed (melancholia), dizzy spells (vertigo), feeling tired (fatigue), arthralgia and myalgia, headaches, pounding of the heart (palpitations), the sensation of crawling on the skin (formication) and vaginal dryness were measured. The degree of symptom improvement in both groups was analyzed and com-pared to determine whether there were statistically significant differences.
Safety evaluation method
Safety evaluation was based on the frequency and severity of adverse events recorded in individual participants’ adverse event reports and abnormal findings in the results of clinical laboratory tests (serum E2 and FSH levels), endometrial thickness, hematology, blood chemistry, urinalysis, BMI and vital signs (heart rate and blood pressure). Outliers in the clinical laboratory test results, vital signs, and Electrocardiogram (ECG) results were recorded in the individual adverse event reports of the participants in the case report forms, which were then subjected to statistical analysis.
Sample size
The sample size was calculated based on the results of the study conducted by Chang et al., [21], a clinical trial that showed a statistically significant effect of EstroG-100® on the KMI score in the same manner as the present clinical trial. In the primary and secondary efficacy evaluation tests, the minimum number of participants was 42 per group. Considering a possible dropout rate of 15%, the number of participants enrolled in each group was set at 50, totaling 100. Accordingly, we planned to enroll 100 participants who met the inclusion criteria, expose them to either the test product (EstroG-100®) or the control product (placebo), and analyze the data of 84 participants (42 per group) as the final number of efficacy evaluation cases appropriate for the PP measure specified in the study protocol.
Randomization and blinding
Participants who were randomly assigned to the treatment or control groups took the test product (EstroG-100®) or placebo daily. Based on the randomization table produced prior to the clinical trial, participants were assigned as A and B starting from the first participant. To ensure double-blinding, the contents noted in the production/packaging and labeling of the products used in this clinical trial and the allocation of the identification codes for each group were sealed by the clinical trial associate and were not disclosed until the end of the trial, except in cases of serious adverse events. Each participant was pro-vided with an identification code that matched their allocation number. A spare code was used in case of defects or damage to the test or control product, so that double blinding was maintained throughout the trial for both the investigator and participant.
Statistical analysis
The data obtained from the participants were largely composed of three analysis sets: the Safety Set (SS), Full Analysis Set (FAS) and Per-Protocol Set (PPS). In compliance with the intention-to-treat principle of including all clinical trial participants randomized into a clinical trial, the FAS of this trial included participants who took the test or control product at least once, went through efficacy evaluation at least once, and met all the selection criteria. The PPS included participants belonging to the FAS who completed the clinical trial and did not violate any selection criteria that could have affected the results of the trial. FAS analysis was used as the main method for efficacy evaluation, and PPS analysis was performed. Ninety-eight participants (48 per group) were included in the study. Regarding the efficacy endpoints, the differences in the degree of changes before and after the intake of the test or control product were analyzed using the paired t-test, and the statistical significance of intergroup differences was checked using the two-sample t-test and the Wilcoxon rank sum test.
The SS included 104 participants (50 in the treatment group and 54 in the control group), from whom safety-related information was collected among those who were randomly assigned to either group and took the test or control product at least once. Safety was assessed based on adverse events, laboratory test results, vital signs, serum E2/FSH levels and endometrial thickness. The incidence of adverse events was calculated for each group, and the chi-square or Fisher’s exact tests were used for comparative analysis. A paired t-test was used for intra group comparison of differences in vital signs, E2/FSH levels, and endometrial thickness before and after intake of the product, and a two-sample t-test was used for intergroup comparison.
The data obtained in this trial are presented as descriptive statistics by calculating the mean and standard deviation, and statistical analysis was performed using SAS® (version 9.2, SAS Institute, Cary, North Carolina, USA). A two-tailed test was performed for demographics and safety assessment and a one-tailed test for efficacy assessment, with the significance level set at 0.05. The P-values of all analyses are presented to four decimal places, and p-values lower than 0.05 were considered significant. Values with decimal places, such as mean, standard deviation, and percentage, are presented as two decimal places.
Results
Characteristics of the study participants
A total of 122 participants were screened for eligibility, and 105 were enrolled and randomly assigned to the treatment (n = 51) and control groups (n = 54), of whom two were excluded from the treatment group (one by meeting the exclusion criteria and one by withdrawing consent), and four from the control group (two by meeting the exclusion criteria and two by withdrawing consent). Consequently, a total of 99 participants were included in the FAS. Of these, one was excluded from the treatment group due to concomitant intake of a prohibited drug and two from the control group for being judged as outliers in safety items (E2/TG and blood pressure) by the PI. Consequently, 96 participants (48 per group) were included in the PPS.
In the analysis of the participants’ baseline demographic and health-related characteristics, no statistically significant differences (p=0.3690) were found between the treatment and control groups with respect to age (53.50±6.47 vs. 54.57±5.66; p=0.3690) and BMI (22.76±2.77 vs. 23.43±2.64; p=0.2138). There were also no statistically significant differences in heart rate, blood pressure, physical activity, stress awareness, hormone levels, or serum metabolic profiles, which allowed the assumption of intergroup comparability (Table 1).
|
|
EstroG-100® |
Placebo |
p-value |
|
|
Age (years) |
|
53.50±6.47 |
54.57±5.66 |
0.3690* |
|
BMI (kg/m2) |
|
22.76±2.77 |
23.43±2.64 |
0.2138* |
|
Heart rate (beats/min) |
|
74.10±10.11 |
75.00±8.00 |
0.6143* |
|
SBP (mmHg) |
|
120.00±13.52 |
119.87±12.18 |
0.9591* |
|
DBP (mmHg) |
|
74.10±10.48 |
72.00±10.12 |
0.3012* |
|
Physical activity (%) |
None |
34.00 |
31.48 |
0.7120‡ |
|
Low |
40.00 |
35.19 |
||
|
High |
26.00 |
33.33 |
||
|
Stress awareness (%) |
None |
0.00 |
0.00 |
0.0912‡ |
|
Moderate |
38.00 |
59.26 |
||
|
High |
42.00 |
25.93 |
||
|
Very high |
20.00 |
14.81 |
||
|
E2 (pg/mL) |
|
21.93±24.24 |
31.10±51.23 |
0.2413* |
|
FSH (mIU/mL) |
|
60.74±32.30 |
57.78±32.56 |
0.6429* |
|
Endometrial thickness (mm) |
|
4.88±5.20 |
4.37±3.39 |
0.5600* |
|
RBC (M/μL) |
|
4.43±0.29 |
4.34±0.27 |
0.0946* |
|
Hemoglobin (g/dL) |
|
13.54±0.83 |
13.24±0.97 |
0.0856* |
|
Hematocrit (%) |
|
40.19±2.51 |
39.23±2.59 |
0.0580* |
|
WBC (K/μL) |
|
5.86±1.23 |
6.07±1.34 |
0.4055* |
|
Platelets (K/μL) |
|
239.84±40.75 |
241.06±40.51 |
0.8791* |
|
AST (IU/L) |
|
22.70±5.32 |
24.44±8.35 |
0.2037* |
|
ALT(IU/L) |
|
18.54±8.99 |
20.65±11.93 |
0.3091* |
|
Protein (g/dL) |
|
7.19±0.41 |
7.20±0.36 |
0.8352* |
|
Albumin (g/dL) |
|
4.47±0.24 |
4.46±0.20 |
0.8766* |
|
ALP (IU/L) |
|
60.32±16.82 |
64.76±20.07 |
0.2263* |
|
Total cholesterol (mg/dL) |
|
212.44±36.83 |
203.67±34.91 |
0.2152* |
|
Triglycerides (mg/dL) |
|
95.98±37.13 |
107.93±65.66 |
0.2523* |
|
HDL cholesterol (mg/dL) |
|
61.88±12.00 |
59.09±14.23 |
0.2847* |
|
LDL cholesterol (mg/dL) |
|
129.72±34.43 |
125.69±33.75 |
0.5477* |
|
Glucose (mg/dL) |
|
94.72±8.92 |
96.67±7.45 |
0.2286* |
|
Creatinine (mg/dL) |
|
0.73±0.14 |
0.74±0.13 |
0.7802* |
Table 1: Demographic characteristics (Safety set).
Values are presented as mean±SD.
*Comparison between groups; p-value by two-sample t-test.
‡Comparison between groups; p-value by chi-square test
(BMI, body mass index; SBP, systolic blood pressure; DBP, diastolic blood pressure; E2, estradiol; FSH, follicle-stimulating hormone; RBC, red blood cell; WBC, white blood cell; AST, aspartate aminotransferase; ALT, alanine aminotransferase; ALP, alkaline phosphatase; HDL, high-density lipoprotein; LDL, low-density lipoprotein)
Primary efficacy endpoint
Table 2 presents the results of FAS analysis of the total modified KMI scores measured at weeks 0, 4, and 12. Regarding the changes in the total modified KMI score of the FAS treatment group, decrease of 11.94±10.41 and 20.31±12.07 was observed in the EstroG-100® group at weeks 4 and 12, respectively (p<0.0001), and decreases of 8.78±8.66 and 14.10±13.51 was observed in the control group at weeks 4 and 12, respectively (p<0.0001). Statistically significant intergroup differences were observed at week 12 (p=0.0089*, p=0.0163$) (Table 2 and Figure 2).
|
|
|
EstroG-100® (N=49) |
Placebo (N=50) |
p-value* |
p-value$ |
|
Total KMI score |
Week 0 (Baseline) |
35.14±8.11 |
33.48±7.80 |
0.3011 |
0.3946 |
|
Week 4 Change from baseline |
23.20±9.25 |
24.70±9.36 |
|
|
|
|
-11.94±10.41 |
-8.78±8.66 |
0.0518 |
0.1209 |
||
|
Week 12 Change from baseline |
14.84±9.94 |
19.38±10.43 |
|
|
|
|
-20.31±12.07 |
-14.10±13.51 |
0.0089 |
0.0163 |
Table 2: Mean change in the modified Kupperman Menopause Index (FAS).
Values are presented as mean±SD.
*: Comparison between groups; p-value by two sample t-test
$: Comparison between groups; p-value by Wilcoxon rank-sum test
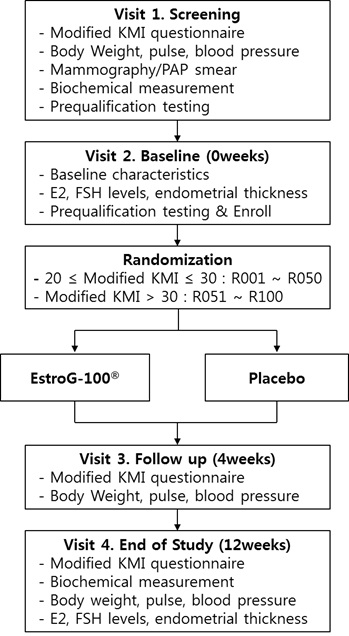 Figure 2: Schematic of study.
Secondary efficacy endpoints
Change in the modified KMI score by category
Table 3 presents the results of the FAS analysis of the changes in the modified KMI individual item scores at 0, 4 and 12 weeks. The FAS analysis of hot, there were no statistically significant decrease of 2.29±4.00 (p=0.0002) at weeks 4, and 5.06±4.38 (p<0.0001) at week 12 in the EstroG-100® group, with no statistically significant intergroup differences. The PPS analysis of hot flash severity revealed a decrease of 2.33±4.03 (p=0.0002) at week 4 and 5.17±4.36 (p<0.0001) at week 12 in the EstroG-100® group, and 1.67±3.39 (p<0.0001) at week 4 and 3.50±4.64 (p<.0001) at week 12 in the placebo group, showing statistically significant intergroup differences at week 12 (p=0.0365*, p=0.0362$) (Supplementary data Table S2) (Figure 3).
|
|
|
EstroG-100® (N=49) |
Placebo (N=50) |
p-value* |
p-value$ |
|
Hot flashes or cold sweats (=vasomotor symptoms) |
Week 0 (Baseline) |
8.41±3.67 |
8.56±3.43 |
0.8321 |
0.9047 |
|
Week 4 |
6.12±3.84 |
6.88±3.53 |
|
|
|
|
Change from baseline |
-2.29±4.00 |
-1.68±3.34 |
0.2076 |
0.1536 |
|
|
Week 12 |
3.35±3.68 |
4.80±3.43 |
|
|
|
|
Change from baseline |
-5.06±4.38 |
-3.76±4.74 |
0.0797 |
0.0842 |
|
|
Numbness and tingling (=paresthesia) |
Week 0 (Baseline) |
4.16±1.62 |
3.76±1.70 |
0.2302 |
0.2362 |
|
Week 4 |
2.57±1.68 |
2.88±1.81 |
|
|
|
|
Change from baseline |
-1.59±1.73 |
-0.88±1.81 |
0.0243 |
0.0264 |
|
|
Week 12 |
1.88±1.70 |
2.36±1.88 |
|
|
|
|
Change from baseline |
-2.29±2.08 |
-1.40±2.40 |
0.0264 |
0.0319 |
|
|
Trouble sleeping (=insomnia) |
Week 0 (Baseline) |
4.86±1.58 |
4.52±1.50 |
0.2793 |
0.1751 |
|
Week 4 |
3.02±2.01 |
2.96±2.22 |
|
|
|
|
Change from baseline |
-1.84±2.15 |
-1.56±2.19 |
0.2637 |
0.1937 |
|
|
Week 12 |
2.12±1.98 |
2.40±2.14 |
|
|
|
|
Change from baseline |
-2.73±2.26 |
-2.12±2.44 |
0.0984 |
0.0778 |
|
|
Nervousness |
Week 0 (Baseline) |
4.61±1.37 |
4.24±1.70 |
0.2328 |
0.3401 |
|
Week 4 |
3.06±1.69 |
3.04±1.91 |
|
|
|
|
Change from baseline |
-1.55±1.74 |
-1.20±1.67 |
0.1542 |
0.1838 |
|
|
Week 12 |
1.84±1.57 |
2.28±1.71 |
|
|
|
|
Change from baseline |
-2.78±1.99 |
-1.96±2.04 |
0.0235 |
0.0173 |
|
|
Feeling blue or depressed (=melancholia) |
Week 0 (Baseline) |
2.10±0.80 |
1.88±0.80 |
0.1695 |
0.1479 |
|
Week 4 |
1.41±0.70 |
1.26±0.88 |
|
|
|
|
Change from baseline |
-0.69±0.94 |
-0.62±0.83 |
0.3396 |
0.3016 |
|
|
Week 12 |
0.90±0.77 |
1.12±0.69 |
|
|
|
|
Change from baseline |
-1.20±1.02 |
-0.76±1.00 |
0.0156 |
0.0189 |
|
|
Dizzy spells (=vertigo) |
Week 0 (Baseline) |
1.63±0.88 |
1.60±0.95 |
0.8596 |
0.8944 |
|
Week 4 |
1.14±0.89 |
1.14±0.83 |
|
|
|
|
Change from baseline |
-0.49±0.94 |
-0.46±1.07 |
0.4417 |
0.4985 |
|
|
Week 12 |
0.67±0.80 |
1.08±0.85 |
|
|
|
|
Change from baseline |
-0.96±0.89 |
-0.52±1.23 |
0.0223 |
0.0253 |
|
|
Feeling tired (=fatigue) |
Week 0 (Baseline) |
2.47±0.65 |
2.12±0.80 |
0.0190 |
0.0257 |
|
Week 4 |
1.78±0.92 |
1.72±0.88 |
|
|
|
|
Change from baseline |
-0.69±0.87 |
-0.40±0.76 |
0.0380 |
0.0633 |
|
|
Week 12 |
1.27±0.93 |
1.46±0.86 |
|
|
|
|
Change from baseline |
-1.20±1.02 |
-0.66±1.06 |
0.0054 |
0.0101 |
|
|
Arthralgia and myalgia |
Week 0 (Baseline) |
2.18±0.70 |
2.22±0.86 |
0.8186 |
0.5945 |
|
Week 4 |
1.41±0.93 |
1.76±0.96 |
|
|
|
|
Change from baseline |
-0.78±0.96 |
-0.46±0.84 |
0.0425 |
0.0235 |
|
|
Week 12 |
0.96±0.96 |
1.42±0.86 |
|
|
|
|
Change from baseline |
-1.22±0.98 |
-0.80±1.05 |
0.0204 |
0.0155 |
|
|
Headaches |
Week 0 (Baseline) |
1.65±1.03 |
1.66±0.92 |
0.9718 |
0.9327 |
|
Week 4 |
0.98±0.85 |
1.08±0.99 |
|
|
|
|
Change from baseline |
-0.67±0.99 |
-0.58±0.99 |
0.3197 |
0.2721 |
|
|
Week 12 |
0.73±0.78 |
0.88±0.92 |
|
|
|
|
Change from baseline |
-0.92±1.10 |
-0.78±1.07 |
0.2637 |
0.3149 |
|
|
Pounding of the heart (=palpitations) |
Week 0 (Baseline) |
1.80±0.89 |
1.80±0.90 |
0.9820 |
0.9348 |
|
Week 4 |
1.08±0.81 |
1.16±0.93 |
|
|
|
|
Change from baseline |
-0.71±0.96 |
-0.64±1.05 |
0.3566 |
0.3518 |
|
|
Week 12 |
0.65±0.72 |
0.88±0.80 |
|
|
|
|
Change from baseline |
-1.14±1.02 |
-0.92±1.18 |
0.1583 |
0.2279 |
|
|
Sensation of crawling |
Week 0 (Baseline) |
1.27±1.06 |
1.12±0.92 |
0.4665 |
0.5559 |
|
Week 4 |
0.63±0.81 |
0.82±0.87 |
|
|
|
|
Change from baseline |
-0.63±1.09 |
-0.30±1.04 |
0.0616 |
0.0798 |
|
|
Week 12 |
0.47±0.77 |
0.70±0.81 |
|
|
|
|
Change from baseline |
-0.80±1.06 |
-0.42±0.97 |
0.0344 |
0.0699 |
Table 3: Mean change in the scores of the individual items of the modified KMI.
Values are presented as mean±SD.
*: Comparison between groups; p-value by two sample t-test
$: Comparison between groups; p-value by Wilcoxon rank-sum test
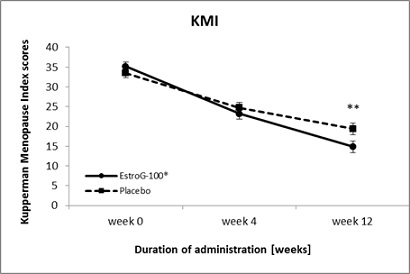 Figure 3: Changes in the Kupperman Menopause Index (mean±SE) during 12 weeks of administration of EstroG-100® and placebo (FAS). (SE: Standard Error, *: Statistically significant comparison between groups; p < 0.05, **: Statistically significant comparison between groups; p < 0.01 by t-test).
Symptoms of paresthesia decreased by 1.59±1.73 (p < 0.0001) at week 4 and 2.29±2.08 (p < 0.0001) at week 12 in the EstroG-100® group, respectively, and 0.88±1.81 (p=0.0012) and 1.40±2.40 (p=0.0001) at week 4 and week 12, respectively in the control group, showing statistically significant intergroup differences at week 4 (p=0.0243*, p=0.0264$) and week 12 (p=0.0264*, p=0.0319$). Symptoms of insomnia decreased by 1.84±2.15 (p < 0.0001) at week 4 and 2.73±2.26 (p < 0.0001) at week 12 in the EstroG-100® group, and no significant intergroup differences were observed.
Symptoms of nervousness decreased by 1.55±1.74 (p < 0.0001) at week 4 and 2.78±1.99 (p < 0.0001) at week 12 in the EstroG-100® group, and 1.20±1.67 (p < 0.0001) at week 4 and 1.96±2.04 (p < 0.0001) at week 12 in the control group, showing statistically significant intergroup differences at week 12 (p=0.0235*, p=0.0173$). Symptoms of melancholia decreased by 0.69±0.94 (p < 0.0001) at week 4 and 1.20±1.02 (p < 0.0001) at week 12 in the EstroG-100® group, and 0.62±0.83 (p < 0.0001) at week 4 and 0.76±1.00 (p < 0.0001) at week 12 in the control group, showing statistically significant intergroup differences at week 12 (p=0.0156*, p=0.0189$). Symptoms of vertigo decreased by 0.49±0.94 (p=0.0006) at week 4 and 0.96±0.89 (p < 0.0001) at week 12 in the EstroG-100® group, and 0.46±1.07 (p=0.0039) at week 4 and 0.52±1.23 (p=0.0044) at week 12 in the control group, showing statistically significant intergroup differences at week 12 (p=0.0223*, p=0.0253$).
Symptoms of fatigue decreased by 0.69±0.87 (p<0.0001) at week 4 and 1.20±1.02 (p<0.0001) at week 12 in the EstroG-100® group, and 0.40±0.76 (p=0.0005) at week 4 and 0.66±1.06 (p=0.0001) at week 12 in the control group, showing statistically significant intergroup differences at both week 4 (p=0.0380*, 0.0633$) and week 12 (p=0.0054*, p=0.0101$). Symptoms of arthralgia and myalgia decreased by 0.78±0.96 (p<0.0001) at week 4 and 1.22±0.98 (p<0.0001) at week 12 in the EstroG-100® group, and 0.46±0.84 (p=0.0003) at week 4 and 0.80±1.05 (p<0.0001) at week 12 in the control group, showing statistically significant intergroup differences at both week 4 (p=0.0425*, p=0.0235$) and week 12 (p=0.0204*, p=0.0155$).
Headaches decreased by 0.67±0.99 (p < 0.0001) at week 4 and 0.92±1.10 (p<0.0001) at week 12 in the EstroG-100® group, with no significant intergroup differences at weeks 4 or 12. Palpitations decreased by 0.71±0.96 (p < 0.0001) at week 4 and by 1.14±1.02 (p < 0.0001) at week 12 in the EstroG-100® group, with no significant intergroup differences at weeks 4 or 12. Symptoms of formication decreased by 0.63±1.09 (p=0.0002) at week 4 and 0.80±1.06 (p < 0.0001) at week 12 in the EstroG-100® group, and 0.30±1.04 (p=0.0458), week 4 and 0.42±0.97 (p=0.0036) at week 12 in the control group, showing statistically significant intergroup differences at week 12 (p=0.0344*).
Changes in vaginal dryness
The FAS analysis of the changes in the symptoms of vaginal dryness and reduced fluid secretion revealed a decrease of 0.67±0.94 (p < 0.0001) at week 4 and 1.00±0.98 (p < 0.0001) at week 12 in the EstroG-100® group, and a decrease of 0.58±1.13 (p=0.0007) at week 4 and 0.68±1.20 (p=0.0002) at week 12 in the control group. Significant intergroup differences were not observed at weeks 4 or 12 (Table 4). The PPS analysis of changes in the symptoms of vaginal dryness and reduced fluid secretion revealed a decrease of 0.67±0.95 (p < 0.0001) at week 4 and 1.00±0.99 (p < 0.0001) at week 12 in the EstroG-100® group, and a decrease of 0.56±1.13 (p=0.0012) at week 4 and 0.63±1.20 (p=0.0007) at week 12 in the control group, showing statistically significant intergroup differences at week 12 (p=0.0488*) (Supplementary data Table S3). PPS analysis of changes in the individual items of the modified KMI yielded results similar to those of the FAS analysis, except for hot flashes, vaginal dryness and reduced fluid secretion.
|
|
|
EstroG-100® (N=49) |
Placebo (N=50) |
p-value* |
p-value$ |
|
Vaginal dryness |
Week 0 (Baseline) |
2.10±0.82 |
2.04±0.88 |
0.7180 |
0.8057 |
|
Week 4 Change from baseline |
1.43±1.10 |
1.46±1.11 |
|
|
|
|
-0.67±0.94 |
-0.58±1.13 |
0.3279 |
0.3469 |
||
|
Week 12 Change from baseline |
1.10±1.12 |
1.36±1.08 |
|
|
|
|
-1.00±0.98 |
-0.68±1.20 |
0.0751 |
0.1039 |
Table 4: Mean changes in the scores of vaginal dryness.
Values are presented as mean±SD.
*: Comparison between groups; p-value by two sample t-test
$: Comparison between groups; p-value by Wilcoxon rank-sum test
Safety
As the main analysis of safety, Safety Set (SS) analysis was performed on the data from 104 participants (50 and 54 in the treatment and control groups, respectively) whose safety information was gathered from those who were randomly assigned to either group and received either EstroG-100® or placebo at least once. The incidence and types of adverse events were measured, and the results of clinical laboratory tests (hematology, blood chemistry and urinalysis), hormone (E2 and FSH) levels, endometrial thickness, BMI and vital signs (heart rate and blood pressure) were analyzed.
Adverse events
A total of 20 cases of adverse events (12 cases in eight participants in the treatment group and eight cases in six participants in the control group) were identified in this clinical trial (p=0.4655). None of these events led to trial dropouts. Table 5 outlines the incidence of adverse events. Of the 20 cases, 12 mild cases were identified in the treatment group, and seven mild and one moderate case were identified in the control group, showing no statistically significant intergroup differences (p=0.4000). Of the 12 cases of adverse events in the treatment group, two were “probably related,” seven were “judged to be unrelated,” and three were “definitely unrelated.” Of the eight cases of adverse events in the control group, two were “probably related and six were un-related.” The association with the test or control products could not be ruled out in four cases (two each in the treatment and control groups). All participants continued to take the test or control products, and all adverse events were resolved by completion of the clinical trial.
|
System organ class |
EstroG-100® (N=50) |
Placebo (N=54) |
||
|
case |
Incident rate (%) |
case |
Incident rate (%) |
|
|
Cardiac disorders |
1 |
8.33 |
0 |
0.00 |
|
Eye disorders |
1 |
8.33 |
1 |
12.50 |
|
Gastrointestinal disorders |
2 |
16.67 |
0 |
0.00 |
|
Hepatobiliary disorders |
0 |
0.00 |
2 |
25.00 |
|
Metabolic and nutritional disorders |
1 |
8.33 |
0 |
0.00 |
|
Musculoskeletal and connective tissue disorders |
1 |
8.33 |
3 |
37.50 |
|
Nervous system disorders |
1 |
8.33 |
1 |
12.50 |
|
Renal and urinary disorders |
1 |
8.33 |
0 |
0.00 |
|
Reproductive system and breast disorders |
1 |
8.33 |
0 |
0.00 |
|
Respiratory, thoracic and mediastinal disorders |
1 |
8.33 |
1 |
12.50 |
|
Skin and subcutaneous tissue disorders |
2 |
16.67 |
0 |
0.00 |
|
Total |
12 |
100.00 |
8 |
100.00 |
Table 5: Classification of adverse events.
All within- and between-group differences in the changes in hematological and hematochemical parameters were within the normal range or judged to have no statistical significance by the PI, even when lying outside the normal range. The urine test results were classified based on normal and abnormal values, and the pre- and post-treatment values of individual participants were compared using the McNemar test, through which no clinically significant pre- and post-treatment differences were identified. No statistically significant intergroup differences were observed in the changes in vital signs (heart rate and blood pressure) or weight at weeks 4 and 12.
Changes in E2 and FSH levels
Table 6 outlines the changes in the E2 and FSH levels at week 12. SS analysis revealed an increase in the E2 level by 5.33±38.81 at week 12 (p=0.3363) in the EstroG-100® group and a decrease of 8.71±39.55 at week 12 (p=0.1115) in the placebo group, but without statistically significant within- and between-group differences (p=0.0709). The FSH level increased by 2.29±15.50 at week 12 (p=0.3007) in the EstroG-100® group and by 1.71±14.67 at week 12 (p=0.3943) in the control group, but the difference was not statistically significant (p=0.8452).
|
|
|
EstroG-100® (N=50) |
Placebo (N=54) |
p-value* |
|
E2 (pg/mL) |
Week 0 (Baseline) |
21.93±24.24 |
31.10±51.23 |
0.2413 |
|
Week 12 |
27.26±41.37 |
22.39±32.77 |
|
|
|
Change from baseline |
5.33±38.81 |
-8.71±39.55 |
0.0709 |
|
|
P-value** |
0.3363 |
0.1115 |
|
|
|
FSH (mIU/mL) |
Week 0 (Baseline) |
60.74±32.30 |
57.78±32.56 |
0.6429 |
|
Week 12 |
63.03±32.71 |
59.49±28.93 |
|
|
|
Change from baseline |
2.29±15.50 |
1.71±14.67 |
0.8452 |
|
|
p-value** |
0.3007 |
0.3943 |
|
Table 6: Changes in E2 and FSH levels.
Values are presented as mean±SD.
*: Comparison between groups; p-value by two sample t-test
**: Comparison within groups; p-value by paired t-test
Changes in endometrial thickness
Table 7 presents the changes in endometrial thickness at week 12. A decrease of 0.22±2.13 was observed in the EstroG-100® group (p=0.4768) and of 0.69±2.98 in the control group (p=0.0938). The within- and between-group difference was not statistically significant (p=0.3482).
|
|
|
EstroG-100® (N=50) |
Placebo (N=54) |
p-value* |
|
Endometrial thickness (mm) |
Week 0 (Baseline) |
4.88±5.20 |
4.37±3.39 |
0.5600 |
|
Week 12 |
4.66±4.38 |
3.68±1.60 |
|
|
|
Change from baseline |
-0.22±2.13 |
-0.69±2.98 |
0.3482 |
|
|
p-value** |
0.4768 |
0.0938 |
|
Table 7: Changes in endometrial thickness.
Values are presented as mean±SD.
*: Comparison between groups; p-value by two sample t-test
**: Comparison within groups; p-value by paired t-test
Discussion
A total of 122 volunteers were screened and 105 eligible participants were randomized to either the treatment group (n=51) or the control group (n=54). No intergroup differences were observed in age, weight, BMI and blood pressure. Moreover, no intergroup differences were observed in baseline breast and cervical cancer screening results, comorbidities, or medical histories. The FAS analysis was chosen as the main analysis of this clinical trial. Three participants dropped out after randomization, and another three were excluded due to violation of the selection criteria. Finally, 99 participants (49 in the treatment group and 50 in the control group) were included in FAS analysis. The FAS analysis revealed a decrease of 20.31±12.07 in the total modified KMI score at week 12 (week 0:35.14±8.11, week 12:14.84±9.94) in the EstroG-100® group compared with that in the control group (p<0.01) (week 0:33.48±7.80, week 12:19.38±10.43). The PPS analysis revealed a decrease of 12.02±10.50 (p < 0.01) and 8.69±8.80 (p < 0.01) at week 4 in the EstroG-100® and placebo groups, respectively, and 20.56±12.06 (p < 0.01) and 13.40±13.30 (p < 0.01) at week 12, respectively, showing statistically significant intergroup differences at both week 4 (p < 0.05) and week 12 (p < 0.01). The FAS analysis revealed a decrease in the total modified KMI score, a measure of menopausal symptoms, at week 12 in the EstroG-100® group, showing a significant difference (p < 0.01) compared with that in the control group. The PPS analysis revealed a decrease at weeks 4 and week12 in the EstroG-100®, showing statistically significant intergroup differences at both week 4 (p < 0.05) and week 12 (p < 0.01).
Among the individual items in the modified KMI, paresthesia, nervousness, melancholia, vertigo, fatigue, arthralgia and myalgia, formication (p < 0.05), and fatigue (p < 0.01) in the EstroG-100® group showed statistically significant improvement compared with the control group. Thus, the improvement in seven of the 12 modified KMI items was verified.
Additionally, the PPS analysis showed an improvement in vasomotor symptoms, with a decrease of 5.17±4.36 (p < 0.01) at week 12 in the EstroG-100® group, showing a statistically significant intergroup difference at week 12 (p < 0.05). Similarly, the PPS analysis of the changes in vaginal dryness and reduction of fluid secretion revealed a decrease of 1.00±0.99 (p < 0.01) at week 12 in the EstroG-100® group, showing a statistically significant intergroup difference at week 12 (p < 0.05). Safety evaluation showed no statistically significant changes in weight, BMI, or blood pressure at week 12. The clinical laboratory tests also did not reveal any significant changes, and any observed changes were judged to lie within the normal range by the PI. Similarly, pre-and post-treatment measurements of E2 and FSH levels and endometrial thickness did not show any statistically significant intergroup differences at week 12.
Various physiological activities have been reported, such as anti-inflammatory, antioxidant, anti-cancer, and anti-arteriosclerosis, similar to the effects of Cynanchum wilfordii Hemsley, Phlomis umbrosa Turczaninow, and Angelica gigas Nakai [22,23]. EstroG-100®, with combined extracts from these three herbs, was shown to improve various menopausal symptoms, such as arthritis [24], depression [25], hot flash (vasomotor symptoms) [26], osteoporosis [27], fatigue and sleep disorders.
In addition, no estrogenic effect was observed in the estrogen receptor affinity test, human breast and cervical cancer cell tests, or uterotrophic tests using ovariectomized animals [28]. With no toxic effects shown in a single-dose toxicity study, a 26-week repeated dose toxicity test, or a genotoxicity test, it has also been proven to be effective in improving menopausal symptoms without side effects secondary to estrogenic activity. In conclusion, EstroG-100® was demonstrated to be a safe and effective natural material for improving the quality of life of perimenopausal women by alleviating various menopausal symptoms, thus supporting the results of previous studies.
Conflicts of Interest
The authors have no conflicts of interest relevant to this article.
Declaration of Competing Interest
The authors have no conflicts of interest relevant to this article.
Acknowledgment
This work was carried out with the support of the “Cooperative Research Program for Agriculture Science & Technology Development (Project No. PJ009050)” Rural Development Administration, Republic of Korea.
References
- Greendale GA, Lee NP, Arriola ER (1999) The menopause. Lancet 353: 571-580.
- McKinlay SM, Brambilla DJ, Posner JG (1992) The normal menopause transition. Maturitas 14: 103-115.
- Beyene Y (1986) Cultural significance and physiological manifestations of menopause. A biocultural analysis. Cult Med Psychiatry 10: 47-71.
- Milsom I, Ekelund P, Molander U, Arvidsson L, Areskoug B (1993) The influence of age, parity, oral contraception, hysterectomy and menopause on the prevalence of urinary incontinence in women. J Urol 149: 1459-1462.
- Hilton P, Tweddell AL, Mayne C (1990) Oral and intravaginal estrogens alone and in combination with alpha-adrenergic stimulation in genuine stress incontinence. Int Urogynecol J 1: 80-86.
- Stone SC, Mickal A, Rye PH (1975) Postmenopausal symptomatology, maturation index, and plasma estrogen levels. Obstet Gynecol 45: 625-627.
- Greendale GA, Hogan P, Shumaker S (1996) Sexual functioning in postmenopausal women: the postmenopausal estrogen/progestin interventions (PEPI) trial. J Womens Health 5: 445-458.
- Diokno AC, Brown MB, Herzog AR (1990) Sexual function in the elderly. Arch Intern Med 150: 197-200.
- Pearlstein T, Rosen K, Stone AB (1997) Mood disorders and menopause. Endocrinol Metab Clin North Am 26: 279-294.
- Vivian-Taylor J, Hickey M (2014) Menopause and depression: is there a link? Maturitas 79: 142-146.
- Gordon T, Kannel WB, Hjortland MC, McNamara PM (1978) Menopause and coronary heart disease. The Framingham Study. Ann Intern Med 89: 157-161.
- Rosano GM, Vitale C, Marazzi G, Volterrani M (2007) Menopause and cardiovascular disease: the evidence. Climacteric 1: 19-24.
- Ahlborg HG, Johnell O, Turner CH, Rannevik G, Karlsson MK (2003) Bone loss and bone size after menopause. N Engl J Med 349: 327-334.
- Grady D, Rubin SM, Petitti DB, Fox CS, Black D, et al. (1992) Hormone therapy to prevent disease and prolong life in postmenopausal women. Ann Intern Med 117: 1016-1037.
- Rossouw JE, Anderson GL, Prentice RL, LaCroix AZ, Kooperberg C, et al. (2002) Risks and benefits of estrogen plus progestin in healthy postmenopausal women: Principal results From the Women's Health Initiative randomized controlled trial. JAMA 288: 321-333.
- Eisenberg DM, Davis RB, Ettner SL, Appel S, Wilkey S, et al. (1998) Trends in alternative medicine use in the United States, 1990-1997: Results of a follow-up national survey. JAMA 280: 1569-1575.
- Seidl MM, Stewart DE (1998) Alternative treatments for menopausal symptoms. Systematic review of scientific and lay literature. Can Fam Physician 44: 1299-1308.
- Dailey RK, Neale AV, Northrup J, West P, Schwartz KL (2003) Herbal product use and menopause symptom relief in primary care patients: A MetroNet study. J Womens Health (Larchmt) 12: 633-641.
- Huntley AL, Ernst E (2003) A systematic review of herbal medicinal products for the treatment of menopausal symptoms. Menopause 10: 465-476.
- Lee KH, Lee DJ, Kim SM, Je SH, Kim EK, et al. (2005) Evaluation of effectiveness and safety of natural plants extract (Estromon®) on perimenopausal women for 1 year. J Menopausal Med 11: 16-26.
- Chang A, Kwak BY, Yi K, Kim JS (2012) The effect of herbal extract (EstroG-100) on pre-, peri- and post-menopausal women: A randomized double-blind, placebo-controlled study. Phytother Res 26: 510-516.
- Kim SJ, Kang SM, Ko KH, Nam SH (2016) Physiological activities and inhibitory effect of extracts of Cynanchi wilfordii Radix and Perilla sikokiana against cell differentiation in 3T3-L1 adipocytes. J Korean Soc Food Sci Nutr 45: 642-650.
- Ma Y-F, Jung J-Y, Jung Y-J, Choi J-H, Jeong W-S, et al. (2009) Anti-inflammatory activities of coumarins isolated from Angelica gigas Nakai on LPS-stimulated RAW 264.7 cells. Prev Nutr Food Sci 14: 179-187.
- Kim J, Yang S, Choi CY (2016) The Evaluation of the Effect of Herbal Extract on Osteoarthritis: In Vitro and In Vivo Prev Nutr Food Sci 21: 310-316.
- Oh K-N, Oh D-R, Jung M-A, Kim Y-J, Choi E-J, et al. (2018) Antidepressant effects of Cynanchum wilfordii Hemsley, Phlomis umbrosa Turcz, and Angelica gigas Nakai via inhibition of 5-HT6 receptor-mediated cyclic AMP activity. J Physiol Pathol Korean Me 32: 247-254.
- Lee G, Kim JY, Kang HW, Park SY, Hong JK, et al. (2018) Effects of herbal mixture extract on menopausal hot flashes and pharmacokinetics in ovariectomized rat models. J Food Nutr Res 6: 116-123.
- Kim SN, Li YC, Xu HD, Yi DG, Kim MS, et al. (2008) Phytoestrogenic effects of combined plant extracts on the change of bone metabolism of OVX rats. Korean J Food Sci Technol 40: 316-320.
- Kim SJ, Jin SW, Lee GH, Kim YA, Jeong HG (2017) Evaluation of Estrogenic Activity of Extract from the Herbal Mixture Cynanchum wilfordii Hemsley , Phlomis umbrosa Turczaninow, and Angelica gigas Nakai. Toxicol Res 33: 71-77.
Supplementary Data
|
|
|
EstroG-100® (N=48) |
Placebo (N=48) |
p-value* |
p-value$ |
|
Total KMI score |
Week0 (Baseline) |
35.42±7.96 |
33.25±7.78 |
0.1809 |
0.2540 |
|
Week 4 |
23.40±9.25 |
24.56±9.34 |
|
|
|
|
Change from baseline |
-12.02±10.50 |
-8.69±8.80 |
0.0476 |
0.1075 |
|
|
Week 12 |
14.85±10.04 |
19.85±10.37 |
|
|
|
|
Change from baseline |
-20.56±12.06 |
-13.40±13.30 |
0.0034 |
0.0063 |
Table S1: Mean change in the modified Kupperman Menopause Index (PPS).
Values are presented as mean±SD.
*: Comparison between groups; p-value by two sample t-test
$: Comparison between groups; p-value by Wilcoxon rank-sum test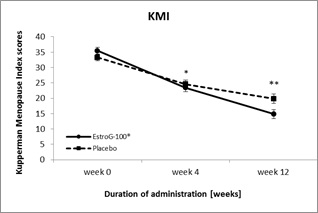 Figure S1: Changes in the modified Kupperman Menopause Index (mean±SE) during 12 weeks of EstroG-100® and placebo (PPS).
SE: Standard Error, *: Statistically significant comparison between groups; p < 0.05, **: Statistically significant comparison between groups; p < 0.01 by t-test
|
|
|
EstroG-100® (N=48) |
Placebo (N=48) |
p-value* |
p-value$ |
|
Hot flashes or cold sweats (=vasomotor symptoms) |
Week 0 (Baseline) |
8.58±3.50 |
8.42±3.43 |
0.8141 |
0.7866 |
|
Week 4 |
6.25±3.77 |
6.75±3.52 |
|
|
|
|
Change from baseline |
-2.33±4.03 |
-1.67±3.39 |
0.1912 |
0.1344 |
|
|
Week 12 |
3.42±3.69 |
4.92±3.43 |
|
|
|
|
Change from baseline |
-5.17±4.36 |
-3.50±4.64 |
0.0365 |
0.0362 |
|
|
Numbness and tingling (=paresthesia) |
Week 0 (Baseline) |
4.17±1.64 |
3.75±1.73 |
0.2294 |
0.2369 |
|
Week 4 |
2.54±1.69 |
2.92±1.80 |
|
|
|
|
Change from baseline |
-1.63±1.73 |
-0.83±1.79 |
0.0151 |
0.0167 |
|
|
Week 12 |
1.83±1.69 |
2.46±1.86 |
|
|
|
|
Change from baseline |
-2.33±2.08 |
-1.29±2.39 |
0.0124 |
0.0140 |
|
|
Trouble sleeping (=insomnia) |
Week 0 (Baseline) |
4.88±1.59 |
4.50±1.52 |
0.2404 |
0.1441 |
|
Week 4 |
3.08±1.98 |
2.88±2.22 |
|
|
|
|
Change from baseline |
-1.79±2.15 |
-1.63±2.21 |
0.3545 |
0.2836 |
|
|
Week 12 |
2.17±1.97 |
2.46±2.15 |
|
|
|
|
Change from baseline |
-2.71±2.28 |
-2.04±2.42 |
0.0841 |
0.0675 |
|
|
Nervousness |
Week 0 (Baseline) |
4.63±1.38 |
4.29±1.60 |
0.2764 |
0.3426 |
|
Week 4 |
3.04±1.70 |
3.08±1.89 |
|
|
|
|
Change from baseline |
-1.58±1.75 |
-1.21±1.69 |
0.1439 |
0.1660 |
|
|
Week 12 |
1.79±1.56 |
2.38±1.68 |
|
|
|
|
Change from baseline |
-2.83±1.97 |
-1.92±1.98 |
0.0126 |
0.0092 |
|
|
Feeling blue or depressed (=melancholia) |
Week 0 (Baseline) |
2.10±0.81 |
1.90±0.81 |
0.2081 |
0.1851 |
|
Week 4 |
1.42±0.71 |
1.29±0.87 |
|
|
|
|
Change from baseline |
-0.69±0.95 |
-0.60±0.82 |
0.3230 |
0.2970 |
|
|
Week 12 |
0.90±0.78 |
1.13±0.70 |
|
|
|
|
Change from baseline |
-1.21±1.03 |
-0.77±1.02 |
0.0194 |
0.0239 |
|
|
Dizzy spells (=vertigo) |
Week0 (Baseline) |
1.65±0.89 |
1.56±0.94 |
0.6567 |
0.6740 |
|
Week 4 |
1.17±0.88 |
1.06±0.76 |
|
|
|
|
Change from baseline |
-0.48±0.95 |
-0.50±1.07 |
0.5401 |
0.6125 |
|
|
Week 12 |
0.69±0.80 |
1.06±0.86 |
|
|
|
|
Change from baseline |
-0.96±0.90 |
-0.50±1.24 |
0.0204 |
0.0229 |
|
|
Feeling tired (=fatigue) |
Week 0 (Baseline) |
2.48±0.65 |
2.13±0.82 |
0.0209 |
0.0292 |
|
Week 4 |
1.77±0.93 |
1.73±0.89 |
|
|
|
|
Change from baseline |
-0.71±0.87 |
-0.40±0.76 |
0.0327 |
0.0526 |
|
|
Week 12 |
1.25±0.93 |
1.48±0.87 |
|
|
|
|
Change from baseline |
-1.23±1.02 |
-0.65±1.08 |
0.0038 |
0.0069 |
|
|
Arthralgia and myalgia |
Week 0 (Baseline) |
2.19±0.70 |
2.19±0.87 |
1.0000 |
0.7975 |
|
Week 4 |
1.38±0.91 |
1.75±0.96 |
|
|
|
|
Change from baseline |
-0.81±0.94 |
-0.44±0.82 |
0.0200 |
0.0106 |
|
|
Week 12 |
0.92±0.92 |
1.42±0.87 |
|
|
|
|
Change from baseline |
-1.27±0.94 |
-0.77±1.06 |
0.0081 |
0.0067 |
|
|
Headaches |
Week 0 (Baseline) |
1.69±1.01 |
1.63±0.91 |
0.7518 |
0.6693 |
|
Week 4 |
1.00±0.85 |
1.10±0.99 |
|
|
|
|
Change from baseline |
-0.69±0.99 |
-0.52±0.97 |
0.2035 |
0.1610 |
|
|
Week 12 |
0.75±0.79 |
0.92±0.92 |
|
|
|
|
Change from baseline |
-0.94±1.10 |
-0.71±1.03 |
0.1474 |
0.1890 |
|
|
Pounding of the heart (=palpitation) |
Week 0 (Baseline) |
1.79±0.90 |
1.79±0.90 |
1.0000 |
0.9472 |
|
Week 4 |
1.10±0.81 |
1.19±0.94 |
|
|
|
|
Change from baseline |
-0.69±0.95 |
-0.60±1.05 |
0.3418 |
0.3236 |
|
|
Week 12 |
0.67±0.72 |
0.92±0.79 |
|
|
|
|
Change from baseline |
-1.13±1.02 |
-0.88±1.16 |
0.1329 |
0.2031 |
|
|
Sensation of crawling |
Week 0 (Baseline) |
1.27±1.07 |
1.10±0.93 |
0.4162 |
0.4934 |
|
Week 4 |
0.65±0.81 |
0.81±0.87 |
|
|
|
|
Change from baseline |
-0.63±1.10 |
-0.29±1.05 |
0.0665 |
0.0870 |
|
|
Week 12 |
0.48±0.77 |
0.73±0.82 |
|
|
|
|
Change from baseline |
-0.79±1.07 |
-0.38±0.96 |
0.0238 |
0.0518 |
Table S2: Mean change in the scores of the individual symptoms of the modified Kupperman Menopause Index (PPS).
Values are presented as mean±SD.
*: Comparison between groups; p-value by two sample t-test
$: Comparison between groups; p-value by Wilcoxon rank-sum test
|
|
|
EstroG-100® (N=48) |
Placebo (N=48) |
p-value* |
p-value$ |
|
Vaginal dryness |
Week 0 (Baseline) |
2.13±0.82 |
2.04±0.90 |
0.6352 |
0.7343 |
|
Week 4 |
1.46±1.09 |
1.48±1.11 |
|
|
|
|
Change from baseline |
-0.67±0.95 |
-0.56±1.13 |
0.3131 |
0.0488 |
|
|
Week 12 |
1.13±1.12 |
1.42±1.07 |
|
|
|
|
Change from baseline |
-1.00±0.99 |
-0.63±1.20 |
0.3413 |
0.0654 |
Table S3: Mean change in the scores of vaginal dryness (PPS).
Values are presented as mean±SD.
*: Comparison between groups; p-value by two sample t-test
$: Comparison between groups; p-value by Wilcoxon rank-sum test
Citation: Kim T, Ryu K-J, Lee S, Lee D-J, Seo S-K (2022) A 12-Week, Multi-Center, Double-Blind, Randomized, Placebo-Controlled Clinical Trial for the Evaluation of the Efficacy and Safety of the Herbal Extract (EstroG-100®) on Menopausal Symptoms. J Reprod Med Gynecol Obstet 7: 0106.
Copyright: © 2022 Tak Kim, et al. This is an open-access article distributed under the terms of the Creative Commons Attribution License, which permits unrestricted use, distribution, and reproduction in any medium, provided the original author and source are credited.