Abnormal Sonohysterogram among Sub-Fertile Black Women in Sub-Saharan Africa
*Corresponding Author(s):
Afolabi BMHealth Environment And Development Foundation, 18 Ogunfunmi Street, Surulere, Lagos, Nigeria, African Pan African Health Alliance And Collaborative, Lagos, Nigeria
Tel:+234 8030490729,
Email:bmafolabi@gmail.com
Abstract
Objective: The aim of this study was to assess the reasons for failed Sonohysterogram (SHG) among women who presented with infertility and who wished to correct this condition and ascertain their pregnancy at Nordica Fertility Center (NFC) in Nigeria.
Study design: From January 2005 to December 2018, 2,458 patients who wished to correct their primary or secondary infertility consulted at NFC, Nigeria. Of these number, 1,964 had SHG examination, carried out by injection of an isotonic saline solution into the uterine cavity. A total of 45 patients were excluded due to incomplete data, leaving 1,919 patients whose records were eventually analyzed. Reasons why SHG was unsuccessful in some of the patients were documented.
Results: The highest proportions (1,011, 52.7%; 792, 41.3%) of the study subjects were aged between 36-45 years and were overweight. In all, 851 (44.3%) and 557 (29.0%) had undergone induced abortion or miscarriage while 1,481 (77.2%) were nulliparous. A total of 211 (11.0%) had failed SHG of whom were 101 (47.9%) aged 36-45 years and 72 (34.1%) normal weight women. Poor distention (85, 4.4%) was the most prevalent uterine reason for failed SHG, observed mainly among those aged 26-35 years and among normal weight and obese patients. Presence of sub-mucous and/or intramural fibroid (34, 1.8%) and Intrauterine Polyp (IUP) (34, 1.8%) were also reasons for failed SHG. Nulliparous women were over two times more likely to present with variable reasons for failed SHG (χ²=13.5, P-value=0.0002, OR=215, 95% CI: 1.42;3.28) than other sub-fertile women. Poor uterine distention significantly correlated with previous uterine surgery (r = 0.176, P-value=0.04), Caesarean section (r = -0.065, P-value = 0.004), Myomectomy (r = -0.110, P-value <<0.001) and with Dilatation and Curettage (r = - 0.071, P-value=0.002).
Conclusion: Nulliparous women and those with regular menses presented more with abnormal SHG. This study suggests that SHG should be performed for the primary investigation of infertility. Infertility clinicians should be acquainted with a wide range of possible observations at SHG and possible reasons for failure of the procedure.
Keywords
Black Africa; Female infertility; Intrauterine pathology; Nigeria; Sonohysterogram; Sub-Sahara
Introduction
Assessment of infertility warrants exploration of the central reproductive system, the uterus and its cavity, for any possible anomaly that may obstruct pregnancy. Geo-morphological abnormalities responsible for structural deformation of the uterus and its cavity may present unfavourable intrauterine environment and thus impair the outcome of the developing human fetus leading to failure of implantation, recurrent pregnancy loss, unprompted abortion, preterm labour, premature rupture of membranes or other deleterious events [1]. Such intrauterine abnormalities include but are not limited to adhesion, fibroid, polyps or congenital abnormalities of the Müllerian ducts [2], which are frequently encountered as factors that impair fertility. Many methods are used for the investigation of the uterus and its appendages among which are (i) hysteroscopy, an established “gold standard” for diagnosing intrauterine pathology [3], (ii) Hysterosalpingography (HSG) a widely used diagnostic tool, which, according to an early study, has an overall risk of infection of about 3% in a high risk population [4], (iii) trans-abdominal ultrasonography, which, for over three decades, has been used in monitoring follicular development and ovulation [5], (iv) transvaginal sonography for detecting polyps, submucosal myomas, endometrial hyperplasia and carcinomas [6] and Magnetic Resonance Imaging (MRI) which is limited in value because it consumes time and expenses [7]. Saline Infusion Sonohysterography (SIS) is a new diagnostic tool which allows demarcation of endometrial, submucosal and intrauterine cavity deformity [8]. However, this diagnostic tool is new in sub-Saharan Africa and where it is being used in this part of the world, there is no data on its usefulness and no data on reasons for failed or abnormal SHG. The purpose of this study was to document cases of failed or abnormal sonohysterography among infertile or sub-fertile sub-Saharan Black Africa women.
Materials and Methods
This was a retrospective study of infertile Black African women in sub-Sahara Africa who presented with various gynecological pathologies for assisted conception. Sono-hysterographic investigation of the uterine cavity, using Ultrasound Machine Voluson E6 (General Electric, USA) was used as part of the routine clinical work-up of 1,919 sub-fertile women between 2005 and 2018. The procedure involved the introduction of a small volume of fluid (normal saline) into the uterus to allow the endometrium (lining of the uterus) to be clearly visible on an ultrasound scan, and its regularity assessed. Simultaneously, the cavity of the uterus was also evaluated for any obvious abnormalities. This procedure was done during the first half of the menstrual cycle after the end of the menstrual flow. Other materials used for each patient included vaginal speculum, galipot (2), normal saline, volsellum, sponge holding forceps, gauze, medizaid disinfectant solution, 20 ml syringe, embryo transfer catheter and probe cover (condom). After emptying the bladder, each patient was asked to undress and wear a gown and afterwards asked to lie on her back on an examination couch and positioned with her legs apart. A speculum (an instrument used to hold open the vagina so that it and the cervix can be examined) was inserted into the vagina to expose and clean the cervix. A soft embryo transfer catheter (a thin plastic tube) was gently inserted into the vagina and into the uterus through the cervix. On removal of the speculum, the ultrasound probe was inserted into the vagina and a small amount of Normal Saline solution was introduced through the catheter into the uterine cavity. The saline fluid within the uterus allowed the lining of the uterus to be seen clearly on the ultrasound screen and also showed any abnormality in the cavity.
Small trickle of fluid from the vagina was noticed from most patients which was at times slightly blood-stained, and may continue for some hours after the procedure was over. Patients were counseled not to have any anxiety over this fluid as it was not of any consequence. The patient was also advised to use a sanitary pad, not tampons, for the rest of the day after the test. Most patients felt normal after the test with no after effects. Some patients complained of some pelvic discomfort (like a mild period pain) but this settled after a few minutes or up to an hour and was very uncommon. Mild analgesics were given if required. Some patients felt slight dizziness which resolved within a few minutes. All patients were generally well enough to drive home and resume normal activities, such as going back to work. Prophylactic antibiotics were given.
Passage of embryo transfer catheter assisted the attending gynecologist to discern the depth of the uterine cavity, to confirm that the cervical canal is open and also served as a mock transfer and a good guide to the actual embryo transfer. This procedure helped to highlight abnormalities in the uterine cavity such as thickening of the endometrium, polyps, scarring or sub-mucous fibroid, which helped to guide discussions between the attending Assisted Reproduction Therapy specialist and the patient about any further investigation or treatment that was needed.
Results
The means (±sd) of age and Body Mass Index (BMI) of the 1,919 sub-fertile women in this study were 38.86 (6.42) years and 28.05 (5.27) Kg/m2 respectively with median age (years) and median BMI (Kg/m2) as 39.00 and 27.42 severally. A total of 1,068 (55.7%) of the study participants have never had induced abortion in contrast to 851 (44.3%) who had, ranging from 5 (0.6%) of those aged ≤25 years to 498 (58.5%) of those aged 36-45 years, and from 12 (1.4%) of those with BMI of 2 to 377 (44.3%) of overweight women with BMI of 25.0-29.9 Kg/m2. Among those who had experienced miscarriage (557, 29.0%), only 2 (0.3%) were aged ≤25 years and 319 (57.3%) were aged 36-45 years; 4 (0.7%) were underweight (BMI 2) while 252 (45.2%) were overweight (BMI 25.0-29.9 Kg/m2) (Table 1).
|
Variable |
Sub-variable |
Freq. |
% |
Mean |
±sd |
SE |
Min. |
25%ile |
Median |
75%tile |
Max. |
|
|
Age (y) |
All |
1919 |
100.0 |
38.86 |
6.42 |
0.15 |
20.00 |
34.00 |
39.00 |
43.00 |
61.00 |
|
|
≤25 |
22 |
1.15 |
24.41 |
1.14 |
0.24 |
20.00 |
24.00 |
25.00 |
25.00 |
25.00 |
||
|
26-35 |
597 |
31.11 |
32.03 |
2.39 |
0.10 |
26.00 |
30.00 |
32.00 |
34.00 |
35.00 |
||
|
36-45 |
1011 |
52.68 |
40.23 |
2.80 |
0.09 |
36.00 |
38.00 |
40.00 |
43.00 |
45.00 |
||
|
>45 |
289 |
15.06 |
49.17 |
3.02 |
0.18 |
46.00 |
47.00 |
48.00 |
51.00 |
61.00 |
||
|
BMI (Kg/m2)
|
All |
1919 |
100.0 |
28.05 |
5.27 |
0.12 |
14.90 |
24.50 |
27.42 |
30.80 |
58.80 |
|
|
<18.5 |
24 |
1.25 |
17.11 |
0.84 |
0.17 |
14.90 |
16.92 |
17.15 |
17.67 |
18.24 |
||
|
18.5-24.9 |
512 |
26.68 |
22.68 |
1.61 |
0.07 |
18.50 |
21.75 |
23.00 |
24.00 |
24.95 |
||
|
25.0-29.9 |
792 |
41.27 |
27.29 |
1.20 |
0.05 |
25.00 |
26.00 |
27.28 |
28.37 |
29.93 |
||
|
≥30 |
591 |
30.80 |
34.17 |
4.15 |
0.17 |
30.00 |
31.21 |
33.16 |
35.79 |
58.80 |
||
|
Induced abortion
|
No |
1068 |
55.7 |
- |
- |
- |
- |
- |
- |
- |
- |
|
|
Yes |
851 |
44.3 |
1.90 |
1.12 |
0.04 |
1.00 |
1.00 |
2.00 |
2.00 |
7.00 |
||
|
If yes, at which age (y)
|
≤25 |
5 |
0.6 |
1.20 |
0.45 |
0.20 |
1.00 |
1.00 |
1.00 |
1.50 |
2.00 |
|
|
26-35 |
202 |
23.7 |
1.80 |
1.09 |
0.08 |
1.00 |
1.00 |
1.00 |
2.00 |
6.00 |
||
|
36-45 |
498 |
58.5 |
1.94 |
1.12 |
0.05 |
1.00 |
1.00 |
2.00 |
3.00 |
7.00 |
||
|
>45 |
146 |
17.2 |
1.93 |
1.12 |
0.10 |
1.00 |
1.00 |
2.00 |
2.00 |
5.00 |
||
|
If yes, at which BMI (Kg/m2) |
<18.5 |
12 |
1.4 |
2.58 |
1.38 |
0.40 |
1.00 |
1.00 |
3.00 |
3.75 |
5.00 |
|
|
18.5-24.9 |
191 |
22.4 |
1.90 |
1.10 |
0.08 |
1.00 |
1.00 |
2.00 |
2.00 |
6.00 |
||
|
25.0-29.9 |
377 |
44.3 |
1.89 |
1.16 |
0.06 |
1.00 |
1.00 |
1.00 |
2.00 |
7.00 |
||
|
≥30 |
271 |
31.9 |
1.89 |
1.06 |
0.06 |
1.00 |
1.00 |
2.00 |
2.00 |
6.00 |
||
|
Miscarriage
|
No |
1362 |
71 |
- |
- |
- |
- |
- |
- |
- |
- |
|
|
Yes |
557 |
29 |
1.7 |
1.17 |
0.05 |
1.00 |
1.00 |
1.00 |
2.00 |
8.00 |
||
|
If yes, age
|
≤25 |
2 |
0.3 |
1.00 |
0.00 |
0.00 |
1.00 |
1.00 |
1.00 |
1.00 |
1.00 |
|
|
26-35 |
133 |
23.9 |
1.81 |
1.36 |
0.12 |
1.00 |
1.00 |
1.00 |
2.00 |
8.00 |
||
|
36-45 |
319 |
57.3 |
1.63 |
1.11 |
0.06 |
1.00 |
1.00 |
1.00 |
2.00 |
8.00 |
||
|
>45 |
103 |
18.5 |
1.78 |
1.08 |
0.11 |
1.00 |
1.00 |
1.00 |
2.00 |
5.00 |
||
|
If yes, BMI
|
<18.5 |
4 |
0.7 |
1.50 |
0.58 |
0.29 |
1.00 |
1.00 |
1.50 |
2.00 |
2.00 |
|
|
18.5-24.9 |
112 |
20.1 |
1.46 |
0.85 |
0.08 |
1.00 |
1.00 |
1.00 |
2.00 |
5.00 |
||
|
25.0-29.9 |
252 |
45.2 |
1.77 |
1.23 |
0.08 |
1.00 |
1.00 |
1.00 |
2.00 |
8.00 |
||
|
≥30 |
189 |
34 |
1.75 |
1.24 |
0.09 |
1.00 |
1.00 |
1.00 |
2.00 |
8.00 |
||
Table 1: Demographic and gynecological characteristics of study subjects.
Figure 1 illustrates the histogram of parity of the study women, which shows that majority (1481, 77.2%) were nulliparous, and far lesser proportions were of parity of 1 (323, 16.8%), of 2 (74, 3.9%), of 3 (31, 1.6%) and parity of 4 (10 (0.5%).
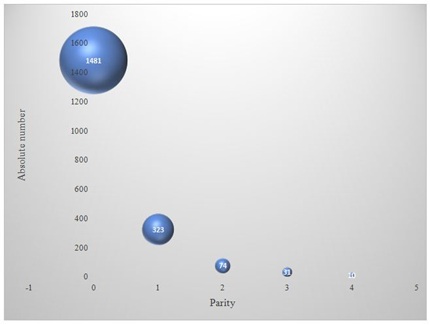 Figure 1: 3D-scatterplot of parity among the study group.
Parity of 0 = 1481 (77.2%); Parity of 1 = 323 (16.8%); Parity of 2 = 74 (3.9%); Parity of 3 = 31 (1.6%); Party of 4 = 10 (0.5%)
Reasons for failed Sonohysterogram (SHG) relative to age and relative to BMI of the study subjects are as shown in table 2.
|
Reason for failed sonohysterogram |
All
(n=1,919, %=100.0) |
Age (years) |
BMI (Kg/m2) |
|||||||
|
≤25
(n=22, %=1.15) |
26-35
(n=597, %=31.11) |
36-45
(n=1,011, 52.68%) |
>45
(n=289, 15.06%) |
<18.5
(n=24, %=1.25) |
18.5-24.9
(n=512, %=26.68) |
25.0-29.9
(n=792, %=41.27) |
≥30.0
(n=591, %=30.80) |
|||
|
Freq. (%) |
Freq. (%) |
Freq. (%) |
||||||||
|
Difficult catheterization |
2 (0.1) |
0 (0.0, 0.0)* |
1 (50.0, 0.2) |
1 (50.0, 0.1) |
0 (0.0, 0.0) |
0 (0.0, 0.0) |
0 (0.0, 0.0) |
1 (50.0, 0.13) |
1 (50.0, 0.17) |
|
|
Sub-mucous / intramural fibroid |
34 (1.8) |
0 (0.0, 0.0) |
14 (41.2, 2.4) |
20 (58.8, 2.0) |
0 (0.0, 0.0) |
0 (0.0, 0.0) |
12 (35.3, 2.3) |
13 (38.2, 1.6) |
9 (26.5, 1.5) |
|
|
Fair distention |
2 (0.1) |
0 (0.0, 0.0) |
1 (50.0, 0.2) |
1 (50.0, 0.1) |
0 (0.0, 0.0) |
0 (0.0, 0.0) |
0 (0.0, 0.0) |
0 (0.0, 0.0) |
2 (100.0 0.34) |
|
|
Poor distention |
85 (4.4) |
2 (2.4, 9.1) |
53 (62.4, 8.9) |
29 (34.1, 2.9) |
1 (1.2, 0.4) |
1 (1.2, 4.2) |
29 (34.1, 5.7) |
26 (30.6, 3.3) |
29 (34.1, 4.9) |
|
|
No distention |
7 (0.4) |
2 (28.6, 9.1) |
3 (42.9, 0.5) |
2 (28.6, 0.2) |
0 (0.0, 0.0) |
0 (0.0, 0.0) |
5 (71.4, 0.1) |
1 (14.3, 0.1) |
1 (14.3 0.2) |
|
|
Intrauterine polyp |
34 (1.8) |
1 (2.9, 4.5) |
8 (23.5, 1.3) |
25 (73.5, 2.5) |
0 (0.0, 0.0) |
0 (0.0, 0.0) |
11 (32.4, 2.2) |
8 (23.5, 1.0) |
15 (44.1, 2.5) |
|
|
Intrauterine adhesion |
18 (0.9) |
1 (5.6, 4.54) |
9 (50.0, 1.51) |
8 (44.4, 0.79) |
0 (0.0, 0.0) |
0 (0.0, 0.0) |
6 (33.3, 1.17) |
5 (27.8, 0.63) |
7 (38.9, 1.18) |
|
|
Intrauterine fluid |
5 (0.3) |
0 (0.0, 0.0) |
1 (20.0, 0.17) |
3 (60.0, 0.30) |
1 (20.0, 0.35) |
0 (0.0, 0.0) |
2 (40.0, 0.39) |
3 (60.0, 0.38) |
0 (0.0, 0.0) |
|
|
Cervical adhesion |
3 (0.2) |
0 (0.0, 0.0) |
0 (0.0, 0.0) |
3 (100.0, 0.30) |
0 (0.0, 0.0) |
0 (0.0, 0.0) |
1 (33.3, 0.20) |
1 (33.3, 0.13) |
1 (33.3, 0.17) |
|
|
Cervical stenosis |
20 (1.0) |
1 (5.0, 4.5) |
8 (40.0, 1.34) |
9 (45.0, 0.90) |
2 (10.0, 0.69) |
0 (0.0, 0.0) |
6 (30.0, 1.17) |
9 (45.0, 1.14) |
5 (25.0, 0.85) |
|
|
Chronic candidiasis |
1 (0.05) |
0 (0.0, 0.0) |
1 (100.0, 0.17) |
0 (0.0, 0.0) |
0 (0.0, 0.0) |
0 (0.0, 0.0) |
0 (0.0, 0.0) |
1 (100.0, 0.13) |
0 (0.0, 0.0) |
|
|
Total |
Freq. (%) |
211 (11.0) |
7 (3.3, 31.8) |
99 (47.0, 16.6) |
101 (47.9, 10.0) |
4 (1.9, 1.4) |
1 (0.5, 4.2) |
72 (34.1, 14.1) |
68 (32.2, 8.6) |
70 (33.2, 11.8) |
|
χ² (P-value) |
9.86 (0.002) |
27.63 (0.00000002) |
2.21 (0.14) |
32.10 (<<0.0000001) |
0.56 (0.45) |
6.71 (0.01) |
8.00 (0.004) |
0.63 (0.43) |
||
|
OR (95% CI) |
3.87 (1.56; 9.61) |
2.15 (1.60; 2.87) |
0.81 (0.60; 1.07) |
0.10 (0.03; 0.26) |
0.35 (0.05; 2.60) |
1.49 (1.10; 2.02) |
0.65 (0.47; 0.88) |
1.13 (0.83; 1.53) |
||
Table 2: Reasons for failed sonohysterogram relative to age (years) and BMI (Kg/m2) of study subjects.
( , )*=row and column percentages
Age and abnormal sonohysterogram
The proportion of young women aged ≤25 years with failed sonohysterogram (7/22, 31.8%) was the highest in all age groups. This proportion decreased as age (years) increased to 26-35 (99/579, 16.6%), 36-45 (101/1011, 10.0%) and to >45 (4/289, 1.4%). Those aged ≤25 years were approximately 4 times more likely to have failed sonohysterogram than women of other ages in the study. However, of the 211 patients who failed sonohysterogram, those aged 36-45 years were most numerous (101/211, 47.9%) and those age >45 years were the least (4/211, 1.9%) in number.
Body mass index and abnormal sonohysterogram
Normal weight women had the highest proportion of those with failed sonohysterogram (72/512, 14.1%), closely followed by obese women (70/591, 11.8%). Also, normal weight infertile women formed the bulk of the 211 women who failed sonohysterogram (72/211, 34.1%), followed by obese (70/211, 33.2%) and overweight women (68/211, 32.2%) respectively. Normal weight women were about 1½ times more like to fail sonohysterogram than women in other BMI groups.
Cervical reasons for abnormal sonohysterogram
Collectively, there were 25 (11.8%) patients who presented with cervical reasons for abnormal SHG among who were 2 (8.0%) with difficult catheterization which was observed among one woman each in the age-groups of 26-35 years and 36-45 years respectively, and in the BMI (Kg/m2) category of 25.0-29.9 and ≥30 respectively; 3 (12.0%) with cervical adhesion which occurred solely in those aged 36-45 years who were with normal, overweight and obese BMI; and 20 (80.0%) with cervical stenosis found mostly in the age groups of 26-35 and 36-45 years respectively and mainly in the overweight BMI. Difficulty in catheterization, cervical adhesions and stenosis are all but one as one may be the cause of the other (Table 3).
Uterine reasons for abnormal sonohysterogram
Of the 34 (1.77%) study subjects who had sub-mucous and/or intramural fibroid as reason for failed SHG, 14 (41.2%) were in the age group of 26-35 years and 20 (58.8%) in age group of 36-45 years while 12 (35.3%), 13 (38.2%) and 9 (26.5%) were normal weight, overweight or obese study subjects. Poor uterine distension, observed in 85 (4.4%) of the study subjects, was most prevalent in age group 26-35 (53, 62.4%) and among normal weight (29, 34.1%) and obese (29, 34.1%) women. Of the 7 (0.4%) women who had no uterine distention at all, 3 (42.9%) were aged 26-35 years while 5 (71.4%) were normal weight. Intrauterine polyps (IUP) was the reason documented for 34 (1.8%) study subjects for failing SHG, among who were 25 (73.5%) aged between 36-45 years and 15 (44.1%) obese women. Intrauterine adhesion (IUA) was observed among 18 (0.9%) women mainly aged 26-35 years (9, 50.0%) and mainly obese (7, 38.9%) (Table 3).
Infection as one of the reasons for abnormal sonohysterogram
Only one (0.05%) patient presented with chronic and heavy candidiasis, aged 26-35 years and overweight. Since active infection is a contraindication for sonohysterogram, this patient was excluded from the procedure but it should be kept in mind that such patient scheduled for SHG should be treated and assessed to be completely free of infection before SHG is performed. Her data is included in this report for this purpose. Table 3 also presents reasons for failed SHG relative to parity, induced abortion, miscarriage and regularity of menses.
|
Reason for failed sonohysterogram |
Total count |
% |
Parity |
Induced abortion |
Miscarriage |
Regularity of menses |
||||||||
|
0
(n=1481; 77.18%) |
1
(n=323; 16.83%) |
2
(n=74; 3.86%) |
>2
(n=41; 2.14%) |
Yes
(n=855; 44.6%) |
No
(n=1064; 55.4%) |
Yes
(n=556; 29.0%) |
No
(n=1363; 71.0%) |
Regular
(n=1,483; 77.2%) |
Irregular
(n=282; 14.6%) |
Others#
(n=154; 7.9%) |
||||
|
Freq. (%) |
Freq. (%) |
Freq. (%) |
Freq. (%) |
|||||||||||
|
Difficult catheterization |
2 |
0.1 |
2 (100.0, 0.1)* |
0 (0.0, 0.0) |
0 (0.0, 0.0) |
0 (0.0, 0.0) |
1 (50.0, 0.1) |
1 (50.0, 0.1) |
0 (0.0, 0.0) |
2 (10.0, 0.2) |
2 (100.0, 0.1) |
0 (0.0, 0.0) |
0 (0.0, 0.0) |
|
|
Submucous / intramural fibroid |
34 |
1.8 |
30 (88.2, 2.0) |
2 (5.9, 0.6) |
0 (0.0, 0.0) |
2 (5.9, 4.9) |
12 (35.3, 1.4) |
22 (64.7, 2.1) |
9 (26.5, 1.6) |
25 (73.5, 1.8) |
31 (91.2, 2.1) |
3 (8.8, 1.1) |
0 (0.0, 0.0) |
|
|
Fair distention |
2 |
0.1 |
1 (50.0, 0.1) |
1 (50.0, 0.3) |
0 (0.0, 0.0) |
0 (0.0, 0.0) |
0 (0.0, 0.0) |
2 (100.0, 0.2) |
1 (50.0, 0.2) |
1 (50.0, 0.1) |
2 (100.0, 0.1) |
0 (0.0, 0.0) |
0 (0.0, 0.0) |
|
|
Poor distention |
85 |
4.4 |
77 (90.6, 5.2) |
6 (7.1, 1.9) |
2 (2.3, 2.7) |
0 (0.0, 0.0) |
27 (31.7, 3.2) |
58 (68.2, 5.5) |
21 (24.7, 3.8) |
64 (75.3, 4.7) |
78 (91.8, 5.3) |
6 (7.0, 2.1) |
1 (1.2, 0.7) |
|
|
No distention |
7 |
0.4 |
7 (100.0, 0.5) |
0 (0.0, 0.0) |
0 (0.0, 0.0) |
0 (0.0, 0.0) |
2 (28.6, 0.2) |
5 (71.4, 0.5) |
2 (28.6, 0.4) |
5 (71.4, 0.4) |
6 (85.7, 0.4) |
1 (14.3, 0.4) |
0 (0.0, 0.0) |
|
|
Intrauterine polyp |
34 |
1.8 |
29 (85.3, 2.0) |
3 (8.8, 0.9) |
2 (5.9, 2.7) |
0 (0.0, 0.0) |
16 (46.1, 1.9) |
18 (52.9, 1.7) |
7 (20.6, 1.3) |
27 (79.4, 2.0) |
30 (88.2, 2.0) |
4 (1.4, 11.8) |
0 (0.0, 0.0) |
|
|
Intrauterine adhesion |
18 |
0.9 |
13 (72.2, 0.9) |
3 (16.7, 0.9) |
1 (5.6, 1.4) |
1 (5.6, 2.4) |
9 (50.0, 1.1) |
9 (50.0, 0.9) |
3 (16.7, 0.5) |
15 (83.3, 1.1) |
16 (88.9, 1.1) |
1 (5.6, 0.4) |
1 (5.6, 0.7) |
|
|
Intrauterine fluid |
5 |
0.3 |
3 (60.0, 0.2) |
2 (40.0, 0.6) |
0 (0.0, 0.0) |
0 (0.0, 0.0) |
2 (40.0, 0.2) |
3 (60.0, 0.3) |
1 (20.0, 0.2) |
4 (80.0, 0.3) |
4 (80.0, 0.3) |
1 (20.0, 0.4) |
0 (0.0, 0.0) |
|
|
Cervical adhesion |
3 |
0.2 |
2 (66.7, 0.1) |
1 (33.3, 0.3) |
0 (0.0, 0.0) |
0 (0.0, 0.0) |
1 (33.3, 0.1) |
2 (66.6, 0.2) |
2 (66.7, 0.4) |
1 (33.3, 0.1) |
3 (100.0, 0.2) |
0 (0.0, 0.0) |
0 (0.0, 0.0) |
|
|
Cervical stenosis |
20 |
1.0 |
19 (95.0, 1.3) |
1 (5.0, 0.3) |
0 (0.0, 0.0) |
0 (0.0, 0.0) |
11 (55.0, 1.3) |
9 (45.0, 0.9) |
5 (25.0, 0.9) |
15 (75.0, 1.1) |
20 (100.0, 1.4) |
0 (0.0, 0.0) |
0 (0.0, 0.0) |
|
|
Chronic candidiasis |
1 |
0.5 |
1 (100.0, 0.1) |
0 (0.0, 0.0) |
0 (0.0, 0.0) |
0 (0.0, 0.0) |
0 (0.0, 0.0) |
1 (100.0, 0.1) |
1 (100.0, 0.2) |
0 (0.0, 0.0) |
1 (100.0, 0.1) |
0 (0.0, 0.0) |
0 (0.0, 0.0) |
|
|
Total |
Freq. (%) |
211 |
11.0 |
184 (87.2, 12.4) |
19 (9.0, 5.9) |
5 (2.4, 6.8 ) |
3 (1.4, 7.3) |
81 (38.4, 9.5) |
130 (61.6, 12.2) |
52 (24.6, 9.4) |
159 (75.4, 11.7) |
193 (91.5, 13.0) |
16 (7.6, 5.7) |
2 (0.9, 1.3) |
|
χ² (P-value) |
13.5 (0.0002) |
10.4 (0.001) |
1.00 (0.32) |
0.26 (0.61) |
3.65 (0.06) |
3.65 (0.06) |
2.16 (0.14) |
2.16 (0.14) |
27.17 (0.0000001) |
9.56 (0.002) |
15.03 (0.0001) |
|||
|
OR (95% CI) |
2.15 (1.42; 3.28) |
0.46 (0.28; 0.74) |
0.58 (0.23; 1.45) |
0.63 (0.16; 2.07) |
0.75 (0.56; 1.01) |
1.33 (0.99; 1.78) |
0.78 (0.56; 1.09) |
1.28 (0.92; 1.78) |
3.47 (2.12; 5.70) |
0.44 (0.26; 0.75) |
0.10 (0.02; 0.40) |
|||
Table 3: Frequency distribution of reasons for failed sonohysterogram relative to parity, termination of pregnancy, miscarriage and regularity of menses of study subjects.
( , )*=row and column percentages; #=menopausal and peri-menopausal
Abnormal SHG relative to parity
Surprisingly, difficult catheterization (2/2, 100.0%) sub-mucous and/or intramural fibroid (30/34, 88.2%), poor distension (77/85, 90.6%), no distension (7/7, 100.0%), IUP (29/34, 85.3%), IUA (13/18, 72.2%), cervical stenosis (19/20, 95.0%) and chronic candidiasis (1/1, 100.0%), as reasons for failed SHG, occurred mainly among nulliparous women. Nulliparous women were over 2 times more likely to fail sonohysterogram than parous women (χ²=13.5, P-value =0.0002, OR=2.15, 95% CI: 1.42; 3.28).
Abnormal SHG relative to induced abortion
Sub-mucous and/or intramural fibroid was evidenced as a reason for failed SHG in a higher proportion of women (22/34, 64.7%) who had never had induced abortion compared to those who had (12/34, 35.3%). Poor uterine distension was also observed in a higher proportion (58/85, 68.2%) of those who had never had induced abortion. On the other hand, cervical stenosis as a reason for failed SHG, occurred more (11/20, 55.0%) among women who had experienced induced abortion compared to those who had not. Infertile women who had never experience induced abortion were slightly more likely to fail sonohysterogram (χ²=3.65, P-value=0.064, OR=1.33, 95% CI: 0.99, 1.78).
Abnormal SHG relative to miscarriage
Likewise, sub-mucous and/or intramural fibroid (25/34, 73.5%), poor distension (64/85, 75.3%), IUP (27/34, 79.4%), IUA (15/18, 83.3%) and cervical stenosis (15/20, 75.0%) were found more frequently among study subjects who had never had any miscarriage, though cervical adhesion (2/3, 66.7%) was observed more in those who had gone through miscarriage. Those who had never had miscarriage were also slightly more likely to fail sonohysterogram (χ²=2.16, P-value=0.14, OR=1.28, 95% CI: 0.92, 1.78).
Abnormal SHG relative to regularity of menses
As also shown in table 3, enumerated reasons for failed SHG were more prevalent and about 3½ times more likely (χ²=27.17, P-value=0.0000001, OR=3.47, 95% CI: 2.12, 5.70) among those who had regular menstrual period compared to those whose menstrual periods were irregular or others who were menopausal or peri-menopausal.
Pearson’s correlation between previous uterine surgery, types of uterine surgery and reasons for abnormal SHG
There was a significant correlation between previous uterine surgery and sub-mucous and/or intramural fibroid (Pearson's r = 0.046, P-value = 0.04). Those who had never had previous uterine surgery were 2.13 more likely to present with sub-mucous and/or intramural fibroid at SHG, compared to those who had undergone previous uterine surgery (χ2=4.08, P-value=0.04, OR=2.13, 95% CI:1.01, 4.49) (Table 4). The Table also indicates that poor uterine distention, IUP, and cervical stenosis had significant positive correlations (r = 0.176, P-value << 0.001; r = 0.057, P-value = 0.013; r = 0.051, P-value = 0.027) with the previous uterine surgery in that those who did not have previous uterine surgery were more likely to present with these reasons for failed SHG.
|
Variable |
Previous uterine surgery
|
Caesarean section (C/S)
|
Myomectomy (Myo)
|
Dilatation and curettage (D&C)
|
||||
|
Yes (n=1,600; 83.4%) |
No (n=319; 16.6%) |
Yes (n=236; 14.5%) |
No (n=1,364; 85.5%) |
Yes (n=673; 42.1%) |
No (n=927; 57.9%) |
Yes (n=903; 56.4%) |
No (n=697; 43.6%) |
|
|
|
Freq. (%) |
Freq. (%) |
Freq. (%) |
|||||
|
Submucous / intramural fibroid |
24 (1.50) |
10 (3.13) |
1 (0.42) |
33 (2.42) |
7 (1.04) |
27 (2.91) |
11 (1.22) |
23 (3.30) |
|
- Pearson’s r (P-value) |
0.046 (0.04) |
-0.038 (0.09) |
-0.038 (0.099) |
-0.040 (0.083) |
||||
|
- χ² (P-value) / OR (95% CI) |
4.08 (0.04) / 2.13 (1.01, 4.49) |
2.95 (0.09)/5.83 (0.79, 42.81) |
6.57 (0.01)/2.85 (1.24, 6.59) |
2.98 (0.08)/1.87 (0.91/3.87) |
||||
|
Poor distention |
45 (2.81) |
40 (12.54) |
2 (0.85) |
83 (6.09) |
7 (1.04) |
78 (8.41) |
26 (2.88) |
59 (8.46) |
|
- Pearson’s r (P-value) |
0.176 (<<0.001) |
-0.065 (0.004) |
-0.110 (<<0.001) |
-0.071 (0.002) |
||||
|
- χ² (P-value) / OR (95% CI) |
59.4 (<<0.001) / 4.95 (3.18, 7.73) |
9.96 (0.002)/7.58 (1.85, 31.03) |
42.12 (<<0.001)/8.74 (4.01, 19.07) |
6.92 (0.002)/2.08 (1.30, 3.32) |
||||
|
Intrauterine polyp |
23 (1.44) |
11 (3.45) |
0 (0.0) |
34 (2.49) |
2 (0.30) |
32 (3.45) |
16 (1.77) |
18 (2.58) |
|
- Pearson’s r (P-value) |
0.057 (0.013) |
-0.050 (0.028) |
-0.075 (0.001) |
-0.0000008 (1.00) |
||||
|
- χ² (P-value) / OR (95% CI) |
6.18 (0.013) / 2.45 (1.18, 5.08) |
4.87 (0.027)/undefined |
17.17 (0.00003)/12.00 (2.86, 50.23) |
0.00 (1.00)/1.00 (0.51, 1.97) |
||||
|
Intrauterine adhesion |
13 (0.81) |
5 (1.57) |
3 (1.27) |
15 (1.10) |
1 (0.15) |
17 (1.83) |
7 (0.78) |
11 (1.58) |
|
- Pearson’s r (P-value) |
0.029 (0.202) |
0.013 (0.571) |
-0.055 (0.017) |
-0.016 (0.486) |
||||
|
- χ² (P-value) / OR (95% CI) |
1.63 (0.202) / 1.94 (0.69, 5.49 |
0.00 (1.00)/0.86 (0.25, 3.01) |
8.50 (0.004)/12.55 (1.67, 94.57) |
0.49 (0.49)/1.40 (0.54,3.62) |
||||
|
Intrauterine fluid |
4 (0.25) |
1 (0.31) |
0 (0.0) |
5 (0.37) |
2 (0.30) |
3 (0.32) |
2 (0.22) |
3 (0.43) |
|
- Pearson’s r (P-value) |
0.005 (0.839) |
-0.019 (0.402) |
0.004 (0.854) |
-0.007 (0.752) |
||||
|
- χ² (P-value) / OR (95% CI) |
0.0 (1.00) / 1.25 (0.14, 11.26) |
0.09 (0.76)/undefined |
0.0 (1.00)/1.09 (0.18, 6.54) |
0.0 (1.00)/1.33 (0.22, 7.99) |
||||
|
Cervical stenosis |
13 (0.81) |
7 (2.19) |
2 (0.85) |
18 (1.32) |
0 (0.0) |
20 (2.16) |
10 (1.11) |
10 (1.43) |
|
- Pearson’s r (P-value) |
0.051 (0.027) |
-0.007 (0.753) |
-0.068 (0.003) |
0.006 (0.791) |
||||
|
- χ² (P-value) / OR (95% CI) |
4.92 (0.027) / 2.74 (1.08, 6.92) |
0.08 (0.78)/1.56 (0.36, 6.79) |
13.01 (0.0003)/undefined |
0.07 (0.79)/0.89 (0.37, 2.14) |
||||
Table 4: Pearson’s correlation and chi-square analyses between previous uterine surgeries and failed sonohysterogram.
Caesarean section, myomectomy and dilatation and curettage
There was a significant but negative correlation between “never had C/S” and poor uterine distention (r = - 0.065, P-value = 0.004) in that those who never had C/S were approximately 7.6 times more likely to present with poor distention at SHG (χ2=9.96, P-value=0.002, OR=7.58, 95% CI:1.85, 31.03). There was also a significant, but negative correlation between “never had C/S” and IUP (r = - 0.050, P-value = 0.028). Significant correlations were also observed between myomectomy and some of the reasons for failed SHG and between Dilatation and Curettage and these reasons, as shown in Table 4.
Figures 2 a and b illustrate various views of normal sonohysterogram while Figure 3 shows (a.) abnormal sonohysterogram with echogenic mass, probably polyp, in the uterine cavity, (b.) abnormal sonohysterogram showing anterior mass, likely a submucous fibroid, protruding into the uterine cavity, (c.) abnormal sonohysterogram showing echogenic masses anterior mass, likely possibly polyps, anteriorly and posteriorly in the uterine cavity and (d.) abnormal sonohysterogram showing poor uterine cavity distension with hyper-echogenic areas seen around the fundus, likely adhesions.
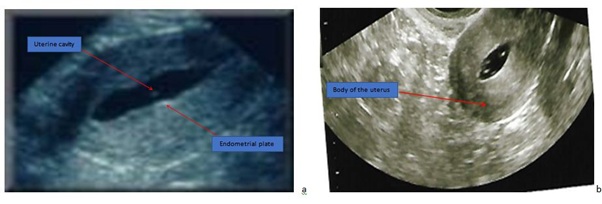 Figure 2a-2b: Normal sonohysterogram showing the body of the uterus, uterine cavity and endometrial plate.
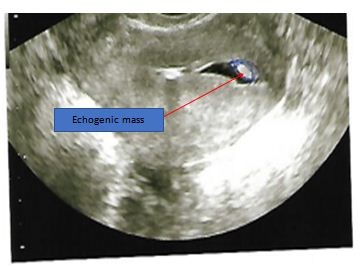 Figure 3a: Abnormal sonohysterogram showing echogenic mass, probably polyp, in the uterine cavity.
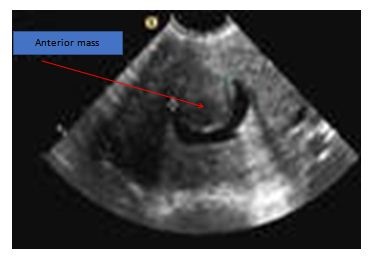 Figure 3b: Abnormal sonohysterogram showing anterior mass, likely a submucous fibroid, protruding into the uterine cavity.
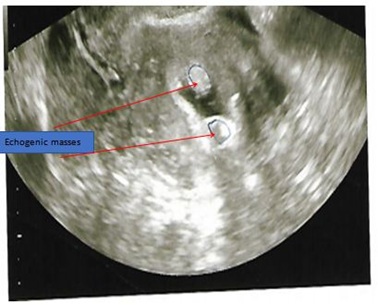 Figure 3c: Abnormal sonohysterogram showing echogenic masses, possibly polyps, anteriorly and posteriorly in the uterine cavity.
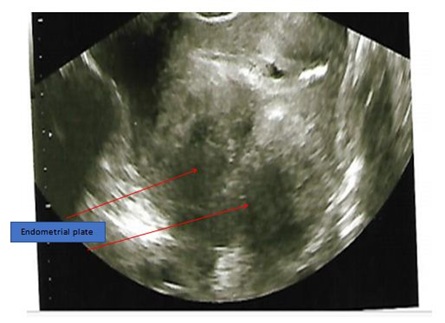 Figure 3d: Abnormal sonohysterogram showing poor uterine cavity distension with hyper-echogenic areas, likely adhesions, seen around the fundus.
Discussion
Sonohysterography is a procedure that facilitates proper assessment of the uterine cavity morphology in both the sagittal and transverse planes, as well as determining and locating filling defects such as adhesions or bands, myomas and polyps [9]. A study indicates that management of abnormal result is one inherent problem of diagnostic test [10]. There are ample evidence that submucous fibroids and intrauterine adhesion interfere with a woman’s ability to take a pregnancy to completion [11-14], and an older study outlined the association of anatomic uterine factor, such as submucous fibroid and adhesions with recurrent pregnancy loss [15]. The current study is unique in the sense that hardly has there been data on why SHG failed among sub-Sahara Black African women who went through the diagnostic test prior to Assisted Reproductive Technology (ART). There are a number of salient findings that warrant description and reportage. The first key finding is that majority of the study subjects were nulliparous, indicating that fertility among Black Africa women is declining and corroborating what Gerais and Rushwan [16] observed three decades ago that the highest prevalence of infertility in Africa occurs south of the Sahara. This calls for an urgent appraisal of fertility status of sub-Sahara Black Africans. The largest number of the 211 women who failed SHG was in the age group of 36-45 year, when fertility has earlier started declining and the women were approaching menopause. Women in this age group are likely to have developed conditions like fibroids seen with advancing age and may also have had various interventions to deal with this and their inability to conceive. However, orthodox and other traditional interventions which involve inserting caustic substances in the vagina to treat fibroids or infertility, may cause cervical and uterine adhesions resulting in failed or abnormal SHG. Infertile women in this age group may wish to give themselves another chance of getting pregnant if their infertility is primary or if they have remarried and want to have a child for their partner. Even more surprising is that a large proportion of those who also failed SHG were aged 26-35 years and that the odds of failing SHG was highest (OR=3.87, 95% CI: 1.56, 6.91) among women ≤25 years. Younger women may return a failed SHG test probably because of anxiety or fear.
That cervical stenosis was observed as a rationale for failed SHG in 20 (1.0%) of the study subjects, a low proportion, could have accounted for an inability to complete the procedure [17] and may necessitate “cervical dilatation or even the use of a guidewire; and inhibited visualization of the endocervical canal” [18]. Poor distention of the uterine cavity was the most prevalent finding in the current study, observed in 85 (40.3%) of those with failed SHG. Epstein et al. [19] reported that the risk of malignancy was increased seven-fold (odds ratio, 7.3; 95% confidence interval, 1.9-27.8) in women with distension difficulties at saline contrast sonohysterography, and two thirds of the women with a poorly distensible uterine cavity had a malignant diagnosis. Among the patients who failed SHG, submucous/intramural fibroid (34/211, 16.1%) and intrauterine polyp (34/211, 16.1%) were common findings. These figures were lower than the 42% and 58% respectively, reported by Wongsawaeng [20] in Thailand. Submucous and/or intramural fibroid may lead to intense pain, bleeding, and infertility [21], or may be the exclusive reason for infertility in 1-2.4% women with the disease [22,23] by obstructing the fallopian tubes and impairing gamete transport [24] or by distortion of the endometrial cavity, causing abnormal endometrial receptivity, hormonal milieu, and altered endometrial development [25,26]. Intrauterine adhesion was observed in 18 (8.5%) of the 211 women who had SHG in Nigeria. Wongsawaeng [20] also reported the characteristics of adhesions as “mobile, thin, echogenic bands crossing the endometrial cavity” and that distending the uterine cavity may be challenging in severe adhesions. Interestingly, previous uterine surgery had a significant correlation with submucous/intramural fibroid in that those who had never had a uterine surgery were about twice more likely to present with fibroid. This is a novel finding in Africa. This finding presupposes that fibroid is prevalent among Black African women. Though black women who should have enough Vitamin D are more prone to uterine fibroid, recent studies have shown that vitamin D deficiency plays an important role in fibroid development and may be a preventable risk factor [27-29]. However, serum Vitamin D in Black African and among African American women with and without fibroid require further investigation. Of interest is the finding of Peddada et al., [30], that the rate of fibroid growth declines for white women over 35 years old, but not for black women of the same age.
Study Limitations
There may be recall bias or incomplete information on the procedures done before presentation. High prevalence of abnormal SHG among nulliparous women may have been skewed by the fact that most of the clients presenting were nulliparous.
Conclusion
Sonohysterogram is an easy, cheap and veritable tool in assessing the state of the uterine cavity especially in sub-Sahara Africa where more advanced procedures like hysteroscopy may not be readily available or affordable. It can be a screening tool before referring failed sonohysterograms for hysteroscopy or other interventions. The possible reasons for and characteristics of women with failed sonohysterogram derived from this study should serve as a guide in triaging infertile women for cavity check accordingly.
Future Research
Comparing successful and failed sonohysterogram as well as confirming the SHG findings with the eventual hysteroscopy findings and thus determine the degree of false positive sonohysterogram, sensitivity and specificity of the SHG test.
Conflict of Interest
The authors declare no conflict of interest in all ramifications.
References
- Grimbizis GF, Camus M, Tarlatzis BC, Bontis JN, Devroey P (2001) Clinical implications of uterine malformations and hysteroscopic treatment results. Hum Reprod Update 7: 161-174.
- Alatas C, Aksoy E, Akarsu C, Yakin K, Aksoy S, et al. (1997) Evaluation of intrauterine abnormalities in infertile patients by sonohysterography. Hum Reprod 12: 487-490.
- Najafian M, Moramezi F, Marati M, Saadati N, Masihi S, et al. (2011) A Comparative Study of Saline Infusion Sonohysterography Outcomes Between Infertile and Fertile Patients: A Randomized Clinical Prospective. Research Journal of Obstetrics and Gynecology 4: 44-50.
- Stumpf PG, March CM (1980) Febrile morbidity following hysterosalpingography: identification of risk factors and recommendations for prophylaxis. Fertil Steril 33: 487-492.
- Fleischer AC, Daniell JF, Rodier J, Lindsay AM, James AE Jr (1981) Sonographic monitoring of ovarian follicular development. J Clin Ultrasound 9: 275-280.
- Osser OV, Valentin L (2011) Clinical importance of appearance of cesarean hysterotomy scar at transvaginal ultrasonography in nonpregnant women. Obstet Gynecol 117: 525-532.
- Haynor DR, Mack LA, Soules MR, Shuman WP, Montana MA, et al. (1986) Changing appearance of the normal uterus during the menstrual cycle: MR studies. Radiology 161: 459-462.
- de Kroon CD, de Bock GH, Dieben SW, Jansen FW (2003) Saline contrast hysterosonography in abnormal uterine bleeding: a systematic review and meta-analysis. BJOG 110: 938-947.
- Goldberg JM, Falcone T, Attaran M (1997) Sonohysterographic evaluation of uterine abnormalities noted on hysterosalpingography. Hum Reprod 12: 2151-2153.
- Case AM, MD, Pierson RA (2003) Clinical use of sonohysterography in the evaluation of infertility. J Obstet Gynaecol Can 25: 641-648.
- Jayakrishnan K, Menon V, Nambiar D (2013) Submucous fibroids and infertility: Effect of hysteroscopic myomectomy and factors influencing outcome. J Hum Reprod Sci 6: 35-39.
- Shokeir T, El-Shafei M, Yousef H, Allam AF, Sadek E (2010) Submucous myomas and their implications in the pregnancy rates of patients with otherwise unexplained primary infertility undergoing hysteroscopic myomectomy: a randomized matched control study. Fertil Steril 94: 724-729.
- Piecak K, Milart P (2017) Hysteroscopic myomectomy. Prz Menopauzalny 16: 126-128.
- Capmas P, Levaillant JM, Fernandez H (2013) Surgical techniques and outcome in the management of submucous fibroids. Curr Opin Obstet Gynecol 25: 332-338.
- Stovall DW, Parrish SB, Van Voorhis BJ, Hahn SJ, Sparks AET, et al. (1998) Uterine leiomyomas reduce the efficacy of assisted reproduction cycles: results of a matched follow-up study. Hum Reprod 13: 192-197.
- Gerais AS, Rushwan H (1992) Infertility in Africa. Popul Sci 12: 25-46.
- Yang T, Pandya A, Marcal P, Bude RO, Platt JF, et al. (2013) Sonohysterography: Principles, technique and role in diagnosis of endometrial pathology. World J Radiol 5: 81-87.
- Lane BF, Wong-You-Cheong JJ (2009) Imaging of endometrial pathology. Clin Obstet Gynecol 52: 57-72.
- Epstein E, Ramirez A, Skoog L, Valentin L (2001) Transvaginal sonography, saline contrast sonohysterography and hysteroscopy for the investigation of women with postmenopausal bleeding and endometrium > 5 mm. Ultrasound Obstet Gynecol 18: 157-162.
- Wongsawaeng W (2005) Transvaginal ultrasonography, sonohysterography and hysteroscopy for intrauterine pathology in patients with abnormal uterine bleeding. J Med Assoc Thai 3: 77-81.
- Walker CL, Stewart EA (2005) Uterine fibroids: the elephant in the room. Science 308: 1589-1592.
- Cook H, Ezzati M, Segars JH, McCarthy K (2010) The impact of uterine leiomyomas on reproductive outcomes. Minerva Ginecol 62: 225-236.
- Donnez J, Jadoul P (2002) What are the implications of myomas on fertility? A need for a debate? Hum Reprod 17: 1424-1430.
- Guo XC, Segars JH (2012) The Impact and Management of Fibroids for Fertility: An evidence-based approach. Obstet Gynecol Clin North Am 39: 521-533.
- Rackow BW, Taylor HS (2010) Submucosal uterine leiomyomas have a global effect on molecular determinants of endometrial receptivity. Fertil Steril 93: 2027-2034.
- Sinclair DC, Mastroyannis A, Taylor HS (2011) Leiomyoma simultaneously impair endometrial BMP-2-mediated decidualization and anticoagulant expression through secretion of TGF-β3. J Clin Endocrinol Metab 96: 412-421.
- Igboeli P, Walker W, McHugh A, Sultan A, Al-Hendy A (2019) Burden of Uterine Fibroids: An African Perspective, A Call for Action and Opportunity for Intervention. Curr Opin Gynecol Obstet 2: 287-294.
- Al-Hendy A, Laknaur A, Diamond MP, Ismail N, Boyer TG, et al. (2017) Silencing Med12 gene reduces proliferation of human leiomyoma cells mediated via wnt/β-catenin signaling pathway. Endocrinology 158: 592-603.
- Vercellini P, Frattaruolo MP (2017) Uterine fibroids: from observational epidemiology to clinical management. BJOG 124: 1513.
- Peddada SD, Laughlin SK, Miner K, Guyon JP, Haneke K, et al. (2008) Growth of uterine leiomyomata among premenopausal black and white women. Proc Natl Acad Sci USA 105: 19887-19892.
Citation: Ajayi AB, Afolabi BM, Ajayi VD, Oyetunji OI, Atiba A (2021) Abnormal Sonohysterography among Sub-Fertile Black Women in Sub-Saharan Africa. J Reprod Med Gynecol Obstet 6: 070.
Copyright: © 2021 Ajayi AB, et al. This is an open-access article distributed under the terms of the Creative Commons Attribution License, which permits unrestricted use, distribution, and reproduction in any medium, provided the original author and source are credited.