Acid Soil Resistance of Faba Bean (Vicia faba L.) Genotypes in the Highlands of Dawro Zone, Southwest Ethiopia
*Corresponding Author(s):
Zeleke AshangoPlant Science Department, Wolaita Sodo University Dawro Tarcha Campus, P.O. Box 01, Tarcha, Ethiopia
Fax:+ (251) 473450508
Email:zelekemarc2014@gmail.com
Abstract
Soil acidity and its driven soil fertility problems are causing wide gap between actual farmers yield and research yield in faba bean in the highlands of Dawro zone and Ethiopia. Therefore, 11 improved faba bean genotypes were evaluated with and without lime application on the acidic highland soils of Dawro zone at different locations for two cropping seasons to identify high seed yielding and lime responsive and/or acid soil tolerant genotypes. Combined analysis of variance, overall mean seed yield performance, percent seed yield reduction, and Soil Acidity Susceptibility Index (SASI) were used to analyze data. Profitability of producing higher seed yielding genotypes was analyzed using partial budget with dominance. The combined analysis of variance showed that the effects of all sources of variations viz., Genotype (G), Location (L), Year (Y), Lime (M), and their interactions such as GL, GY, GM, LY, LM, YM, GLY, GYM, LYM, and GLYM were highly significant (p<0.01). The effects of G, GY, and GM, were 43.43%, 10.32%, and 8.15%, respectively, indicating greater influence of these sources in causing variability among faba bean genotypes for seed yield performance. In overall, genotypes viz., Ashebeka, Hachalu, Numan, and Tumsa, are higher seed yielding, lime responsive, and acid soil tolerant genotypes. Therefore, these genotypes are best for production in the highlands of Dawro zone and Ethiopia with development of optimum lime and fertilizer rates and agronomic practices as their production is profitable both with and without lime with extra net benefit of 21454.60 Birr when lime is applied. These genotypes are also good for breeding to improve seed yield potential and quality traits under acid soil conditions.
Keywords
Acidity tolerance; Genotype; Lime; Lime responsiveness; Seed yield
introduction
Faba bean (Vicia faba L.) is the most important pulse crop in Ethiopia. It shares 29.84% area coverage and 33.5% production from total pulse crops [1]. It is a major source of protein and cash for subsistence farmers and foreign currency to the country [2]. It is widely used in rotation with cereals because it improves soil fertility by fixing atmospheric nitrogen. Despite its diverse benefits, the actual yield obtained by farmers is 2.2 ton per hectare, which is about 70.09% lower than actual yield obtained by farmers in Egypt and United Kingdom [3].
This low yield obtained by farmers is attributed to several deficiencies in management of field and the crop but, mainly due to soil acidity and its driven soil fertility problems. These problems are making yield gains achieved in improved varieties unstable and unsustainable [4-6]. For example, the research yield of faba bean in Ethiopia is up to high as 5.7 t ha-1[7]. Thus, there is about 61.40% yield difference between actual farmers yield and research yield. This is because most highland soils of Ethiopia are acidic and hence, crops are less responsive to application of inorganic fertilizers and improved agronomic practices in these soils [8,9] besides other ecological limitations. It is estimated that 43% of the Ethiopian land area and 28% of cultivated land is affected by soil acidity and the measured soil pH is in the range 4.1-5.5 [10]. These soils are poor in exchangeable cations and low in base saturation [11,12].
Soil acidity is caused by processes that lower down soil pH such as removal of crop residue, leaching of basic cations (Ca2+, Mg2+, Na+, and K+) at excessive rainfall areas, crop removal of essential cations (Ca2+, Mg2+, and K+), continuous use of acid forming fertilizers (diammonium phosphate ((NH4)2HPO4) and urea (CO(NH2)2)), which produce Hydrogen Ion (H+) through oxidation of ammoniumion ion (NH4+) to nitrate ion (NO3−), dissociation of weak acids (carboxylic, enolic, and phenolic acids) in organic matter, which release H+ ions into soil solution, and buffering capacity of the soil, which is defined as the contact exchange between exchangeable hydrogen ion on root surfaces and the bases in exchangeable form on soils [4,9,13].
At soil pH less than 5.5, soil acidity affects crop yields due to Aluminum (Al3+), Hydrogen (H+), Iron (Fe2+), and Manganese (Mn2+) toxicities and the concurrent deficiencies of plant available Phosphorus (P), Nitrogen (N), Calcium (Ca), Magnesium (Mg), Potassium (K), Molybdenum (Mo), Sulfur (S), and reduced activities of beneficial microorganisms [14,15].
Soil acidity decreased faba bean seed yield by 45-81% [16], 32% [17], 111% [18] and 500% [19]. Similarly, it decreased hundred seeds weight and total biomass yield by 30% and 53.4%, respectively [5], leaf area and nodule quality by 58% and 94 %, respectively [20], and increased photosynthetic rate by 7.1% [20].
Several practices have been recommended to reclaim soil acidity. These recommendations include use of acid tolerant crops, covering the surface with non-acidic soil, use of organic fertilizer, and liming [4,5,9]. Of these practices, liming and the application of organic fertilizers are considered as best measures due to their persistent effects on soil properties. However, farmers in the high lands of Dawro zone did not prefer shifting to production of other crops because faba bean is coexisted with their staple perennial food crop, enset, and is the main source of their dietary protein and cash income. In addition, high population pressure and availability of fewer lands to produce more foods in the highlands of Dawro zone and Ethiopia urges even use of marginal lands [21]. Furthermore, field crops like faba bean need bulky organic materials and, therefore, use of organic fertilizers is impractical for it. In this scenario, evaluation of different genotypes at target production environments for soil acidity tolerance and/or for lime application response provides useful information [18].
In Ethiopia, faba bean is suitably grown in areas of altitude ranging from 1800-3000 meters above sea level, rainfall from 700 to 1100 mm per annuum, and minimum and maximum temperatures and , respectively, from June to October. It needs red brown soil with no water logging [7,17]. Its optimum soil pH is in the range 6.0-7.0 [9], but the measured soil pH of the study sites were 4.7 and 5.3 in Gozobamush site and Kechi site, respectively. In this situation, soil test results based liming is very important to raise the pH of the soil to the desired optimum level recommended for crops [22].
Liming is the application of calcium and/or magnesium rich materials to soil in various forms, including marl, chalk, limestone, or hydrated lime. It raises soil pH and enhances crop yield. Raising of soil pH occurs when the basic cations such as Calcium (Ca2+), Magnesium (Mg2+), Potassium (K+), Sodium (Na+) replace acidic cations such as Iron (Fe2+), Manganese (Mn2+), Hydrogen (H+), and Aluminum (Al3+) on cation exchange sites of soil clay and organic matter particles and are released into soil solutions. Crop yield is enhanced because raising soil pH improves plant availability of Phosphorus (P), Nitrogen (N), Molybdenum (Mo), Calcium (Ca), Magnesium (Mg), Potassium (K), and soil physical and biological properties [9,22].
Faba bean genotypes show differential reaction to lime application and soil acidity. For example, some faba bean genotypes showed variability in the range 3.4% to 22% in days to maturity when lime is applied [18,23]. Height of different genotypes differed in the range 15.2% to 71.9% compared to lime unapplied. By the same works, number of pods per plant performance of genotypes differed in the range 7.3% to 90.5 % whereas hundred seeds weight performance differed in the range 3.7% to 158.9% when lime is applied. These works detected 0.93% to 83.8% variation among the genotypes for seed yield performance compared to lime unapplied control. Another work revealed existence of 650%, 74.9%, 6.1%, 88.4%, 108.3%, 15.3%, 62.8%, and 11.3% differences in root length, leaf area, photosynthetic rate, nodule quantity, nodule quality, chlorophyll concentration, shoot dry weight, and seed production efficiency, respectively, among the genotypes due to lime application [20]. Therefore, evaluation of different faba bean genotypes on acid soils with acidity driven soil fertility problems and identification of acid soils tolerant and/or lime responsive genotypes is important to narrow the gap between actual farmers yield and research yield. Most highland soils of Dawro zone have soil acidity driven soil fertility problems [24,25]. As a result, this research was done with the following objectives.
- To evaluate seed yield performance of faba bean genotypes with and without lime application in highlands of Dawro zone.
- To assess economic profitability of faba bean production with and without lime application in the highlands of Dawro zone.
- To identify high seed yielding, acid soil tolerant and/or lime application responsive, and profitable faba bean genotypes for production in the highlands of Dawro zone and Ethiopia.
- To recommend soil acidity tolerant and/or lime application responsive faba bean genotypes for further breeding.
Materials and Methods
Description of the study area
Field experiment was conducted in two districts of Dawro zone namely Mareka and Kechi in the 2019 and 2020 main faba bean cropping seasons. The specific experimental sites are Gozobamush and Kechi. They are sub research centers of Wolaita Sodo University Dawro Tarcha campus.
Gozobamush site is located at north latitudes and east longitudes with altitude of 2432.2 meters above sea level. It receives an annual rainfall of 1672.8 mm and experiences minimum and maximum temperatures and , respectively. Its soil test result pH was 4.7. The major annual crops grown around this site are faba bean, field pea, wheat, barley, and Irish potato. The major perennial crop that shares largest area than both annual and other perennial crops is enset (Enset ventricosum L.). Enset is the main staple starch food whereas faba bean is the main source of dietary protein and cash income for people in the area. They coexisted in the area and supplement each other the diet of people.
Kechi site is located at 7.2030° north latitudes and 36.5930° east longitudes with altitude of 2090.4 meters above sea level. It receives an annual rainfall of 1560.8 mm and experiences minimum and maximum temperatures 12° and 26°, respectively. Its soil test result pH was 5.3. Similar annual and perennial crops are grown here too.
Experimental genotypes and design
Eleven improved faba bean genotypes collected from Holetta and Kulumsa Agricultural Research Centers in the country were used in the study (Table 1). At each site in each year, two trials, one with lime application and the other without lime application, were planted. Both lime applied and unapplied trials contained the same genotypes. The experiments were arranged in Randomized Complete Block Design (RCBD) with three replications. The plot size was 2mx2m (4m2) for all experiments. The spacing used was 40 cm between rows and 10 cm between plants as this is recommended spacing for faba bean production by national research system. The two outer rows were used as border rows and the net harvested area was 2.4m2, the central three rows. Two seeds per hill were sown on rows with manual drilling to ensure germination and good stands of the faba bean genotypes and then were thinned to one plant per hill 12 days after emergence to achieve 100 plants per plot. For the trials with lime applications, lime was applied at the rate of 2.42 t ha-1 and 2.21 t ha-1 at Gozobamush and Kechi sites, respectively, one month a head of planting. These were the lime amounts required to raise the measured soil pH (Table 2) to the target pH recommended for best growth of faba bean, which is in the range 6.0 to 7.0 [8,9]. For all experiments, blended fertilizers NPS were applied at the rate of 100 kg ha-1 during planting. The other agronomic practices were carried out uniformly to all plots as per the recommendations made by the national research system for faba bean.
|
Genotype |
Altitude (m.a.s.l.) |
|
Annual rain fall (mm) |
Days to maturity |
|
Seed color |
|
Year of release |
Breeder |
|
|
Ashebeka |
1990-2800 |
900-1000 |
128-156 |
|
Light green |
|
2015 |
KARC |
||
|
Didea |
1990-2800 |
900-1000 |
122-145 |
|
Light brown |
|
2014 |
KARC |
||
|
Numan |
1800-3000 |
700-1100 |
137-148 |
|
Light green |
|
2016 |
KARC |
||
|
|
|
|
|
|
|
|
|
|
|
|
|
Degaga |
1800-300 |
800-1100 |
125 |
|
Light brown |
|
2002 |
HARC |
||
|
Gebelcho |
1900-3000 |
700-1000 |
103-167 |
|
Light brown |
|
2006 |
HARC |
||
|
Moti |
1900-2800 |
700-1000 |
108-165 |
|
Light brown |
|
2006 |
HARC |
||
|
Obse |
1900-2800 |
700-1000 |
87-166 |
|
Light brown |
|
2007 |
HARC |
||
|
Dosha |
2050-2800 |
700-1000 |
120-165 |
|
Light brown |
|
2009 |
HARC |
||
|
Hachalu |
1900-2800 |
700-1000 |
122-156 |
|
Light brown |
|
2010 |
HARC |
||
|
Tumsa |
1900-2800 |
700-1000 |
121-176 |
|
Light brown |
|
2010 |
HARC |
||
|
Gora |
2000-2800 |
700-1200 |
151-158 |
|
Light green |
|
2013 |
KARC |
Table 1: Experimental genotypes, their adaptation areas, and some of their agronomic traits.
Source: HARC=Holeta Agricultural Research Center, KARC=Kulmsa Agricultural Research Center, m.a.s.l.= Meter above sea level, and mm=millimeter. Degaga is introduced variety; Dosha is developed from local collection, and others are developed from hybridization.
|
Parameter |
|
Unit |
|
Values |
||
|
|
|
|
|
Gozobamush |
|
Kechi |
|
Sand |
|
% |
|
28 |
|
20 |
|
|
|
|
|
|
|
|
|
Clay |
|
% |
|
30 |
|
38 |
|
Silt |
|
% |
|
42 |
|
42 |
|
|
|
|
|
|
|
|
|
Textural class |
|
- |
|
Clay loam |
|
Clay |
|
Soil bulk density |
|
g(cm3)-1 |
|
0.99 |
|
1.0 |
|
PH-H2O |
|
- |
|
4.7 |
|
5.3 |
|
Exchangeable Acidity |
|
Meq (100 g soil)-1 |
|
1.63 |
|
1.47 |
|
Exchangeable H+ |
|
Meq (100 g soil)-1 |
|
0.29 |
|
0.75 |
|
|
|
|
|
|
|
|
|
Exchangeable Al3+ |
|
Meq (100 g soil)-1 |
|
1.34 |
|
0.72 |
|
Conductivity |
|
ms cm-1 |
|
- |
|
0.02 |
|
|
|
|
|
|
|
|
|
Organic Carbon (OC) |
|
% |
|
5.3 |
|
4.48 |
|
Total Nitrogen (TN) |
|
% |
|
0.4 |
|
0.44 |
|
|
|
|
|
|
|
|
|
C:N |
|
Ratio |
|
13.4 |
|
10.18 |
|
Ava. phosphorous (P) |
|
mg kg-1 |
|
4.73 |
|
2.74 |
|
Sulfur (S) |
|
mg kg-1 |
|
9.71 |
|
8.24 |
|
|
|
|
|
|
|
|
|
Calcium (Ca) |
|
cmol(+)(kg soil)-1 |
|
5.78 |
|
4.33 |
|
|
|
|
|
|
|
|
|
Magnesium (Mg) |
|
cmol(+)(kg soil)-1 |
|
0.86 |
|
0.75 |
|
Potassium (K) |
|
cmol(+)(kg soil)-1 |
|
0.35 |
|
0.24 |
|
Sodium (Na) |
|
mg kg-1 |
|
13.92 |
|
1.61 |
|
|
|
|
|
|
|
|
|
Cation Exchangeable Capacity (CEC) |
|
cmol(+)(kg soil)-1 |
|
37.5 |
|
37.72 |
|
Boron (B) |
|
mg kg-1 |
|
0.48 |
|
0.02 |
|
Iron (Fe) |
|
mg kg-1 |
|
231.77 |
|
415.6 |
|
Manganese (Mn) |
|
mg kg-1 |
|
198.75 |
|
311.3 |
|
Copper (Cu) |
|
mg kg-1 |
|
2.8 |
|
0.72 |
|
Zinc (Zn) |
|
mg kg-1 |
|
23.15 |
|
4.27 |
Table 2: Selected physical and chemical properties of the experimental soils.
Gozobamush and Kechi are experimental sites.
Experimental Procedures
Soil sampling, preparation and analysis
Before planting, twelve soil samples from top 20 cm depth were taken randomly from representative spots of the entire 243m2 experimental field using an auger and composited to one representative sample. The composite sample was air-dried at room temperature, thoroughly mixed and ground to pass through a 2 mm sieve and then analyzed for soil texture, pH, organic carbon, cation exchange capacity, exchangeable bases (Na, K, Ca and Mg), total nitrogen, available Phosphorus, exchangeable acidity, extractable aluminum and micro nutrients (Zn, Fe, Mn and Cu). One soil sample for bulk density analysis at each location was taken by core sampler.
Soil bulk density was determined using a core sampler and soil pH-H2O was determined by potentiometric method at 1:2.5 soils: water ratio [26]. Cation exchange capacity was determined by 1 M ammonium acetate method at pH 7 [27] whereas organic carbon was determined by the Walkley and Black method [28] and total nitrogen by the micro-Kjeldhal method [29], available Phosphorus (P) was determined by the Olsen method [29]. Soil particle size distribution was determined by the hydrometer method [30]. Exchangeable bases such as Na, K, Mg and Ca and extractable Al, Fe, Zn, Mn and Cu were determined by Mehlich-3 method [31]. Analysis of all the soil parameters was done at Debrezeit agricultural research center soil and plant analysis laboratory.
Treatment application and field activities
All field activities were done with standard production practices developed for faba bean. The land was tilled by tractor at Kechi site and by oxen plough at Gozobamush site. Land pulverization and row making were done using hand tools to plant the seeds. Lime was applied one month ahead of planting to give time for incorporation. It was applied based on the amount required to raise soil pH from 4.7 and 5.3 at Gozobamush and Kechi sites, respectively, to the range in between 6.0 to 6.5. Planting of the experiments was done in July at both locations in both years. Similarly, harvesting was done in November at both locations in both years. The liming material used was calcium carbonate and its rate (LR) was determined based on soil analysis results using the following formula:
 Where, LR=Lime rate, EA=Exchangeable soil acidity, =Soil bulk density, SD=Soil depth, and 1.5 was liming factor determined based on crop response.
Data collection and analysis
The agronomic data recorded were plant height (cm), hundred seeds weight (g), number of pods per plant, number of seeds per pod and seed yield per plot in grams. Plant height, number of pods per plant, and number of seeds per pod were recorded on individual plant basis from ten randomly pre-tagged plants from the central three rows and then averaged. Hundred seeds weight was recorded by taking hundred seeds from each plots threshed and cleaned seed yield randomly and then weighing using sensitive balance. The moisture content of the seed yield was measured before sampling and the net weight of seeds was calculated based on the formula given by [32] to adjust to 14 % moisture content. Seed yield collected on plot basis was the yield in grams of plants in the central three rows obtained by weighing using sensitive balance. It was adjusted to 14 % moisture content using the formula:
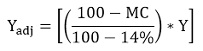 Where; was moisture adjusted yield, Y was unadjusted yield, and MC was measured moisture content (%) and then converted to kg ha-1.
Soil acidity resistance
The tolerance of genotypes to soil acidity was analyzed using Soil Acidity Intensity Index (SAII) and Soil Acidity Susceptibility Index (SASI) indices extrapolated from the formulas used for low soil fertility intensity index and low soil fertility susceptibility index [33]. Soil Acidity Intensity Index (SAII) of each environment was calculated as ![]() where; and were the mean of all genotypes under lime untreated and treated environments, respectively. Soil acidity susceptibility index (SASI) for each genotype was calculated as follows:
where; and were the mean of all genotypes under lime untreated and treated environments, respectively. Soil acidity susceptibility index (SASI) for each genotype was calculated as follows: ![]() where, and were the mean yields of a given genotype under lime untreated and treated environments, respectively.
where, and were the mean yields of a given genotype under lime untreated and treated environments, respectively.
Analysis of variance
Data were subjected to analysis of variance (ANOVA) for RCBD using Genstat statistical software package version 17 after test for presence of outliers and normality of residuals [34]. ANOVA for the traits per location/year/lime level were first analyzed separately and then combined after Bartlett’s test for homogeneity of error variance.
The combined analysis of variance model used was: ; where, was the mean yield over replicates of genotype at location and lime level in the year ; was the overall mean, was the effect of genotype, was the effect of year, was the effect of location, was the effect of lime level, , , , , , , , , , and were the interaction effects and was pooled error assumed to be normally and independently distributed as mean 0 and variance.
Existence of significant difference among the genotypes, locations, lime level and their interactions was determined using the F-test in all the cases. Mean separation at 5% probability level was done using Duncan’s Multiple Range Test (DMRT) following [35], whenever genotype differences were significant.
Economic analysis
The economic analysis such as partial budget, marginal, and sensitivity analysis were carried out as described by [36]. To estimate economic parameters, crop produces were valued based on market price of the year. The concepts used in the partial budget analysis were mean seed yield ha-1; gross field benefit per hectare (GFB ha-1), Total Variable Cost (TVC), and the net benefit per hectare (NB ha-1). Seed yield (kgha-1) refers to average seed yield of each genotype across locations and over years for both lime treated and untreated experiments. The GFB ha-1 was obtained as the products of real price in birr of a kilogram of seed yield and the mean seed yield in kilogram of each genotype. The TVC in the partial budget analysis refers to the sum of costs of all variable inputs (seed, fertilizer, lime, pesticides) and management practices (tillage and labor costs for planting, fertilizing, weeding, pesticide application, harvesting, threshing, and transporting) whereas the NB ha-1 was the difference between the GFB ha-1 and the TVC.
The dominance analysis procedure was used to select potentially profitable treatments by ranking of treatments in order of ascending TVC from the lowest to the highest cost to eliminate those genotypes that were costing more but producing a lower NB ha-1 than the next lowest cost genotype. For each pair of ranked undominated genotypes, a percentage Marginal Rate of Return (% MRR) was calculated. The MRR (%) was calculated using the equation:
MRR(%) = (? NB / ? TVC)
Where; ? NB is change in net benefit, and ? TVC is change in total variable cost between any pair of undominated treatments.
Results And Discussion
Soil physicochemical properties
Soil physicochemical properties of experimental sites were variable (Table 2). The Gozobamush site soil had clay loam textural class with particle size distribution of 30% clay, 42% silt and 28% sand whereas the Kechi site soil had clay textural class with particle size distribution of 38% clay, 42% silt, and 20 % sand. The pH-H2O values of soils were 4.7 and 5.3 at Gozobamush site and at Kechi site, respectively. Thus, soil at Gozobamush site is very strongly acidic according to [45] whereas soil at Kechi site is strongly acidic soil based on [18]. This acidity resulted in deficiencies of essential nutrients like Phosphorus (P), Sulphur (S), and Boron (B) and toxicities of cations such as Hydrogen Ion (H+), Aluminum Ion ( Al3+), Iron Ion ( Fe2+), and Manganese Ion (Mn2+) as reported by [4] and [8] and affected seed yield performance of faba bean genotypes.
The Organic Carbon (OC) content of experimental soils was 5.3% at Gozobamush site and 4.48% at Kechi site. Similarly, the Total Nitrogen (TN) content was 0.40% at Gozobamush site and 0.44% at Kechi site. Thus, experimental sites have medium OC content and optimum TN content according to [37] and [38] ratings. The available Phosphorus (P), Sulphur (S), and Boron (B) were 4.73, 9.71, and 0.48 mg kg-1 at Gozobamush site and 2.74, 8.24, and 0.02 mg kg-1 at Kechi site, respectively. Therefore, experimental soils are very low in these essential nutrients based on similar ratings as expected from acidic soils. The concentration of cations was in the order of Calcium Ion (Ca2+)> Magnesium Ion (Mg2+)> Potassium Ion (K+)> Sodium Ion (Na+) in both sites with slightly higher concentrations at Gozobamush site. The slightly higher concentrations of cations at Gozobamush site could be due to higher organic matter content at the site. Similarly, the concentration of micronutrients was in the sequence of Iron Ion (Fe2+)> Manganese Ion (Mn2+)> Zinc Ion (Zn2+)> Copper Ion (Cu2+)> Boron (B+) at both sites. The concentration of Fe2+ and Mn2+ were 231.77 and 198.75 mg kg-1 in Gozobamush site and 415.6 and 311.3 mg ka-1 at Kechi site, respectively. So, the concentrations of both fall in the sufficient III range according to [39] classification. The concentration of Zn2+ and Cu2+ were 23.15 and 2.8 mg kg-1 in Gozobamush site and 4.27 and 0.72 mg ka-1 at Kechi site, respectively. This indicates Zn2+ is optimum and Cu2+ is deficient in experimental soils according to the [38].
Analysis of variance
The combined analysis of variance for seed yield (Table 3) showed that genotypes (G), Locations (L), Year (Y), Lime (M), Genotype X Location Interaction (GL), Genotype x year interaction (GY), genotype x lime interaction (GM), location x year interaction (LY), location x lime interaction (LM), year x lime interaction (YM), Genotype x location x year interaction (GLY), Genotype x year x lime interaction (GYM), location x year x lime (LYM), and genotype x location x Year x lime interaction (GLYM) effects were highly significant (p < 0.01). These indicate existence of substantial genetic differences among genotypes and variability of locations and years for seed yield performance. Reports of [40] and [6] are similar to these findings. The highly significant effect of lime also indicated indicated differential seed performance of genotypes due to lime application. Similarly, several studies reported variable seed yield performance of faba bean genotypes to lime applied at different rates compared to control treatments [8,18]. Furthermore, the highly significant effect of genotype x lime interaction (GM) indicated variable response of genotypes to lime application. [21] Evaluated 50 faba bean genotypes for lime response and reported differential reaction of genotypes.
|
Source of variation |
|
D.F. |
|
Mean square |
|
Explained % within structures |
Explained % of TSS |
|
Year (Y) |
|
1 |
|
19287921** |
|
32.42 |
7.43 |
|
|
|
|
|
|
|
|
|
|
Location (L) |
|
1 |
|
7991622** |
|
13.43 |
3.08 |
|
Lime (M) |
|
1 |
|
14306710** |
|
24.05 |
5.51 |
|
Location x Year (LY) |
|
1 |
|
8924355** |
|
15.00 |
3.44 |
|
|
|
|
|
|
|
|
|
|
Year x Lime (YM) |
|
1 |
|
2659450** |
|
4.47 |
1.02 |
|
Location x Lime (LM) |
|
1 |
|
2993168** |
|
5.03 |
1.15 |
|
|
|
|
|
|
|
|
|
|
Location x Year x Lime (LYM) |
|
1 |
|
3334600** |
|
5.60 |
1.28 |
|
|
|
|
|
|
|
|
|
|
Rep (Year x Location x Lime) |
|
16 |
|
19169 |
|
||
|
Genotype (G) |
|
10 |
|
11278101** |
|
56.34 |
43.43 |
|
|
|
|
|
|
|
|
|
|
Genotype x Year (GY) |
|
10 |
|
2680748** |
|
13.39 |
10.32 |
|
|
|
|
|
|
|
|
|
|
Genotype x Location (GL) |
|
10 |
|
958776** |
|
4.79 |
3.69 |
|
Genotype x Lime (GM) |
|
10 |
|
2117220** |
|
10.58 |
8.15 |
|
Genotype x Location x Year(GLY) |
|
10 |
|
499791** |
|
2.50 |
1.92 |
|
Genotype x Location x Lime(GLM) |
|
10 |
|
465458** |
|
2.33 |
1.79 |
|
Genotype x Location x Year x Lime (GLYM) |
|
20 |
|
1009164** |
|
10.08 |
7.77 |
|
|
|
|
|
|
|
|
|
|
Residual |
|
160 |
|
6904 |
|
|
|
Table 3: Analysis of variance for seed yield (kg ha-1) performance of faba bean genotypes evaluated with and without lime at two locations of Dawro zone in the 2019 and 2020 main cropping seasons.
**=Significant at p<0.01, D.F.=Degree of freedom, and TSS=Treatment sum of squares.
The effects of sources of variations (Table 3) were in the order of G (43.43%)>GY (10.32%)>GM (8.15%)>GLYM (7.77%)>Y (7.43% >M (5.51% >GL (3.69%)>LY (3.44%)>L (3.08%)>GLY (1.92%)>GLM (1.79%) > LYM (1.28%) > LM (1.15%) > YM (1.02%). This shows that variability between genotypes was greatest compared to variability between other sources of variations similarly as reported by [41].The higher effect of Year (Y) compared to Location (L) showed that temporal variation in environments was higher than spatial variations. In this scenario, it is very important to select genotypes that are specifically adapted to a given production environment than widely adapted genotypes. Similarly, the higher M and GM effects than L and GL effects indicated higher influence of soil acidity related soil fertility problems than other edaphic factors in seed yield performance of faba bean genotypes. This is because when there is soil acidity problem, most plant nutrients became unavailable and genotypes do not respond to applied inorganic fertilizers [4,8]. Furthermore, in acidic soils with soil pH less than 5.5, H+, Al3+ , Fe2+, Mn2+ ions become in toxic concentrations and injure plant roots and so that reduce uptake of available nutrients, water, and nodulation that help faba bean genotypes to use atmospheric nitrogen.
Soil acidity tolerance of genotypes
In overall, lime application increased seed yield performance of genotypes in the range 2.83% for genotype Degaga to 23.85% for genotype Gora (Table 4). The average percent seed yield increment due to liming was 12.56%. [42] Reported 17.09% seed yield increment when lime is applied at a rate of 2 t ha-1. Thus, it is within the reported range and similar to this finding. Genotypes viz., Gora, Didea, Numan, Gebelcho, and Dosha showed above average seed yield increment. They also had soil acidity susceptibility index (SASI) values above unity. Thus, they are reactive with line and are sensitive to acid soils. Other genotypes viz., Ashebeka, Tumsa, Hachalu, Obse, Moti, and Degaga showed below average percent seed yield increment and had lower SASI values. As a result, they seem less reactive with lime and are tolerant to acid soils. Acid soil tolerant genotypes should give higher seed yield compared to other genotypes when grown in acid soils. However, the genotypes selected as acid soil tolerant genotypes using percent seed yield increment and SASI values contained both higher and lower seed yielding genotypes.
|
|
Gozobamush |
Kechi |
Combined |
|||||||||
|
Genotype |
With |
Without |
PR |
SASI |
With |
Without |
PR |
SASI |
With |
Without |
PR |
SASI |
|
Ashebeka |
5470.45 |
4842.40 |
12.97 |
0.91 |
5327.50 |
4923.55 |
8.20 |
0.79 |
5398.98 |
4882.98 |
10.57 |
0.86 |
|
Degaga |
4467.10 |
4300.75 |
3.87 |
0.29 |
4289.45 |
4214.50 |
1.78 |
0.18 |
4378.28 |
4257.63 |
2.83 |
0.25 |
|
|
|
|
|
|
|
|
|
|
|
|
|
|
|
Didea |
4829.65 |
4017.15 |
20.23 |
1.33 |
4762.85 |
3944.70 |
20.74 |
1.80 |
4796.25 |
3980.93 |
20.48 |
1.52 |
|
Dosha |
4872.50 |
4012.75 |
21.43 |
1.39 |
3803.10 |
3673.95 |
3.52 |
0.36 |
4337.80 |
3843.35 |
12.87 |
1.02 |
|
|
|
|
|
|
|
|
|
|
|
|
|
|
|
Gebelcho |
3890.65 |
3240.56 |
20.06 |
1.32 |
3439.40 |
3088.24 |
11.37 |
1.07 |
3665.03 |
3164.40 |
15.82 |
1.22 |
|
Gora |
4308.60 |
3545.75 |
21.51 |
1.40 |
4114.30 |
3255.00 |
26.40 |
2.18 |
4211.45 |
3400.38 |
23.85 |
1.73 |
|
|
|
|
|
|
|
|
|
|
|
|
|
|
|
Hachalu |
5209.10 |
4632.85 |
12.44 |
0.87 |
5218.95 |
4903.90 |
6.42 |
0.63 |
5214.03 |
4768.38 |
9.35 |
0.77 |
|
|
|
|
|
|
|
|
|
|
|
|
|
|
|
Moti |
4579.70 |
4116.15 |
11.26 |
0.80 |
3716.15 |
3551.00 |
4.65 |
0.46 |
4147.93 |
3833.58 |
8.20 |
0.68 |
|
Numan |
4884.10 |
4341.10 |
12.51 |
0.88 |
5253.20 |
4324.95 |
21.46 |
1.85 |
5068.65 |
4333.03 |
16.98 |
1.30 |
|
Obse |
3755.45 |
3396.90 |
10.56 |
0.75 |
3418.64 |
3194.75 |
7.01 |
0.69 |
3587.05 |
3295.83 |
8.84 |
0.73 |
|
Tumsa |
5028.75 |
4360.35 |
15.33 |
1.05 |
4473.75 |
4171.70 |
7.24 |
0.71 |
4751.25 |
4266.03 |
11.37 |
0.92 |
|
Mean |
4663.28 |
4073.34 |
14,48 |
- |
4347.03 |
3931.48 |
10.57 |
- |
4505.15 |
4002.41 |
12.56 |
- |
|
ASII |
|
|
|
0.13 |
|
|
|
0.10 |
|
|
|
0.11 |
Table 4: Soil Acidity Intensity Index (SAII), Soil Acidity Susceptibility Index (SASI), and percent seed yield reduction (PR) of faba bean genotypes evaluated at two locations of Dawro zone in the 2019 and 2020 main cropping seasons.
SAII = Soil acidity intensity index and SASI = Soil acidity susceptibility index, without = Seed yield (kg ha-1) in lime untreated experiment and With = Seed yield (kg ah-1) in lime treated experiment, and PR = Percent seed yield reduction.
In Gozobamush site, percent seed yield increment due to liming ranged from 3.87% for genotype Degaga to 21.54% for genotype Gora. In this site, the average percent seed yield increment due to liming was 14.48%. Liming increased seed yield of faba bean by 32% [5] and 45-81% [8] in Ethiopia. These reports are similar to present report in yield increment but, different in magnitude of increment. The difference in magnitude may be because of variation in sites and test genotypes used. Genotypes viz., Gora, Dosha, Didea, Gebelcho, and Tumsa, which showed above average seed yield increment and had higher SASI values, are sensitive to acid soils. Genotypes viz., Ashebeka, Numan, Hachalu, Moti, Obse and Degaga, which showed below average percent seed yield increment and had lower SASI values, are tolerant to acid soils.
Similarly, in Kechi site, seed yield increment with lime application ranged from 1.78% for genotype Degaga to 26.40% for genotype Gora. Here, the average seed yield increment was 10.57%. [6] Evaluated 50 faba bean genotypes and reported 43.9 % seed yield increment due to liming. Percent seed yield increment is higher in this report may be because they used a single four meter row as a plot. Other possible causes may be variation in experimental sites. Genotypes namely, Gora, Numan, Didea, and Gebelcho showed above average seed yield increment and had SASI values above unity. Thus, they are sensitive to acid soils. Unlike ways, genotypes viz., Ashebeka, Tumsa, Obse, Hachalu, Moti, Dosha, and Degaga showed below average seed yield increment and had SASI values below unity. So, they are tolerant to acid soils.
The Soil Acidity Intensity Index (SAII) was 0.13 at Gozobamush site and 0.10 at Kechi site (Table 5). This reveals more acidity of experimental soil at Gozobamush site than Kechi site (Table 3). These results also suggest presence of moderately high soil acidity stress at both sites. In overall, the soil acidity susceptibility index (SASI) values of genotypes ranged from 0.25 for genotype Degaga to 1.73 for genotype Gora. At Gozobamush site, it ranged from 0.29 for genotype Degaga to 1.40 for genotype Gora. It ranged from 0.18 for genotype Degaga to 2.18 for genotype Gora at Kechi site. These SASI values indicated existence of considerable variability among improved faba bean genotypes studied for acid soil tolerance. [38] Reported similar variable reaction of faba bean genotypes to acid soils in Ethiopia.
|
Gozobamush |
Kechi |
Combined |
Overall Mean |
|||||||||||
|
Genotype |
With |
Genotype |
Without |
Genotype |
With |
Genotype |
Without |
Genotype |
With |
Genotype |
Without |
Genotype |
Mean |
|
|
Ashebeka |
5470.5a |
Ashebeka |
4842.4a |
Ashebeka |
5327.5a |
Ashebeka |
4923.6a |
Ashebeka |
5399.0a |
Ashebeka |
4883.0a |
Ashebeka |
5141.0a |
|
|
Hachalu |
5209.1b |
Hachalu |
4632.9b |
Numan |
5253.2a |
Hachalu |
4903.9a |
Hachalu |
5214.1b |
Hachalu |
4768.4b |
Hachalu |
4991.2b |
|
|
Tumsa |
5028.8c |
Tumsa |
4360.4c |
Hachalu |
5219.0a |
Numan |
4324.9b |
Numan |
5068.7c |
Numan |
4333.0c |
Numan |
4700.8c |
|
|
|
|
|
|
|
|
|
|
|
|
|
|
|
|
|
|
Numan |
4884.1d |
Numan |
4341.1c |
Didea |
4762.8b |
Degaga |
4214.5bc |
Didea |
4796.2d |
Tumsa |
4266.1c |
Tumsa |
4508.6d |
|
|
Dosha |
4872.5d |
Degaga |
4300.8c |
Tumsa |
4473.7c |
Tumsa |
4171.7c |
Tumsa |
4751.3d |
Degaga |
4257.6c |
Didea |
4388.6e |
|
|
Didea |
4829.6d |
Moti |
4116.2d |
Degaga |
4289.5d |
Didea |
3944.7d |
Degaga |
4378.3e |
Didea |
3980.9d |
Degaga |
4318.0f |
|
|
Moti |
4579.7e |
Didea |
4017.2d |
Gora |
4114.3e |
Dosha |
3673.9e |
Dosha |
4337.8e |
Dosha |
3843.4e |
Dosha |
4090.6g |
|
|
|
|
|
|
|
|
|
|
|
|
|
|
|
|
|
|
Degaga |
4467.1e |
Dosha |
4012.8d |
Dosha |
3803.1f |
Moti |
3551.0e |
Gora |
4211.5f |
Moti |
3833.6e |
Moti |
3990.8h |
|
|
Gora |
4308.6f |
Gora |
3545.7e |
Moti |
3716.1f |
Gora |
3393.6f |
Moti |
4147.9f |
Gora |
3469.7f |
Gora |
3817.5i |
|
|
|
|
|
|
|
|
|
|
|
|
|
|
|
|
|
|
Gebelcho |
3890.7g |
Obse |
3396.9f |
Gebelcho |
3439.4g |
Obse |
3194.7g |
Gebelcho |
3665.0g |
Obse |
3295.8g |
Obse |
3441.4j |
|
|
Obse |
3755.4h |
Gebelcho |
3240.6g |
Obse |
3418.6g |
Gebelcho |
3088.2g |
Obse |
3587.1h |
Gebelcho |
3164.4h |
Gebelcho |
3414.7j |
|
|
Mean (0.05) |
4663.28a |
4073.35b |
4347.02a |
3944.07b |
4505.15a |
4008.71b |
|
4254.8 |
||||||
|
|
|
|
|
|
|
|
|
|
|
|
|
|
|
|
|
SED |
47.97 |
|
47.97 |
|
47.97 |
|
47.97 |
|
36.56 |
|
36.56 |
|
23.99 |
|
Table 5: Mean seed yield (kg ha-1) performance of faba bean genotypes evaluated with and without lime at two locations of Dawro zone in the 2019 and 2020 main cropping seasons.
Means followed by the different letters down columns and across rows are significantly different at p < 0.05, with = with lime application averaged over years, without = without lime application averaged over years, Combined = averaged over years and locations, Overall = averaged over years, locations, and management (lime levels), SED = Standard error of differences of means and SED for lime is 17.04.
In overall, the rankings of genotypes based on Soil Acidity Susceptibility Index (SASI) from most acid soil tolerant genotype to least acid soil tolerant genotype were Degaga (0.25)>Moti (0.68)>Obse (0.73)>Hachalu (0.77)>Ashebeka (0.86)>Tumsa (0.92)>Dosha (1.02)>Gebelcho (1.22)>Numan (1.30)>Didea (1.52)>Gora (1.73) (Table 5). Therefore, genotypes with SASI values below unity are acid soil tolerant genotypes whereas genotypes with SASI values above unity are acid soil sensitive genotypes.
In Gozobamush site, the rankings of genotypes based on soil acidity susceptibility index (SASI) from most tolerant genotype to least tolerant genotype was Degaga (0.29)> Obse (0.75)> Moti (0.80)> Hachalu (0.87)>Numan (0.88)> Ashebeka (0.91)> Tumsa (1.05)> Gebelcho (1.32)> Didea (1.33)> Dosha (1.39)> Gora (1.40) (Table 5). Similarly, in this site also genotypes with SASI values below unity are acid soil tolerant genotypes and with SASI values above unity are acid soil sensitive genotypes.
In Kechi site, the ranking of genotypes based on soil acidity susceptibility index (SASI) from most tolerant genotype to least tolerant genotype was Degaga (0.18)> Dosha (0.36)> Moti (0.46)> Hachalu (0.63)> Obse (0.69)> Tumsa (0.71)> Ashebeka (0.79)> Gebelcho (1.07)> Didea (1.80)> Numan (1.85)> Gora (2.18) (Table 5). Here again, acid soil tolerant and sensitive genotypes can be identified similarly as that of Gozobamush site.
In lime applied experiment, when averaged over years and locations, seed yield performance of genotypes ranged from 3587.1 kg ha-1 for the genotype Obse to 5399.0 kg ha-1 for the genotype Ashebeka (Table 4). The average seed yield of genotypes was 4505.2 kg ha-1 with lime application. Genotypes viz., Ashebeka, Hachalu, Numan, Didea, and Tumsa performed above average seed yield when lime was applied. As a result, they are lime responsive genotypes. Other genotypes viz., Degaga, Dosha, Gebelcho, Gora, Moti, and Obse performed below average seed yield when lime was applied. Therefore, they are lime unresponsive genotypes. In overall, genotypes tested are variable in their response to applied lime. Similarly, [6] reported existence of substantial genetic variability among faba bean genotypes in response to lime.
In lime unapplied experiment, when averaged over years and locations, seed yield performance of genotypes ranged from 3164.4 kg ha-1 for the genotype Gebelcho to 4883.0 kg ha-1 for the genotype Ashebeka (Table 4). The average seed yield of genotypes was 4002.4 kg ha-1 without lime application. Genotypes viz., Ashebeka, Hachalu, Numan, Tumsa, and Degaga, which performed above average seed yield when lime was not applied, are acid soil tolerant genotypes. Therefore, genotypes viz., Ashebeka, Hachalu, Numan, and Tumsa, both lime responsive and acid soil tolerant, are good genotypes for both subsistence and commercial farmers. Genotypes viz., Didea, Dosha, Gebelcho, Gora, Moti, and Obse, which performed below average seed yield when lime was not applied, are acid soil sensitive genotypes. Genotype, Didea, responsive to lime but, sensitive to soil acidity, is good genotype for production in highly acidic soils with lime application. Genotype, Degaga, unresponsive to lime but, tolerant to acid soils, is good for production in marginal lands without lime application. Remaining genotypes viz., Dosha, Gora, Gebelcho, Moti, and Obse, both unresponsive to lime and sensitive to acid soils, are less suitable for production in study sites and similar areas because they are less responsive to soil amendment and sensitive to changes in the soil.
In Gozobamush site, in lime applied experiment, when averaged over years, seed yield performance of genotypes ranged from 3755.4 kg ha-1 for genotype Obse to 5470.5 kg ha-1 for genotype Ashebeka (Table 4). The average seed yield of genotypes with lime application at Gozobamush site was 4663.28 kg ha-1. As a result, genotypes viz., Ashebeka, Hachalu, Tumsa, Numan, Didea, and Dosha, which performed above average seed yield when lime was applied, are lime responsive genotypes whereas genotypes viz., Moti, Degaga, Gora, Gebelcho, and Obse, which performed below average seed yield when lime was applied, are lime unresponsive genotypes.
In Gozobamush site, in lime unapplied experiment, when averaged over years, seed yield performance of genotypes ranged from 3240.6 kg ha-1 for the genotype Gebelcho to 4842.4 kg ha-1 for the genotype Ashebeka (Table 4). In this site, when lime was not applied, the average seed yield of genotypes was 4073.34 kg ha-1. Therefore, genotypes viz., Ashebeka, Hachalu, Tumsa, Numan, Degaga, and Moti, which performed above average seed yield when lime was not applied, are acid soil tolerant genotypes whereas Didea, Dosha, Gora, Obse, and Gebelcho, which performed below average seed yield when lime was not applied, are acid soil sensitive genotypes. Therefore, genotypes viz., Ashebeka, Hachalu, Tumsa, and Numan, both lime responsive and acid soil tolerant genotypes at Gozobamush site, are good genotypes for both subsistence and commercial production in Gozobamush and similar sites. Genotypes, Didea and Dosha, lime responsive but, sensitive to soil acidity, are good genotypes for cultivation with lime application in highly acidic soils. Genotypes, Degaga and Moti, lime unresponsive but, tolerant to acid soils, are good for production in marginal lands without lime application. Other genotypes viz., Gora, Gebelcho, and Obse, both lime unresponsive and acid soil sensitive, are less good genotypes for production in this and similar sites.
In Kechi site, in lime applied experiment, when averaged over years, seed yield performance of genotypes ranged from 3418.6 kg ha-1 for the genotype Obse to 5327.5 kg ha-1 for the genotype Ashebeka (Table 4). The average seed yield with lime application at Kechi site was 4347.03 kg ha-1. Genotypes viz., Ashebeka, Numan, Hachalu, Didea, and Tumsa which performed above average seed yield when lime was applied, are lime responsive genotypes whereas genotypes viz., Moti, Degaga, Gora, Gebelcho, Dosha, and Obse, which performed below average seed yield when lime was applied, are lime unresponsive genotypes. In Kechi site, in lime unapplied experiment, when averaged over years, seed yield performance of genotypes ranged from 3088.4 kg ha-1 for the genotype Gebelcho to 4923.6 kg ha-1 for the genotype Ashebeka (Table 4). Here, average seed yield without lime application was 3931.48 kg ha-1. Genotypes viz., Ashebeka, Hachalu, Tumsa, Numan, Degaga, and Didea which performed above average seed yield when lime was not applied, are acid soil tolerant genotypes whereas Dosha, Gora, Obse, Moti, and Gebelcho which performed below average seed yield when lime was not applied, are acid soil sensitive genotypes. As a result, genotypes viz., Ashebeka, Hachalu, Tumsa, Numan, and Didea, both lime responsive and acid soil tolerant, are good genotypes for both subsistence and commercial production in Kechi and similar sites. In this site, no genotype is exceptionally well for production with lime application. Genotype, Degaga, lime unresponsive but, tolerant to acid soils, is good for production in marginal areas without lime application.
Seed yield performance of genotypes
The overall mean seed yield performance of genotypes ranged from 3414.7 kg ha-1 for genotype Obse to 5141.0 kg ha-1 for genotype Ashebeka (Table 5). The overall mean seed yield averaged across management (lime levels) and over genotypes was 4254.8 kg ha-1. Genotypes viz., Ashebeka, Hachalu, Numan, Tumsa, Didea, and Degaga, which performed above the overall mean, are higher seed yielded genotypes whereas the remaining genotypes viz., Dosha, Moti, Gora, Obse, and Gebelcho, which performed below the overall mean, are lower seed yielding genotypes. Similarly, several researchers [6,7,18,43] reported variability of faba bean genotypes for seed yield performance. Therefore, these higher seed yielding genotypes are good for production in the highlands of Ethiopia with development of appropriate soil amendment and agronomic practices. They can also be used in faba bean improvement programs as parents to improve seed yield potential and quality traits in Ethiopia and elsewhere. Among the locations, when averaged over lime levels and genotypes, higher seed yield performance of genotypes was observed at Gozobamush site (4368.31 kg ha-1) than Kechi site (4145.55 kg ha-1). Therefore, Gozobamush site has higher faba bean seed yield potential than Kechi site. Similarly, [18] reported variability among locations for faba bean seed yield performance.
In Gozobamush site, when averaged over years and lime levels, seed yield performance of genotypes ranged from 3565.6 kg ha-1 for genotype Gebelcho to 5470.5 kg ha-1 for genotype Ashebeka (Table 5). Genotypes viz., Ashebeka, Hachalu, Tumsa, Numan, Didea, Dosha, and Degaga performed above average whereas Moti, Gora, Gebelcho, and Obse performed below average. Thus, genotypes viz., Ashebeka, Hachalu, Tumsa, Numan, Didea, Dosha, and Degaga, are higher seed yielding genotypes and good for production at this site with development of optimum soil management and agronomic practices.
Similarly in Kechi site, when averaged over years and lime levels, seed yield performance of genotypes ranged from 3263.8 kg ha-1 to 5125.5 kg ha-1 for similar genotypes as to Gozobamush site. Again, the same genotypes performed above and below average as that of Gozobamush site except Dosha which performed below average in this site. Therefore, the genotypes selected for production in Gozobamush site are also good for production in Kechi site with development of appropriate soil and agronomic management technologies.
In overall, the higher seed yielding genotypes viz., Ashebeka, Hachalu, Numan, Tumsa, Didea, and Degaga showed significantly different seed yield performance among one another and from the remaining lower seed yielded genotypes (Table 5). Ashebeka was the first top higher seed yielding genotype while Degaga was the sixth top higher seed yielding genotype. Similarly, the lower seed yielding genotypes viz., Dosha, Moti, Gora, Obse, and Gebelcho showed significantly different seed yield performance among one another and from higher seed yielding genotypes except Gebelcho and Obse which exhibited statistically similar lowest seed yield performance.
In lime applied experiment, comparing means averaged over years and locations, among the higher seed yielding genotypes viz., Ashebeka, Hachalu, Numan, Didea, and Tumsa, the first three showed significantly different seed yield performance among one another whereas Didea and Tumsa showed statistically similar seed yield performance. In the same way, among the lower seed yielded genotypes, Degaga and Dosha and again Gora and Moti showed statistically similar seed yield performance within themselves. The remaining lower seed yielded genotypes, Gebelcho and Obse, showed statistically dissimilar seed yield performance between themselves and from other lower seed yielded genotypes.
In lime unapplied experiment, when averaged over years and locations, the higher seed yielding genotypes viz., Ashebeka, Hachalu, Numan, Tumsa, and Degaga were divided into three sub groups for seed yield performance. Ashebeka and Hachalu, which formed the first and second groups, showed significantly different performance between themselves and from others. Numan, Tumsa and Degaga, which formed the third group, showed statistically similar seed yield performance. The lower seed yielded genotypes viz., Didea, Dosha, Moti, Gora, Obse, and Gebelcho, all showed dissimilar seed yield performance among one another, but Dosha and Moti, which showed statistically similar seed yield performance.
In lime applied experiment, in Gozobamush site, when averaged over years, higher seed yielding genotypes, Ashebeka, Hachalu, Tumsa, and Numan showed dissimilar seed yield performance among themselves. But, other higher seed yielding genotypes, Didea, and Dosha, showed similar seed yield performance between them and with Numan. The lower seed yielding genotypes viz., Moti, Degaga, Gora, Gebelcho, and Obse again showed dissimilar seed yield performance except Moti and Degaga that showed similar seed yield performance.
In lime unapplied experiment, in Gozobamush site, when averaged over years, genotypes viz., Ashebeka, Hachalu, and Tumsa showed significantly dissimilar seed yield performance among themselves but, the performance of Tumsa was not different from that of Numan and Degaga. Moti, Didea, and Dosha again showed similar seed yield performance. Other lower seed yielding genotypes viz., Gora, Obse, and Gebelcho showed significantly different performance among themselves and from others.
In lime applied experiment, in Kechi site, when averaged over years, genotypes viz., Ashebeka, Numan, and Hachalu showed similar seed yield performance among them, but significantly different seed yield performance from other genotypes. Other higher seed yielding genotypes, Didea and Tumsa, showed significantly variable seed yield performance between them and from others. Among the lower seed yielding genotypes viz., Moti, Degaga, Gora, Gebelcho, Dosha, and Obse, the two genotypes, Moti and Dosha, showed dissimilar seed yield performance between themselves and among others. Degaga and Gora as well as Gebelcho and Obse showed similar seed yield performance between themselves, but significantly different from others.
In lime unapplied experiment, when averaged over years, genotypes viz., Ashebeka and Hachalu were first, Numan was second, and Tumsa and Degaga were third higher seed yielding genotypes. Among the lower seed yielding genotypes, Dosha and Moti and again Obse and Gebelcho showed similar seed yield performance within themselves, but significantly different from other genotypes.
Seed yield component traits performance
The seed yield component traits viz, plant height, hundred seed weight, number of pods per plant, and number of seeds per pod performance of genotypes was variable ( Table 6). The height of genotypes ranged from 122.11 cm for genotype Dosha to 152.77 cm for genotype Gora with average height of 141.41 cm. Genotypes viz., Gora, Ashebeka, Didea, Degaga, and Hachalu, which measured above average height, are taller genotypes. Their tallness was statistically similar. Other genotypes viz., Moti, Numan, Tumsa, Obse, and Dosha, which measured below average height, are shorter genotypes. Among shorter genotypes, Moti, Numan, and Tumsa measured similar shorter heights within themselves. Similarly, Obse and Dosha measured statistically similar heights.
|
Genotype |
|
PH |
Genotype |
|
HSW |
Genotype |
PPP |
|
Genotype |
|
SPP |
|
Gora |
|
152.77a |
Numan |
|
107.08a |
Tumsa |
22.49a |
|
Gebelcho |
|
3.50a |
|
Ashebeka |
|
150.50a |
Gora |
|
100.06b |
Dosha |
22.11a |
|
Ashebeka |
|
3.47a |
|
Didea |
|
149.57ab |
Ashebeka |
|
92.35c |
Didea |
21.35ab |
|
Numan |
|
3.40a |
|
Degaga |
|
148.29ab |
Gebelcho |
|
91.48c |
Degaga |
21.30ab |
|
Didea |
|
3.33ab |
|
Hachalu |
|
147.00ab |
Tumsa |
|
86.40d |
Gora |
19.94bc |
|
Hachalu |
|
3.33ab |
|
|
|
|
|
|
|
|
|
|
|
|
|
|
Gebelcho |
|
144.89bc |
Didea |
|
86.00d |
Numan |
19.17cd |
|
Degaga |
|
3.10ab |
|
Moti |
|
140.00cd |
Hachalu |
|
85.76de |
Hachalu |
17.78d |
|
Obse |
|
2.98bc |
|
Numan |
|
139.39cd |
Obse |
|
85.61de |
Ashebeka |
17.10de |
|
Gora |
|
2.90cd |
|
Tumsa |
|
135.01d |
Dosha |
|
85.35de |
Moti |
15.21ef |
|
Dosha |
|
2.77cd |
|
Obse |
|
125.95e |
Moti |
|
82.60e |
Gebelcho |
14.17fg |
|
Moti |
|
2.77cd |
|
Dosha |
|
122.11e |
Degaga |
|
63.53f |
Obse |
12.94g |
|
Tumsa |
|
2.67d |
|
Mean |
|
141.41 |
|
|
87.84 |
|
18.51 |
|
|
|
3.11 |
|
SED |
|
2.04 |
|
1.09 |
0.70 |
|
|
0.14 |
|||
|
DF |
|
40.00 |
|
|
80.00 |
|
40.00 |
|
|
|
40.00 |
Table 6: Mean plant height, hundred seeds weight, number of pods per plant, and number of seeds per pod performance of faba bean varieties evaluated at two locations of Dawro zone in the 2019 and 2020 main cropping seasons.
Means followed by the same letters down columns are not significantly different at p < 0.05, SED = Standard error of difference of means, DF = degree of freedom, PH = Plant height in cm, HSW = Hundred seeds weight, PPP = number of pods per plant, SPP = Number of seeds per pod.
Hundred seeds weight performance of genotypes ranged from 63.53 gram for genotype Degaga to 1007.08 gram for genotype Numan with average hundred seeds weight of 87.84 gram (Table 6). Genotypes viz., Numan, Gora, Ashebeka, and Gebelcho, which measured above average weight, are larger seeded genotypes. Therefore, they can be used as parents in breeding for large seed size. Genotypes viz., Tumsa, Didea, Hachalu, Obse, Dosha, Moti, and Degaga, which measured below average weight, are small seeded genotypes. Among the larger seeded genotypes, Numan and Gora showed statistically dissimilar hundred seeds weight performance between them and from others. Other larger seeded genotypes, Ashebeka and Gebelcho, showed similar hundred seeds weight performance. The small seeded genotypes showed similar hundred seeds weight performance except Moti and Degaga, which showed dissimilar hundred seeds weight performance between them and from others.
Number of pods per plant performance of genotypes ranged from 12.94 for genotype Obse to 22.49 for genotype Tumsa with mean number of pods per plant 18.51 (Table 6). Genotypes viz., Tumsa, Dosha, Didea, Degaga, Gora, and Numan, which bore above average number of pods, are higher pod bearing genotypes whereas genotypes viz., Hachalu, Ashebeka, Moti, Gebelcho, and Obse, which bore below average number of pods, are lower pod bearing genotypes. Among the higher pod bearing genotypes, Tumsa, Dosha, Didea, and Degaga were similar in pod bearing ability whereas lower pod bearing genotypes were dissimilar in their bod bearing ability.
Number of seeds per pod performance of genotypes ranged from 2.67 for genotype Tumsa to 3.50 for genotype Gebelcho with mean number of seeds per pod 3.11 (Table 6). Genotypes viz., Gebelcho, Ashebeka, Numan, Didea, and Hachalu, which produced above average seeds per pod, are higher number of seeds per pod producing genotypes. The remaining genotypes, viz., Degaga, Obse, Gora, Dosha, Moti, and Tumsa, which produced below average seeds per pod, are lower number of seeds per pod producing genotypes. Both higher numbers of seeds per pod producing and lower numbers of seeds per pod producing genotypes showed similar performance for number of seeds per pod performance within themselves, but dissimilar between groups.
Economic performance of genotypes
Gross field benefit per hectare (GFB ha-1) of genotypes ranged from 242955.00 Birr from production of genotype Ashebeka with lime application to 142398.45 Birr from production of genotype Gebelcho without lime application (Table 7). Similarly, the net benefit per hectare (NB ha-1) of genotypes ranged from 203405.75 Birr from production of genotype Ashebeka with lime application to 107025.14 Birr from production of genotype Gebelcho without lime application.
|
With lime application |
||||||||||
|
Genotype |
GY |
UP |
GFB |
TVC |
NB |
Dominance |
Incremental cost |
Incremental benefit |
MRR (%) |
BC ratio |
|
Obse |
3587.05 |
45.00 |
161417.25 |
38190.29 |
123226.96 |
Undominated |
|
3.23 |
||
|
Gebelcho |
3665.03 |
45.00 |
164926.35 |
38248.77 |
126677.58 |
Undominated |
58.49 |
3450.62 |
5900 |
3.31 |
|
Moti |
4147.93 |
45.00 |
186656.85 |
38610.95 |
148045.90 |
Undominated |
362.18 |
21368.33 |
5900 |
3.83 |
|
Gora |
4211.45 |
45.00 |
189515.25 |
38658.59 |
150856.66 |
Undominated |
47.64 |
2810.76 |
5900 |
3.90 |
|
Dosha |
4337.80 |
45.00 |
195201.00 |
38753.35 |
156447.65 |
Undominated |
94.76 |
5590.99 |
5900 |
4.04 |
|
Degaga |
4378.28 |
45.00 |
197022.60 |
38783.71 |
158238.89 |
Undominated |
30.36 |
1791.24 |
5900 |
4.08 |
|
Tumsa |
4751.25 |
45.00 |
213806.25 |
39063.44 |
174742.81 |
Undominated |
279.73 |
16503.92 |
5900 |
4.47 |
|
Didea |
4796.20 |
45.00 |
215829.00 |
39097.15 |
176731.85 |
Undominated |
33.71 |
1989.04 |
5900 |
4.52 |
|
Numan |
5068.65 |
45.00 |
228089.25 |
39301.49 |
188787.76 |
Undominated |
204.34 |
12055.91 |
5900 |
4.80 |
|
Hachalu |
5214.05 |
45.00 |
234632.25 |
39410.54 |
195221.71 |
Undominated |
109.05 |
6433.95 |
5900 |
4.95 |
|
Ashebeka |
5399.00 |
45.00 |
242955.00 |
39549.25 |
203405.75 |
Undominated |
138.71 |
8184.04 |
5900 |
5.14 |
|
Without lime application |
||||||||||
|
Genotype |
GY |
UP |
GFB |
TVC |
NB |
Dominance |
Incremental cost |
Incremental benefit |
MRR (%) |
BC ratio |
|
Gebelcho |
3164.41 |
45.00 |
142398.45 |
35373.31 |
107025.14 |
Undominated |
|
3.03 |
||
|
Obse |
3295.83 |
45.00 |
148312.35 |
35471.87 |
112840.48 |
Undominated |
98.56 |
5815.34 |
5900 |
3.18 |
|
Gora |
3469.65 |
45.00 |
156134.25 |
35602.24 |
120532.01 |
Undominated |
130.37 |
7691.53 |
5900 |
3.39 |
|
Moti |
3833.58 |
45.00 |
172511.10 |
35875.19 |
136635.92 |
Undominated |
272.95 |
16103.90 |
5900 |
3.81 |
|
Dosha |
3843.35 |
45.00 |
172950.75 |
35882.51 |
137068.24 |
Undominated |
7.33 |
432.32 |
5900 |
3.82 |
|
Didea |
3980.95 |
45.00 |
179142.75 |
35985.71 |
143157.04 |
Undominated |
103.20 |
6088.80 |
5900 |
3.98 |
|
Degaga |
4257.63 |
45.00 |
191593.35 |
36193.22 |
155400.13 |
Undominated |
207.51 |
12243.09 |
5900 |
4.29 |
|
Tumsa |
4266.05 |
45.00 |
191972.25 |
36199.54 |
155772.71 |
Undominated |
6.31 |
372.58 |
5900 |
4.30 |
|
Numan |
4333.00 |
45.00 |
194985.00 |
36249.75 |
158735.25 |
Undominated |
50.21 |
2962.54 |
5900 |
4.38 |
|
Hachalu |
4768.40 |
45.00 |
214578.00 |
36576.30 |
178001.70 |
Undominated |
326.55 |
19266.45 |
5900 |
4.87 |
|
Ashebeka |
4883.00 |
45.00 |
219735.00 |
36662.25 |
183072.75 |
Undominated |
85.95 |
5071.05 |
5900 |
4.99 |
Table 7: Partial budget with dominance and marginal analysis of faba bean genotypes evaluated with and without lime application at two locations of Dawro zone in the 2019 and 2020 main cropping seasons.
GY = Seed yield (kg ha-1), UP = Unit price in Birr kg-1 of seed yield, GFB = Gross field benefit in Birr ha-1 (GY*UP), TVC = Total variable cost (sum of variable costs) in Birr ha-1, NB = Net benefit in Birr ha-1 (GFB ha-1-TVC ha-1), and MRR = Marginal rate of return (incremental benefit /incremental cost), and BC ratio = Net benefit /TVC.
In lime applied experiment, GFB ha-1 of genotypes ranged from 242955.00 Birr from production of genotype Ashebeka to 161417.25 Birr from production of genotype Obse. The average GFB ha-1 of genotypes with lime application was 202731.91 Birr. Genotypes viz., Ashebeka, Hachalu, Numan, Didea, and Tumsa returned above average GFB ha-1 whereas genotypes viz., Degaga, Dosha, Gora, Moti, Gebelcho, and Obse returned below average GFB ha-1.
In lime applied experiment, NB ha-1 of genotypes ranged from 203405.75 Birr from production of genotype Ashebeka to 123226.96 Birr from production of genotype Obse. The average NB ha-1 of genotypes with lime application was 163853.05 Birr. Similar genotypes tho
Conclusion
There is wide gap between actual farmers yield and research yield in faba bean in Ethiopia. This is mainly due to soil acidity and its driven soil fertility problems in the highlands. Soils of this experiment sites are strongly acidic. They have medium content of organic carbon and are optimum in total nitrogen and zinc content. However, they are deficient in cupper and very low in available phosphorus, sulphur, and boron. Therefore, determination of optimum rates of blended fertilizers containing Nitrogen (N), Phosphorus (P), Sulphur (S), and Boron (B) for these soils is important. They have high concentration of iron and manganese which again indicate need for interventions that can bring their concentration to nontoxic level.
Faba bean genotypes studied have substantial genetic variability for seed yield performance. Similarly, test environments are very variable with greater variability in seasons than locations. Again, the influences of soil acidity and its related soil fertility problems are higher than other edaphic factors in causing variability among faba bean genotypes for seed yield performance. Mean seed yield performance above overall mean enabled identification of higher seed yielding genotypes and soil acidity intensity index enabled identification of more acidic site. Soil acidity susceptibility index and percent seed yield reduction analysis enabled identification of acid soil tolerant genotypes but, less clearly than overall mean.
Higher seed yielding genotype is defined as a genotype that performs above overall mean in a set of test environments. Genotypes viz., Ashebeka, Hachalu, Numan, Tumsa, Didea, and Degaga, are higher seed yielding genotypes.
Liming is application of calcium- and magnesium-rich materials to acidic soils to raise soil pH to the optimum level for crops. It increased seed yield of genotypes variably for different genotypes. Lime responsive genotype is defined as a genotype that gives higher seed yield compared to other genotypes when lime is applied to acidic soils based on soil test results. Genotypes viz., Ashebeka, Hachalu, Numan, Didea, and Tumsa are lime responsive genotypes.
Acid soil tolerant genotype is defined as a genotype that gives higher seed yield compared to other genotypes in acid soils. Acid soil tolerant genotypes are very important as they enable cultivation of marginal lands without the need to take costly reclamation measures. Genotypes viz., Ashebeka, Hachalu, Numan, and Tumsa, are acid soil tolerant genotypes. Their production is also very profitable in the highlands of Dawro zone and Ethiopia.
Therefore, genotypes viz., Ashebeka, Hachalu, Numan, and Tumsa, both lime responsive and acid soil tolerant, are good genotypes for both subsistence and commercial production in the highlands of Dawro zone and Ethiopia. They can also be used in future breeding programs to improve seed yield potential and quality traits under acid soil conditions. Genotype, Didea, responsive to lime but, sensitive to soil acidity, is good genotype for production in highly acidic soils with lime application. Genotype, Degaga, unresponsive to lime but, tolerant to acid soils, is good for production in marginal lands without lime application. Genotypes viz., Dosha, Gora, Gebelcho, Moti, and Obse, both unresponsive to lime and sensitive to acid soils, are less suitable for production in study sites and similar areas.
Acknowledgement
The author thanks Wolaita Sodo University Dawro Tarcha campus for financial support and Kulmsa and Holetta agricultural research centers for experimental genotypes provision. My thanks are also extended to academic and administrative staff members of Wolaita Sodo University Dawro Tarcha campus who participated and helped during execution of the experiment.
References
- Central Statistical Agency (CSA) (2020) Agricultural sample survey. Report on area and production of crop (private peasant holdings, meher season). vol.1: statistical bulletin 587, Addis Ababa, Ethiopia.
- Asnakech T, Derera J, Sibiya J, Asnake F (2016) Participatory assessment of production threats, farmers’ desired traits and selection criteria of faba bean (Vicia faba) varieties: Opportunities for faba bean breeding in Ethiopia. Indian J Agric Res 50: 295-302.
- Faostat (2020) Statistical database of agricultural production. Rome, Italy.
- Aboytu S (2019) Soil Acidity and its Management Options in Ethiopia: A Review. IJSRM 9: 2321-3418.
- Fekadu E, Kibret K, Melese A (2019) Integrated Acid Soil Management for Growth, Nodulation, and Nutrient Uptake of Faba Bean (Vicia faba) in Lay Gayint District, Northwestern Highlands of Ethiopia; International J of Agr.
- Tadele M, Mohammed W, Jarso M (2021) Yield Stability and Genotype Environment Interaction of Faba Bean (Vicia faba L.). In J of Plant Br Crop Sci 7: 833-846.
- Tadesse A, Abebe A, Deresa T (2018) Faba bean Production Guideline Using Rhizobial Bio-fertilizer Technology: Ethiopian Institute of Agricultural Research, Addis Ababa, Ethiopia.
- Agegnehu G, Fessehaie R (2006) Response of faba bean to phosphate fertilizer and weed control on Nitisols of Ethiopian highlands. Italian Journal of Agronomy 1: 281-290.
- Getachew A, Chilot Y, Teklu E (2019) Soil Acidity Management. Ethiopian Institute of Agricultural Research (EIAR). Addis Ababa, Ethiopia.
- ATA (2014) Soil Fertility Mapping and Fertilizer blending. Agricultural Transformation Agency (ATA), Addis Ababa, Ethiopia.
- Regassa H, Agegnehu G (2011) Potentials and limitations of acid soils in the highlands of Ethiopia: A review. In “Barley research and development in Ethiopia” (B. Mulatu and S. Grando, eds.) 103-112.
- Tegbaru B (2015) Soil Fertility Mapping and Fertilizer Recommendation in Ethiopia: Update of EthioSIS project and status of fertilizer blending plants. 2nd IPI-MoANR-ATA- Hawassa University Joint Symposium 24th November 2015.
- Brady N, Weil R (2016) The nature and properties of soils; Pearson Education, Columbus, EUA.
- Agegnehu G, Sommer K (2000) Optimization of the efficiency of phosphate fertilizers in acidic ferralitic soils of the humid tropics. Ethi J of Na Res 2: 63-77.
- Abreha K, Heluf G, Tekalign M, Kindie T ( 2013) Wheat Crop Response to Liming Materials and N and P Fertilizers in Acidic Soils of Tsegede Highlands, Northern Ethiopia. Agri Forestry and Fisheries 2: 126 -135.
- Agegnehu G, Fikre A, Tadesse A (2006) Cropping Systems, Soil Fertility and Crop Management Research on Food Legumes in the Central Highlands of Ethiopia: A Review. Food and Forage Legumes, ICARDA, Addis Ababa, Ethiopia 2: 135-145.
- Fekadu E, Kibret K, Melese A, Bedadi B (2018) Yield of faba bean (Vicia faba L.) as affected by lime, mineral P, farmyard manure, compost and rhizobium in acid soil of Lay Gayint District, northwestern highlands of Ethiopia. Agric & Food Secur 7: 16.
- Mesfin T, Mohammed W, Jarso M (2021) Grain yield and other agronomic performances of faba bean (Vicia faba L.) genotypes under soil acidity stress tested with and without lime application in the central highlands of Ethiopia. Int J Agri Biosci 10: 147-157.
- Tegbaru B (2015) Soil Fertility Mapping and Fertilizer Recommendation in Ethiopia: Update of Ethiosis project and status of fertilizer blending plants. 2nd IPI-MoANR- ATA- Hawassa University Joint Symposium 24th November 2015.
- Belachew K, Stoddard F (2017) Screening of faba bean (Vicia faba L.) accessions to acidity and aluminum stresses. Peer J 8: e2963.
- Tadele M (2020) Impacts of Soil Acidity on Growth Performance of Faba bean (Vicia faba L.) and Management Options. Acad Res J Agri Sci Res 8: 423-431.
- Agegnehu G, Amede T, Erkossa T, Yirga C, Henry C, et al. (2021) Extent and management of acid soils for sustainable crop production system in the tropical agroecosystems: A review. Acta Agriculturae Scandinavica, Section B; Soil & Plant Science. Taylor & Francis publishing group 71: 852-869.
- Tadele M, Mohammed W, Jarso M (2021) Variation in genetic variability and heritability of agronomic traits in Faba bean (Vicia faba L.) genotypes under soil acidity stress evaluated with and without lime in Ethiopia. Afr J Agric Res 17: 355-364.
- Damene D (2003) Yield Response of Bread Wheat (Triticum aestivum L.) to Applied Levels of N and P Fertilizers on Nitisol of Dawro Zone, Southwestern Ethiopia. M.Sc. Thesis in Agriculture, Alemaya University, Ethiopia.
- Bore G, Bedadi B (2015) Impacts of land use types on selected soil physico-chemical properties of Loma Woreda, Dawuro zone, southern Ethiopia. Sci Technol Arts Res 4: 40-48.
- Van Reeuwijk L (1992) Procedures for soil analysis, 3rd Ed. International Soil Reference and Information Center (ISRIC), Wageningen, the Netherlands
- Chapman H (1965) Cation exchange capacity. In: Black CA, Ensminger, LE, Clark FE (eds.). Methods of soil analysis, Am Soc Agro Inc, Madison, Wisconsin, USA. 891-901.
- Walkley A, Black A (1934) An examination of the Degtjareff method for determining soil organic matter and a proposed modification of the chromic acid titration method. Soil Sci 37: 29-38.
- Jackson M (1958) Soil Chemical Analysis. Inc, Englewood Cliffs, New Jersey.
- Bouyocous JG (1962) Hydrometer method improved for making particle size analysis of soil. Agron J 54: 179-186.
- Mehlich (1984) Mehlich III soil test extractant; A modification of Mehlich II extractant. Communications in Soil Science and Plant Analysis 15: 1409-1416.
- Hong T, Ellis R (1996) A protocol to determine seed storage behaviour. IPGRI Technical Bulletin No. 1. (J.M.M. Engels and J. Toll, vol. eds.). International Plant Genetic Resources Institute, Rome, Italy.
- Fischer R, Maurer R (1978) Drought resistance in spring wheat cultivars. I. Grain yield responses. Aust. J Agric Res 29: 897-912.
- Payne R (2014) A Guide to Anova and Design in GenStat® (17th Edition), VSN International
- Gomez K, Gomez A (1984) Statistical Procedures for Agricultural Research, 2nd Edition. John Wiley & Sons, New York.
- CIMMYT (1988) An Economics Training Manual. Completely revised edition DF Mexico.
- Landon J (1984) Booker tropical soil manual A handbook for soil survey and agricultural land evaluation in the tropics and subtropics. Booker Agricultural International London.
- Ethio SIS (2014) Soil Fertility Status and Fertilizer Recommendation Atlas for Tigray Regional State Ethiopia EthioSIS Addis Ababa Ethiopia 2014.
- Lindsay W, Norvell A (1978) Development of a DTPA Soil Test for Zinc, Iron, Manganese, and Copper. Soil Science Society of American Journal 42: 421-428.
- Tadele M, Mohammed W, Jarso M (2019) Genetic Variability on Grain Yield and Related Agronomic Traits of Faba Bean Vicia faba L Genotypes Under Soil Acidity Stress in the Central Highlands of Ethiopia. Chemical and Biomolecular Engineering 4: 52-58.
- Ashango Z, Amsalu B, Fikre A, Tumisa K, Negash K (2016) Seed Yield Stability and Genotype Environment Interaction of Common Bean Phaseolus vulgaris L Lines in Ethiopia. International Journal of Plant Breeding and Crop Science 3: 135-144.
- Geleta D, Bekele G (2022) Yield Response of Faba Bean to Lime NPSB and Rhizobium Inoculation in Kiremu District Western Ethiopia. Journal of Applied and Environmental Soil Science Hindawi
- Kubure E, Raghavaiah V, Hamza I (2016) Production Potential of Faba Bean (Vicia faba L Genotypes in Relation to Plant Densities and Phosphorus Nutrition on Vertisols of Central Highlands of West Showa Zone Ethiopia East Africa. Adv Crop Sci Tech.
- Tolessa T, Keneni G, Mohammad H (2015) Genetic progresses from over three decades of faba bean Vicia faba L breeding in Ethiopia. AJCS 1: 41-48.
- USDA (1999) Liming To Improve Soil Quality in Acid Soils. Agronomy technical note.
Citation: Ashango Z (2022) Acid Soil Resistance of Faba Bean (Vicia faba L.) Genotypes in the Highlands of Dawro Zone, Southwest Ethiopia. J Plant Sci Curr Res 6: 018.
Copyright: © 2022 Zeleke Ashango, et al. This is an open-access article distributed under the terms of the Creative Commons Attribution License, which permits unrestricted use, distribution, and reproduction in any medium, provided the original author and source are credited.