Adaptation Trial of Brachiaria Grass Varieties in West and Kellem Wollega Zones of Oromia, Ethiopia
*Corresponding Author(s):
Yerosan WekgariOromia Agricultural Research Institute, Haro Sabu Agricultural Research Center, Haro Sabu, Ethiopia
Email:wyerosan2019@gmail.com
Abstract
The experiment was carried out to identify better adaptable, forage yielding and quality of the tested variety/ies in study area. Brachiaria decumbens 194, Brachiaria mutica 18659, Brachiaria mutica 6964 and Brachiaria mulat were the four Brachiaria grass varieties that were evaluated and arranged in a Randomized Complete Block Design (RCBD) with three replications. Morphological characteristics, forage dry matter (DM) yield, seed yield and chemical composition of forage samples were analysed derived from standard methods. The results indicated that there were significant differences across the evaluated varieties for all measured agronomic parameters. The examined grasses produced varying amounts of forage DM and seed yield. Higher DM and seed yield were obtained from Brachiaria mutica 18659 (14.24 t/ha) followed by Brachiaria mutica 6964 (13.88 t/ha) and Brachiaria decumbens (196.87 kg/ha) whereas the lower was obtained from Brachiaria decumbens (5.70 t/ha) and Brachiaria mulat (113 kg/ha), respectively than the remaining evaluated grass varieties. The chemical composition analysed was varied among the evaluated brachiaria grass varieties except DM content. Brachiaria mutica 6964 (12.64%) had higher CP content, though the lowest was obtained from Brachiaria mulat (11.86%). Both Brachiaria mutica varieties were resulted in greater forage DM yield with a high concentration of crude protein. Therefore, the two grass varieties, Brachiaria mutica 18659 and Brachiaria mutica 6964 are more suited and produce better quantity and quality of forage for animal feed and it was suggested for the study area and comparable agro-ecologies.
Keywords
Brachiaria grass; Chemical composition; Forage yield; Variety
Introduction
Ethiopia has a huge livestock population, and animals are essential to the country because they serve a wide range of social and subsistence-related tasks. Despite the huge livestock population and the favorable environmental conditions now in place, the current livestock involvement is below its potential because of many limitations. One of the main issues among the many issues is the lack of high-quality and sufficient feed, which has an impact on the output of ruminant livestock, especially during the dry season [1], when feedstuffs are essential for ensuring that livestock is productive. In Ethiopia, small-scale livestock keepers rely on naturally occurring pastures and crop leftovers, which are deficient in nutrients and provide insufficient nutrition to grazing cattle. Therefore, one strategy for overcoming the current supply and nutrient limits on livestock production is the development or use of potential tropical fodder crop species as a feed source.
Brachiaria grass, which is native to Eastern Africa and is often farmed for animal feed in South America and East Asia, may play a significant role in delivering a significant amount of high-quality forage under both intensive livestock production systems and smallholder farming practices [2]. In addition to being used as cattle feed, Brachiaria grass is well known for its major contribution to carbon sequestration, ecological restoration, and soil erosion control, as well as its critical role in lowering greenhouse gas emissions and nutrient losses from soil [3]. A tropical grass called Brachiaria is well adapted to a dry season and has strong drought tolerance. It produced a high yield [4], responded admirably to fertilizer, remained consistently green during the dry season, and was suitable for grazing, making hay, silage, and providing fresh food in a ditch (cut and carry method). Because brachiaria grass is multi-cut, it offers more forage per unit area, assures a steady supply of forage, and has the potential to address the issues associated with feed scarcity [5]. According to Cook et al. [6], Brachiaria grass is appealing to animals and encourages intake. The CP value ranged from 9 to 20% depending on soil fertility and management.
To provide enough high-quality feed for livestock, it is necessary to introduce and create superior forage grass. Accordingly, the evaluation of Brachiaria grasses' adaptability for forage dry matter production and quality potential capacity is crucial for the sustainable contribution of feed resources in the study area. This will help to improve the forage resource base for livestock. Therefore, the goal of the study was to evaluate the tested varieties of Brachiaria grass in the study area in terms of adaptability, forage yield, and quality.
Materials And Methods
Description of the study area
The study was conducted over two consecutive cropping seasons at the Haro Sabu Agricultural Research Center in three locations: Haro Sabu (On station), Kombo from Kellem Wollega, and Nedjo from West Wollega zone of Oromia region. The Center was situated in the Kellem Wollega zone of the Oromia region, Western Ethiopia, with the experimental areas' respective altitudes being 1515, 1750, and 1900 m above sea level for Haro Sabu, Kombo, and Nedjo. The average temperature of the experimental area is 25, 24.5 and 20.20c for Haro sabu, Kombo and Nedjo, respectively. The research sites are located sub-humid climatic zone with about 1200, 1250, 1450 mm of an average rain fall for Haro sabu, Kombo and Nedjo sites, respectively (Dale Sadi, Sadi Chanka and Nedjo Woreda Agricultural and Natural Resource office, Unpublished).
Plant materials (Treatments) and experimental design
Four Brachiaria grass varieties (Brachiaria decumbens 194, Brachiaria mutica 18659, Brachiaria mutica 6964 and Brachiaria mulat) were taken from Mechara Agricultural Research Center and evaluated using randomized complete block design (RCBD) with three replications. The plot was 1.8 m length (6 x 0.50 m x 1.8 m = 5.4 m2) and had a surface area of 5.4 m2. The grasses were planted vegetatively in the form of root splits with intra and inter row spacing of 0.3 and 0.5 meters, respectively. Plot and block distances were maintained at 1 and 1.5 meters, respectively. During planting season, an inorganic fertilizer rate of 100 kg/ha DAP and 25 kg/ha UREA was used. Weeding procedures were implemented as early as possible by hoeing and hand weeding in all plots on a regular basis during the establishing period and as necessary.
Data collection and measurements
Measurements were made of plant characteristics (plant height, tiller number per plant, leaf number per plant), leaf to stem ratio, feed output, and seed yield before and after harvest. Using a stick meter, the height of five randomly chosen plants from each plot was measured from the ground up to the top leaf. Five randomly chosen plants from each plot were used to calculate the average number of tillers and leaves per plant. In order to calculate LSR, plants were cut at the ideal harvesting time from a random sample of inner rows, detached into leaves and stem, and weighed.
Forage yield was determined when plants were harvested at forage harvesting time from the two chosen middle rows of each plot at a height of 5 cm above the ground level. A field balance was used to weigh the total fresh weight from each plot in the field immediately following mowing. To calculate the dry matter yield, an estimated 300gm sub-sample from each plot was dried in an oven for 72 hours at 65 0c. Seed yield was determined when plants are harvested at optimum seed harvesting time from the harvested rows after threshing and winnowing.
Chemical analysis of feed samples
Brachiaria grass samples were gathered from each plot and dried in a forced draft oven at 65 °C for 72 hours before being ground in a Wiley mill and passed through a 1 mm sieve screen for chemical analysis. DM and ash contents were calculated utilizing the AOAC's [7], stated methodology. Total N was obtained using the Kjeldhal process (AOAC, 1990), and CP was derived by multiplying percent nitrogen by factor 6.25 [7]. Neutral detergent fiber (NDF), acid detergent fiber (ADF), and acid detergent lignin (ADL) were analyzed using the Van Seost method [8].
Statistical analysis
The analysis of variance (ANOVA) tool was used to analyze the data using SAS [9]. At a 5% level of significance, differences between means were separated using least significance differences (LSD). The following model was used to analyze the data: Yij= µ + Ti + Bj + £ij, where: Yij is the Response (dependent) variable of ijth, µ is the overall mean, Ti is the ith effect of Treatment (Variety), Bi is the jth effect of block, εij is the Random error.
Results And Discussion
Combined analysis of variance
In Table 1, the measured agronomic and DM yield characteristics for the Brachiaria grass are combined with analysis of variance results. The findings revealed significant (P < 0.05) differences between the tested varieties for the following traits: days to flowering, plant height, tillers per plant, leaves per plant, leaf to stem ratio (LSR), and DM production. The variations in yield and growth parameters of brachiaria grass in the study were strongly influenced by location. Except for the number of leaves per plant and LSR, the year had a substantial impact on yield and growth features. For growth characteristics and dry matter yield, the Variety*Location*Year interaction effects also showed substantial differences. Major variations in varieties are caused by the variety, year, and site crossover interaction effect. Dixon and Nukenine [10] state that the interaction results from variations in a cultivar's relative performance across habitats and seasons as a result of the genotypes' disparate responses to various edaphic, climatic, and biotic variables.
|
Source of variation |
df |
Mean square |
|||||
|
DF |
PH |
NTPP |
NLPP |
LSR |
DMY |
||
|
Replication |
2 |
16.36ns |
157.04ns |
12.78ns |
9.69ns |
0.007ns |
0.46ns |
|
Variety |
3 |
41.5* |
27350.29** |
225.57** |
208.93** |
0.18** |
303.81** |
|
Location |
2 |
185.86** |
1414.12** |
330.2** |
49.31** |
0.05* |
424.42** |
|
Year |
1 |
4528.34* |
5474.06* |
14722.75** |
4.50ns |
2.45ns |
179.64** |
|
Var*Loc*Yr |
8 |
31.34* |
246.74* |
20.45* |
9.79* |
0.01* |
4.75* |
|
Error |
46 |
10.87 |
70.91 |
9.43 |
2.31 |
0.01 |
1.98 |
Table1: Pooled analysis of variance for Brachiaria grass growth and yield parameters.
df= degree of freedom; DF= days to 50% flowering; PH= plant height; NTPP= number of tillers per plant; NLPP= number of leaves per plant; LSR= leaf to stem ratio; DMY= dry matter yield; Var= variety; Loc= location; Yr= year; ns= non-significant; *= significant at (P < 0.05); **= significant at (P < 0.01)
Agronomic performance of Brachiaria grass
Number of plant survival
The amount of plant endurance of brachiaria sward grown-up in all tested locations and their overall average are presented in Figure 1. Amongst the varieties of brachiaria grass verified, Brachiaria mutica 6964 and Brachiaria mutica 18659 gave higher plant survival at Haro sabu and Kombo location and Brachiaria mulat at Nedjo though Brachiaria decumbens194 had lower survival ability in the all locations. From across locations, the study result showed that the higher plant survival of the grass was recorded from Brachiaria mutica (483 and 484) followed by Brachiaria mulat while the lowest was obtained from Brachiaria decumbens 194. Plant survival was varied among the varieties and such variation might be due to the species differences of the grass.
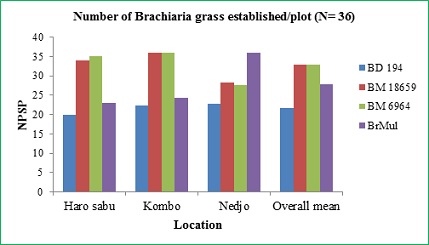
Figure 1: Mean number of plant survived per plot.
NPSP= number of plant survived per plot; BD= brachiaria decumbens; BM= brachiaria mutica; BrMul= brachiaria mulat.
Days of 50% flowering
Days of 50% flowering for the tested brachiaria grass varieties showed significant (P < 0.05) variations at Nedjo location while insignificantly different at Haro sabu and Kombo locations (Table 2). Brachiaria mutica 18659 and Brachiaria mutica 6964 were early reached for days of 50% flowering, while Brachiaria mulat was late reached for 50% flowering (forage harvest) and had comparable with Brachiaria decumbens194 at Nedjo location. The results showed that the tested brachiaria grass had an average 50% flowering time of 106.86 days, with a range of 105.33 to 109.88 days across all locations. Brachiaria mutica 18659 and Brachiaria mutica 6964 both had the early days for 50% flowering (forage harvesting stage), while Brachiaria mulat variety was significantly required more days for the forage harvesting stage (109.88 days), followed by Brachiaria decumbens194 (106.88 days). The genetic diversity of the examined kinds may be to blame for the disparities.
|
Parameters |
Variety |
Locations |
Combined Mean |
||
|
Haro sabu |
Kombo |
Nedjo |
|||
|
DF (50%) |
Brachiaria decumbens 194 |
102.66 |
110 |
108ab |
106.88ab |
|
Brachiaria mutica 18659 |
101.33 |
112 |
102.66b |
105.33b |
|
|
Brachiaria mutica 6964 |
103.66 |
111 |
101.33b |
105.33b |
|
|
Brachiaria mulat |
105 |
111 |
113.66a |
109.88a |
|
|
Mean |
103.16 |
111 |
106.41 |
106.86 |
|
|
CV (%) |
4.57 |
1.27 |
3.29 |
3.08 |
|
|
LSD (5%) |
9.43 |
2.82 |
7.01 |
3.22 |
|
|
SE |
2.72 |
0.81 |
2.02 |
1.09 |
|
|
PH (cm) |
Brachiaria decumbens194 |
47.70c |
85.46b |
41.60c |
58.25b |
|
Brachiaria mutica 18659 |
147.13a |
159.60a |
150.6a |
152.44a |
|
|
Brachiaria mutica 6964 |
159a |
163.26a |
152.86a |
158.37a |
|
|
Brachiaria mulat |
59.06b |
72.13b |
54.36b |
61.58b |
|
|
Mean |
103.22 |
120.11 |
99.85 |
107.73 |
|
|
CV (%) |
8.25 |
8.17 |
3.27 |
7.81 |
|
|
LSD (5%) |
17.03 |
19.61 |
6.53 |
8.23 |
|
|
SE |
4.92 |
5.66 |
1.88 |
2.80 |
|
Table 2: Mean days of 50% flowering and plant height of Brachiaria grasses tested at each locations.
a-cMeans with different letters in a column significantly different (P < 0.05). DF= days of flowering; PH= plant height; CV= coefficient of variance; LSD= least significance difference; SE= standard error; cm= centimetre
Plant height at forage harvesting stage
According to an analysis of variance, the Brachiaria varieties at the three locations had significantly different plant heights (P < 0.05) (Table 2). When fodder was harvested, the shortest plant height was achieved from the variety Brachiaria decumbens194 at all locations, while the maximum plant height was obtained from Brachiaria mutica 6964 and was equivalent with Brachiaria mutica 18659. The average plant height of the tested brachiaria varieties across all locations ranged from 58.25 to 158.37 cm with an average of 107.73 cm. The aggregate mean of all locations over two years revealed that Brachiaria mutica 6964 had the highest mean plant height, followed by Brachiaria mutica 18659, and that Brachiaria decumbens 194 had the lowest. The various phenotypic and genetic characteristics of the species were to blame for the variations in plant height among the examined varieties. The results of the current study showed that the several brachiaria grass accessions tested in the Eastern lowlands of Oromia, Ethiopia, ranged in height from 66.05 to 155 cm [11]. In comparison to Brachiaria hybrid (Mulato II) grass and other cultivars of brachiaria grass assessed in Kenya's dry areas, the present result's plant height was higher [12]. However, this result is inferior than the mean height of 139.33 cm as reported by Gadisa et al. [13] for akin to Brachiaria sward evaluated at Mechara, Eastern Ethiopia. This difference might be due to variations of genotypes, agronomic activities, various soil and environmental adaptability [14].
Tiller number per plant
At the forage harvesting stage, there was a significant difference (P < 0.05) in the tiller number per plant (TNPP) of the brachiaria sward between the studied types at the Haro sabu and Nedjo locations, but not at the Kombo location (P>0.05). The evaluated Brachiaria grass kinds were shown to have a significant influence (P < 0.05) according to the combined analysis of variance results (Table 2). Brachiaria mutica 18659 (27.07), which is the same as Brachiaria mutica 6964, was the species with the most tillers. Brachiaria decumbens 194 (16.18) had the least number of tillers of any species. Tillers density is an essential characteristic of grasses as it increases the chance of endurance and quantity of available forages [15] and it also vital in forage plants, due to its sway in leaf-area production and DM yield. The results in this study are lower than the tiller number of brachiaria ecotypes tested in the Northern Ethiopia [16] and brachiaria accessions tested in Eastern low lands of Oromia, Ethiopia [11]. On the other hand, tiller number of the current study higher than the brachiaria grass cultivars evaluated at age of 12 weeks in Kenya dry lands [17].
|
Parameters |
Variety |
Locations |
Combined Mean |
||
|
Haro sabu |
Kombo |
Nedjo |
|||
|
TNPP (counts) |
Brachiaria decumbens194 |
11.50b |
25.73 |
11.31b |
16.18c |
|
Brachiaria mutica 18659 |
26.93a |
31.20 |
23.10a |
27.07a |
|
|
Brachiaria mutica 6964 |
24.70a |
32.50 |
22.20a |
26.46ab |
|
|
Brachiaria mulat |
24.83a |
27.33 |
19.31a |
23.82b |
|
|
Mean |
21.99 |
29.19 |
18.98 |
23.38 |
|
|
CV (%) |
4.90 |
13.66 |
15.68 |
13.13 |
|
|
LSD (5%) |
4.90 |
7.96 |
5.94 |
3 |
|
|
SE |
1.41 |
2.30 |
1.71 |
1.02 |
|
|
LNPP (counts) |
Brachiaria decumbens194 |
6.80b |
6.33b |
5.26b |
6.13b |
|
Brachiaria mutica 18659 |
18.73a |
14.26a |
11.05a |
14.68a |
|
|
Brachiaria mutica 6964 |
17.40a |
16.06a |
11.26a |
14.91a |
|
|
Brachiaria mulat |
6.86b |
7.33b |
6.20b |
6.80b |
|
|
Mean |
12.45 |
11 |
8.44 |
10.63 |
|
|
CV (%) |
11.43 |
17.84 |
13.13 |
14.29 |
|
|
LSD (5%) |
2.84 |
3.92 |
2.21 |
1.48 |
|
|
SE |
0.82 |
1.13 |
0.64 |
0.50 |
|
|
LSR |
Brachiaria decumbens194 |
0.40c |
0.38b |
0.51b |
0.43c |
|
Brachiaria mutica 18659 |
0.64b |
0.52ab |
0.53b |
0.56b |
|
|
Brachiaria mutica 6964 |
0.59b |
0.43b |
0.64b |
0.55b |
|
|
Brachiaria mulat |
0.80a |
0.67a |
0.86a |
0.78a |
|
|
Mean |
0.61 |
0.50 |
0.63 |
0.58 |
|
|
CV (%) |
11.27 |
15.5 |
15.98 |
3.08 |
|
|
LSD (5%) |
0.13 |
0.08 |
0.20 |
3.22 |
|
|
SE |
0.03 |
0.05 |
0.05 |
0.03 |
|
Table 3: Mean number of leaf per plant, tiller number per plant and LSR of brachiaria sward varieties across locations for two years (2019 & 2020).
a-cMeans with different letters in a column significantly different (P < 0.05). TNPP= tiller number per plant; LNPP= leaf number per plant; LSR= leaf to stem ratio; CV= coefficient of variance; LSD= least significance difference; SE= standard error.
Leaves number per plant
The analysis of variance results for the number of leaves per plant revealed significant variations between brachiaria grass varieties at the forage harvesting stage at all research locations (P < 0.05). With values ranging from 6.13 to 14.91, the brachiaria grass varieties' average number of leaves per plant was 10.63. The Brachiaria mutica 6964 plant had the largest number of leaves (14.91), which is comparable to the Brachiaria mutica 18659 plant's (14.68), while the Brachiaria decumbens194 plant had the lowest number (6.13).
Leaf to stem ratio (LSR)
At each and every location, LSR varied significantly between types (Table 3). Although Brachiaria decumbens194 had a lower LSR value overall, Brachiaria mulat had a higher LSR value. Accordingly, there were differences in the overall average of LSR between the different kinds, which ranged from 0.38 (Brachiaria decumbens194) to 0.86 (Brachiaria mulat). The leaf to stem ratio of brachiaria grass ranged between 1.12 and 1.82 in the present study, which was less successful than the work described by Wondimagegn et al. [18]. The average of this result, however, is greater than the leaf to stem ratio for Brachiaria brizantha (0.4) in Mexico [19] and comparable with the LSR (0.55) for related brachiaria types examined at Mechara, Eastern Ethiopia [13].
Forage dry matter yield
Between the tested brachiaria varieties across the testing years and locations, forage DMY showed a significant (P < 0.05) variation (Table 4). At Haro Sabu, the DM yield ranged from 5.48 to 15.18 t/ha; at Kombo, it was 7.85 to 19.81 t/ha; and at Nedjo, it was 3.77 to 8.52 t/ha. At both Haro sabu and Nedjo, the variety Brachiariamutica18659 produced the greatest mean DMY. Similar to this, Brachiaria mutica variety 6964 produced the highest mean DMY at Kombo. However, among all locations, variety Brachiaria decumbens194 produced the lowest DMY. According to this study, the maximum height, large, thick stems, long leaves, and greater leaf numbers of the Brachiaria Mutica species are primarily responsible for their high dry matter yields.
|
Variety |
DMY (t/ha) |
Combined mean |
||
|
Haro sabu |
Kombo |
Nedjo |
||
|
Brachiaria decumbens194 |
5.48c |
7.85c |
3.77d |
5.70c |
|
Brachiaria mutica 18659 |
15.18a |
19.17a |
8.52a |
14.29a |
|
Brachiaria mutica 6964 |
15.04a |
19.81a |
6.79b |
13.88a |
|
Brachiaria mulat |
10.57b |
11.02b |
5.63c |
9.07b |
|
Mean |
11.57 |
14.46 |
6.18 |
10.74 |
|
CV (%) |
11.65 |
11.56 |
13.80 |
13.1 |
|
LSD (5%) |
1.67 |
2.07 |
1.05 |
0.94 |
|
SEM |
0.55 |
0.68 |
0.34 |
0.33 |
Table 4: Mean forage DMY (t/ha) of four brachiaria grass varieties tested across locations for two years at forage harvesting time.
a-dMeans with different letters in a column significantly different (P < 0.05). DMY= dry matter yield; CV= coefficient of variance; LSD= least significance difference; SE= standard error
A combined study revealed that the tested varieties DMY differed considerably (P < 0.05) from one another. The average forage DM yield was 10.74 t/ha, with a range of 5.7 to 14.29 t/ha. The taller cultivars produced higher dry matter yields than the shorter kinds, according to studies by Tessema [20] and Ishii et al. [21]. Variables in growth rate and growth habit, which are mediated by genotypic and phenotypic disparities as well as environmental variables, can be linked to differences in dry matter yields among the grasses. In comparison to a comparable grass variety assessed at Bako, Western Ethiopia, and reported by Mokonnen et al. [22], Brachiaria decumbens from our study had a lower dry matter yield. Similarly, the mean DMY of 13.9 t/ha for Brachiaria grass varieties evaluated at Mechara, Eastern Ethiopia is also lower than this result [13]. However, Wondimagegn et al. [18] reported that the mean DMY of brachiaria hybrid (Mulato II) grass tested in Northern Ethiopia was lower than that of the current study. The significant variations were likely caused by various agro-ecologies, agronomic practices like harvesting time, spacing, cutting cycle, fertilizer, different soil types, and climatic factors.
Seed yield of Brachiaria grass
The seed yield of brachiaria grasses tested across three locations for two years are showed in Figure 2. Significance differences were observed among the four brachiaria grass varieties in all locations. Similarly, the overall average of seed yield of the tested brachiaria grass was significantly different among them and the seed yield ranged between 113 to 196.87 kg/ha. Brachiaria decumbens194 was the most seed yield productive variety, yielding 196.87 kg/ha followed by Brachiaria mulat (150 kg/ha). However, the rest two varieties produced significantly lower yields. The high seed production potential of Brachiaria decumbens ranged between 405 to 484 kg/ha has been reported earlier by Mokonnen et al. [22], which was higher than result of the present study. The seed yield from two brachiaria hybrid cultivars (Brachiaria ruziziensis x B. brizantha cv. Mulato and B. ruziziensis x B. Decumbens x B. brizantha cv. Mulato II) was lower than the present result [23]. Environmental factors, agronomic practices, and genotypes may be responsible for this variation.
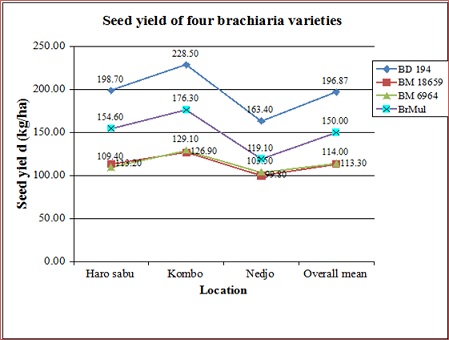 Figure 2: Mean seed yield of four brachiaria grass tested across locations for two years.
BD= brachiaria decumbens; BM= brachiaria mutica; BrMul= brachiaria mulat; kg= kilogram; ha= hectare
Chemical composition of Brachiaria grass
Table 5 lists the chemical composition of the brachiaria grass varieties that were tested. The current findings demonstrated that, aside from dry matter content, there were considerable differences in the chemical composition across the various brachiaria grass varieties.
The evaluated brachiaria grasses did not differ in their DM content (P>0.05) (Table 5). Numerically, Brachiaria mulat had a greater DM content (93.47%), but Brachiaria decumbens 194 had a lower one (92.50%). The lack of variation in dry matter content can be attributed to factors relating to the soil, the environment, and perhaps the physiological stage of the plant at the time of forage collection. The ash content of the current result, however, greatly differed between the varieties. Ash content varied among the examined grass types, with Brachiaria decumbens194 having the highest value (9.53%) and Brachiaria mutica 18659 having the lowest value (which was comparable with the other varieties); this variance was attributable to varietal differences between the grass. Additionally, climatic and soil variables affect how much crude ash different cultivars contain [24].
The analysis of variance results for crude protein showed a significant variation between the brachiaria grass kinds (Table 5). With a mean of 12.2%, CP content ranged from 11.86 to 12.64%. Brachiaria mutica 6964, one of the types evaluated in this study, had the highest CP content (12.64%), which was comparable to that of Brachiaria decumbens194 (12.21%), and Brachiaria mulat had the lowest (11.86%). Possible causes for the variation in crude protein content include genetic variations. The CP value of this study was found to be within the ranges of CP of brachiaria grass from 9-20% depending on soil fertility and management [6]. The present outcome values were lower than the CP content of Brachiaria hybrid Mulato II (13.3%) [25], but higher than the study reported by Mutimura and Everson [26] which had a CP of 11.1%. According to Humphreys [27], the crude protein content of every sample of Brachiaria grass was sufficient for ruminants.
|
Variety |
Chemical Composition (%) |
|||||
|
DM |
Ash |
CP |
NDF |
ADF |
ADL |
|
|
Brachiaria decumbens194 |
92.50 |
9.53a |
12.21ab |
63.20c |
38.37b |
8.24a |
|
Brachiaria mutica 18659 |
93.35 |
8.41b |
12.12b |
65.57a |
40.53a |
7.29b |
|
Brachiaria mutica 6964 |
92.85 |
8.18b |
12.64a |
65.23a |
39.89ab |
6.62b |
|
Brachiaria mulat |
93.47 |
8.40b |
11.86b |
64.22b |
40.41a |
6.73b |
|
Mean |
93.04 |
8.63 |
12.20 |
64.55 |
39.80 |
7.22 |
|
CV (%) |
0.81 |
3.81 |
1.77 |
0.63 |
1.96 |
5.26 |
|
LSD (5%) |
1.52 |
0.65 |
0.43 |
0.81 |
1.55 |
0.76 |
|
SEM |
0.44 |
0.19 |
0.12 |
0.23 |
0.45 |
0.21 |
Table 5: Mean Chemical composition (%) of four brachiaria grass varieties.
a-bMeans with different letters in a column significantly different (P < 0.05). DM= dry matter; CP= crude protein; NDF= neutral detergent fiber; ADF= acid detergent fiber; ADL= acid detergent lignin; = coefficient of variance; LSD= least significance difference; SE= standard error.
As shown in Table 5, there were substantial differences in the fiber contents of the examined grass varieties (NDF, ADF, & ADL). For determining within the digestibility parameter, a feed's NDF is crucial. The NDF content of Brachiaria decumbens194 was lower, whereas that of Brachiaria mutica 18659, which was comparable to Brachiaria mutica 6964, was higher. The studied variety's various genetic characteristics contributed to the variability in NDF content. According to Singh and Oosting [28], roughage diets with NDF contents of 45-75% and under 45% were generally regarded as medium and high quality feeds, respectively. As a result, the middle range of the present data for NDF content indicates that the forage used in the current investigation has good nutritional value. Van Seost [29] claimed that decreasing the amount of NDF has been linked to improving feed intake by raising digestibility.
ADF is the proportion of the feed or forage that is either completely indigestible or only slowly digestible. In the current study, Brachiaria decumbence194 (38.37%) had lower ADF content than Brachiaria mutica 18659 (40.53%), which was followed by Brachiaria mulat. A lower ADF shows more digestible forage and pleasing.
The studied brachiaria grass showed significant variation in ADL content (Table 5). While Brachiaria mutica 6964 had a lower ADL content (6.62%), Brachiaria decumbens194 had the highest ADL content (8.24%) and was significantly greater than the other evaluated kinds. With the exception of the Brachiaria mutica 6964 and Brachiaria mulat types, all of the brachiaria grasses in the current investigation had ADL contents that above the 7% upper limit that restricts DM intake and livestock production [30]. Due to physical encrustation of the plant fiber, which renders it inaccessible to microbial enzymes [31], lignin is fully indigestible and forms lignin-cellulose/hemicelluloses complexes [32].
Conclusion
In the Kellem and West Wollega Zones, performance testing of four brachiaria grass varieties was done in three locations during two cropping years. In this study, significant differences amongst the studied Brachiaria grass varieties were found in terms of criteria like number of plants that survived, days to 50% blooming, tillers, leaves, plant height, leaf stem ratio, seed yield, and forage DM yield. Aside from DM level, the chemical composition of the tested grass varied among them. According to the findings, the Brachiaria mutica 18659 and 6964 varieties showed more potential for producing dry matter and higher-quality feed. Therefore, of the evaluated grasses, two varieties have been chosen as enhanced, adapted variety in the study area because they have greater potential as fodder plants used for animal feed. Thus, it was advised that these two varieties be tested further and scaled up in the research locations and other regions with comparable agro-ecologies.
Acknowledgement
The trial was funded by the Oromia Agricultural Research Institute, for which the authors are grateful. For offering research facilities, the Haro sabu Agricultural Research Center is gratefully acknowledged. The technical assistant of the research team for animal feed resources and range land management is also thanked for the assistance during the fieldwork.
Conflicts of Interest
Regarding the publishing of this paper, the authors state that they have no conflicts of interest.
References
- Ahmed H, Abule E, Mohammed K, Treydte AC (2010) Livestock feed resources utilization and management as influenced by altitude in the Central Highlands of Ethiopia. Livestock research for rural development
- Miles JW, Valle CB do, Rao IM, Euclides VPB (2004) Brachiaria In: Sollenberger LE; Moser L; Burson B, eds. Warm-season grasses. ASA-CSSA-SSSA, Madi-son, WI, USA 745-783.
- BecA-ILRI (2013) Climate-smart Brachiaria grasses for inproving livestock production in East Africa. The Biosciences eastern and central Africa-International Livestock Research Institute (BecA-ILRI) Hub was established in Nairobi, Kenya.The BecA-ILRI Hub Brachiaria Project.
- Rodrigues RC, Sousa TVR, Melo MAA, Araújo JS, Lana RP, et al. (2014) Agronomic, morphogenic and structural characteristics of tropical forage grasses in northeast Brazil. Trop GrasslForrajes Trop 2: 214–222.
- Stur WW, Hopkinson JM, Chan CP (1996) Regional Expertice with Brachiaria: Asia, the South Pacific, and Australia. In B. a. J.W. Miles, Brachiaria: Biology, Agronomy, and Improvement Cali, Columbia: CIAT and EMBRAPA 258-277.
- Cook BG, Pengelly BC, Brown SD, Donnelly JL, Eagles DA, et al. (2005) Tropical Forages: aninteractive selection tool. [CD-ROM], CSIRO, DPI & F(Qld). Brisbane, Australia: CIAT and ILRI.
- https://www.scirp.org/reference/ReferencesPapers?ReferenceID=1929875
- Van Soest PJ, Roberston JB, Lewis BA (1991) Methods for dietary fiber, neutral detergentfiber, and non starch polysaccharides in relation to animal nutrition. Journal of Dairy Science 74: 3583-3597.
- https://support.sas.com/documentation/onlinedoc/91pdf/sasdoc_91/stat_ug_7313.pdf
- Dixon AGO, Nukenine EN (1997) Statistical analysis of cassava yield trials with the additive main effects and multiplicative interaction (AMMI) model Afr J Root Tuber Crops 3: 46-50.
- Tolera F, Worku B, Wubishet T, Melese F (2021) Adaptability Study of Brachiaria Grass Accessions for Forage Yield andNutritive Value in Lowlands of East Oromia, Ethiopia. Ecology and Evolutionary Biology 6: 42-46.
- Nguku S (2015) An evaluation of brachiaria grass cultivars productivity in semiarid Kenya. MSc. Thesis, South Eastern Kenya University, Kenya
- Gadisa B, Dinkale T, Debela M (2020) Evaluation of Bracharia Grass Genotypes at Mechara Research Station, West Hararghe Zone, EasternOromia, Ethiopia. J Vet Marine Sci 3: 176-182.
- Zaman QM, Hussain N, Aziz A, Hayat K (2006) Performance of high yielding oats varieties under agro-climatic conditions of D. I. Khan. J Agric Res 44: 29-36.
- Laidlaw AS (2005) The relationship between tiller appearance in spring and contribution of dry-matter yield in perennial ryegrass (LoliumperenneL.) cultivars differing in heading date. Grass and Forage Science 60: 200-209.
- Wassie WA, Berhanu AT, Asaminew TW (2018) Evaluation of morphological characteristics, yield and nutritive value of Brachiariagrass ecotypes in northwestern Ethiopia. Agriculture & Food Security 7: 1-10.
- Nguku Susan A, Njarui Donald N, Nashon KR (2016) Primary Production Variables of Brachiaria Grass Cultivars in Kenya Drylands. Tropical and Subtropical Agro ecosystems. 19: 29-39.
- Wondimagegn T, Berhanu A, Mesganaw A (2021) Effects of Plant Spacing and Fertilizer Level on Agronomic Performance and Forage Yield of Hybrid Brachiaria Mulato II Grass, in Chagni Ranch, Awi Zone, Ethiopia.Research & Development 2: 14-19.
- Aldava NJ, Casanova LF, Díaz EVF, Escobedo CA, Estrada MH, et al. (2017) Influence of Leucaenaleucocephala (Lam.) de Wit (Fabaceae) on the forage yield and forage quality of tropical grasses Brachiariabrizantha (Hochst. ex A. Rich.) Stapf and Panicum maximum Jacq.(Poaceae). Inter J Agric Sci 8: 133-137.
- Tessema Z (2005) Variation in growth, yield, chemical composition and in vitro dry matter digestibility of Napier grass varieties (Pennisetum purpureum). Trop Sci 45: 67-73.
- Ishii Y, Yamaguchi N, Idota S (2005) Dry matter production and in vitro dry matter digestibility of tillers among Napier grass (Pennisetum purpureum Schumach) varieties. Grassland Science 51: 153-163.
- Mekonnen D, Waqgari K, Abuye T, Warku T (2021) Effects of Seeding Rate and Sowing Date on Herbage Dry Matter and Seed Yield Performance of Brachiaria Grass Grown under Sub humid Climatic Conditions of Western Oromia. Ethiopia.International Journal of African and Asian Studies 7: 1-6.
- Hare MD, Tatsapong P, Saipraset K (2007) Seed Production of Two Brachiaria Hybrid Cultivars in North-East Thailand. 2. Closing Date Defoliation. Tropical Grasslands. 41: 35-42.
- Acikgoz E (2001) Forage Plants Textbook. Uludag University, Agricultural Faculty, Department of Field Crops, Bursa (in Turkish).
- Clara M (2013) A Comparative Study of the Productivity of Brachiaria Hybrid Cv. Mulato II and Native Pasture Species in Semi-Arid Rangelands of Kenya.MSc. Thesis, University of Nairobi, Kenya.
- Mutimura M, Everson TM (2012) On-farm evaluation of improved Brachiaria grasses in low rainfall and aluminium toxicity prone areas of Rwanda. International Journal of Biodiversity and Conservation 4: 137-154.
- Humphreys LR (1978) Tropical pastures and fodder crops. International Tropical Agriculture Series. Longman, England.
- Singh GP, Oosting SJ (1992) A model for describing the energy value of straws.Indian dairyman XLIV: 322-327.
- Van Soest PJ (1982) Analytical systems for evaluation of feeds. Nutritional ecology of the ruminant 75-94.
- Reed JD, Yilma K, Fossel LK (1986) Factors affecting the Nutritive value of sorghum and millet crop residues. In: J.D. Reed, B.S. Capper and P.J.M.Neate (eds.). Plant breeding and the nutritive value of crop residues. Proceedings of ILCA, workshop held at Addis Ababa, Ethiopia 233-251.
- https://pub.epsilon.slu.se/1870/1/Salifou_Thesis.pdf
- Kellems RO, Church DC (1998) Livestock Feeds and Feeding (4th Edit.) Simon and Schuster. New Jersey, USA 59-61.
Citation: Wekgari Y, Gamachu N, Dereba F (2023) Adaptation Trial of Brachiaria Grass Varieties in West and Kellem Wollega Zones of Oromia, Ethiopia. J Plant Sci Curr Res 7: 026.
Copyright: © 2023 Yerosan Wekgari, et al. This is an open-access article distributed under the terms of the Creative Commons Attribution License, which permits unrestricted use, distribution, and reproduction in any medium, provided the original author and source are credited.