Alcohol Related Crashes in Europe
*Corresponding Author(s):
Eduard MissoniUniversity Of Zagreb, Zagreb, Croatia
Tel:+385 13361814,
Email:emissoni@fpz.hr
Abstract
European-level statistics show that young people aged between 18 and 24 have a higher risk of causing or undergoing such accidents, while 25% of them are attributable to alcohol. The higher health institute estimates that alcohol related road accidents in Italy make up 30-35% of the total number of accidents. An analysis conducted in 2012 under the XX Report ACI-CENSIS on alcohol consumption and behaviors shows that 13.8% of drivers do not abstain from consuming alcohol before driving. Among them 8.2% do not think that alcohol present a problem for their behavior behind the wheel.
Between 2012 and 2015, more than 8 out of 100 people among car drivers have driven under the influence of alcohol, having taken two or more alcohol units an hour before driving. Another 6 out of 100 claim to have been transported by a driver driving under the effect of alcohol. Systematic checks with ethyl test are a proven tool to reduce mortality caused by traffic accidents but are still uncommon, encompassing only 10% of those who have been stopped.
Keywords
INTRODUCTION
The driving task can be divided in three subtasks. The first group includes the tasks on the operational level. They include steering, changing gear, accelerating, braking but also other manual and mostly fully automated actions for maneuvering and keeping the vehicle in an optimum operational state. The second group of subtasks includes the tasks at the tactical level. This consists of the application of the rules of the road and decisions concerning maneuvers that include other road users. The third group includes the tasks at the strategic level. These tasks deal with vehicle choice and route choice. In this particular case one can think of the decision a driver has to take whether he will drive or not after having consumed alcohol.
Alcohol affects task performance at all three levels. On the first level, most skills related to the driving task start to deteriorate at a BAC-level as low as 0.18 g/l [1]. With tracking performance (keeping course) affected first while keeping headway from the vehicle that changes speed is impaired at BAC 0.3 g/l and keeping distance from the vehicle on constant speed is defective at BAC of 0.54 g/l. Choice reaction time begin to deteriorate at a BAC of 0.6 g/l while reactions on a visual detection when driving starts to decrease significantly at a BAC of 0.8 g/l. Decrease in the ability to divide attention between the driving task and another task starts at BACs between 0.3 and 1 g/l.
At the second level, alcohol consumption leads to the increase in the number of mistakes and prolonged reaction times when drivers are confronted with a complex secondary task, even when small quantities of alcohol are consumed, indicates that alcohol causes information processing to be hampered. Under the influence of alcohol, drivers tend to fix their eyes more on the central visual field and fewer eye movements are made to the peripheral view. Using fewer sources in the visual field to obtain information about the environment cause longer time to recognize and respond to vital information about their environment [2].
At the third level, the most important effect of alcohol consumption is on the perceived ease or difficulty of undertaking a given behavior that leads to loss of self-control. After having consumed alcohol a driver is much more inclined to think that he can easily drive safely when he is a bit drunk.
Acute impairments resolve soon after the normalization of the Blood Alcohol Concentration (BAC) and the most important thing is to prevent the person from driving while there is still alcohol in the system. Chronic alcohol consumers can develop brain deficits that persist well after they stop drinking and some impairment cannot restitute to normal even if the person stops drinking permanently. The risk of developing the permanent brain damage from alcohol consumption depends on the age when the person starts to drink, frequency and amount of alcohol per day, gender, comorbidities and use of some drugs, especially psychoactive drugs. Such persons can have impaired driving capabilities even with normal BAC.
According to the World Health Organization (WHO) the main causes of road accidents that cause deaths are:
• Excess speed
• Not using safety devices
• The use of alcoholic drinks by the driver
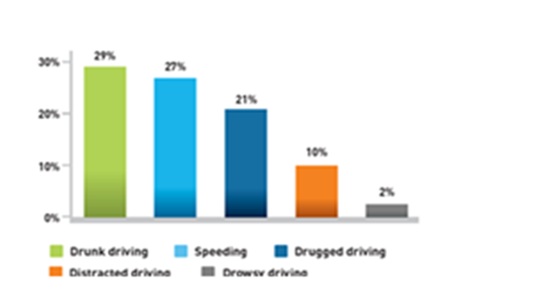
The human factors that impact motor vehicle fatalities (Figure 1) include drunk driving (29%), speeding, accounting for 27% of fatal crashes, drugged driving (21%), distracted driving (10%) and drowsy driving (2%). In the follow picture it is possible to see the distribution of the factors involved in fatal motor vehicle traffic crash in 2015 (data refers to America) [3].
The WHO has also estimated the achievable results intervening on these causes:
• -25% of deaths with a reduction of average speed of 5 km/h
• -15% of deaths with a generalized use of safety devices
• -5/40% of deaths with a reduction of alcohol rate for drivers always at below of 0.5 g/l.
Driving under the effect of alcohol is one of the more risk factors that causes road accidents serious or fatal. Road accidents cause many deaths but also disability, temporary and permanent, with heavy physical, psychosocial consequences on the quality of life.
Drinking alcohol before driving is a socially habitual behavior that is often underestimated and therefore not considered in its risk. Scientific evidence shows that alcohol consumption, even at low doses, is a risk for those who are driving and for people around them.
The problem of alcohol-related accidents is not only due to alcoholics: all drinkers/abusers, even occasional ones, are a risk to the streets, both for themselves and for others.
Guide is a complex task that requires attention and concentration skills. These faculties are heavily influenced by the action of ethyl alcohol which, being a psychoactive substance, interferes with the nervous system and hence its capabilities.
The European Commission estimates that one in four-incident in the EU (25%) is attributable to alcohol. The 96% of people involved in this type of accidents are represented by male individuals, of which 33% are young people between 15 and 34 years. The estimates produced by the European Commission, very conservative in function the state of being drunk, show how every year at least 10,000 people in the European Union die in road accidents caused by alcohol.
European-level statistics show that young people aged 18 and over 24 years are those for which there is a higher risk of causing or undergoing one accident. The latest estimates show that 25% of accidents for young people between 18 and 24 years are attributable to alcohol.
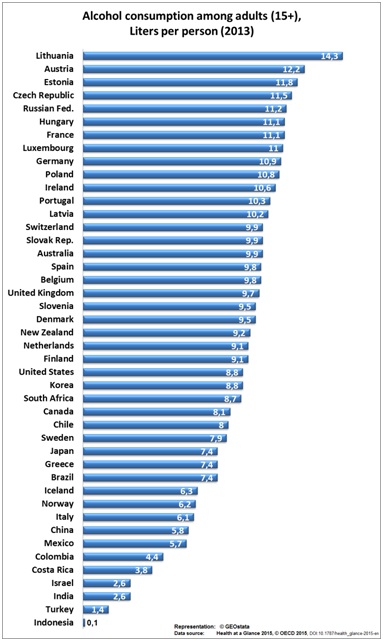
In the following picture (Figure 2) is shown the annual consumption value for each country [4].
The high percentage of alcohol-related accidents is due to the usual alcohol consummation. ISTAT (Italian National Institute for Statistics) data (Figure 3) indicates that 75% of Italians consume alcohol (87% of men and 63% of women) [5]. The first glass of alcohol is consumed at the age of 11-12 years and it is the lowest age of the entire European Union. There are over 3 million risk drinkers and 1 million alcoholics. About 400,000 young people under the age of 17 are alcoholic. Behaviors that exceed the recommendations are noted among young people aged 18-24 (22% and 8.7% respectively) and among adolescents of 11-17 years (21.5% and 17.3%). The most at risk for binge drinking is youth age (18-24 years): 14.5% of young people (21% of males and 7.6% of females) behaves in this way, mostly during moments of socialization. These are the most sensitive age range about alcohol-related accidents. The binge drinking or the drunkenness for you people is very risky, because they don’t have the perception of the risks and consequences of their actions [6].
METHODS AND MEASUREMENTS
It is a measurement tool used to determine the alcohol value, i.e., of ethanol content in the blood. In Italy this are approved devices capable of measuring such concentration through the analysis of air exhaled alveolar air. Ethanol, after being ingested, it is rapidly absorbed from the stomach and the small intestine and is distributed throughout the body water (which, for the human body, is approximately 0.55 l/kg). The majority (about 90%) ethanol is metabolized in the body, while a small part is eliminated in the urine, in sweat and exhaled air: the etanolemia ratio (concentration of ethanol in the blood) and air alveolar is relatively constant, 80 mg of ethanol per 100 ml of blood produce 35 micrograms/100ml of exhaled air ethanol.
The main factors involve on the road are three:
• The vehicle
• Environmental conditions
• The human factor
The last is very important, and it is the only one on which people are directly responsible. It is known that the driver’s altered psycho-physical state, due to alcohol or drugs, is the cause of serious accidents, even fatal.
The negative effects of alcohol on the guide are well known. It acts on different brain functions (perception, attention, processing, evaluation, etc.,), with different effects and closely related to the amount of alcohol present in the blood, i.e., the alcoholic rate.
The alcohol level is measured in grams of alcohol per liter of blood; an alcoholic rate of 1g/liter indicates that in each liter of blood of the subject there is 1 gram of pure alcohol; the same alcoholic rate can also be expressed in the percentage form 0.1%.
1. Generally the alcohol effects are the following [8]:
• Eye problems: Following alcohol intake, disturbances to the eye occur because of reduction of lateral vision (tunnel vision) and of a reduced ability to adapt to vision night.
• Slowdown of reaction times: The reaction time is the time interval between exposure to stimuli and the answer. Response times vary individually and they are influenced by several factors: alcohol makes coordination of movements difficult, increases reaction times, movements and obstacles are perceived with very late.
• Minor concentration: Alcohol intake compromises the supervisory ability, as well as provoking drowsiness and dizziness sleeps.
• Reduction of judicial capacity: Alcohol creates a sense of well-being, security and euphoria that leads to overestimating the abilities and to face risks that in normal situations we avoid it.
The first negative effects start at values of 0.2 g/liter, they concern the ability to divide the attention between two or more sources of information and the interaction with fatigue; with a rate of 0.5 g/liter, the side field of vision, reaction times, stamina resistance, psychomotor coordination begin to be compromised. At a rate of 0.8 g/liter, the previous symptoms worsen and the distances to be evaluated are also compromised, attention decreases considerably, decreasing red light sensitivity. At a rate of 1-1.2 g/liter, the previous symptoms worsen and the euphoria appears, the side vision is greatly compromised, as well as the perception of the distances and the speed of movement of the objects. At rates of between 1.5 and 2 g/liter, all of the above symptoms are exaggerated, with complete underestimation of the risks, the no coordination of the movements (for example, it accelerates instead of braking), strongly slowed reactions. All this is reflected in the risks of a serious accident.
The previous data are resumed in the following table 1.
|
Alcol g/l |
Driving Effect |
|
0.2 |
Reaction times begin to increase |
|
0.4 |
Slow down mental capacity |
|
0.5 |
Legal limit |
|
0.6 |
Europia and erratic perception of the risk |
|
0.7 |
Prolongation of reaction times |
|
0.9 |
Less ability to adapt to darkness |
|
1 |
Drunkenness and unstable balance |
|
1.5 |
Mental confusion and inability to evaluate distances |
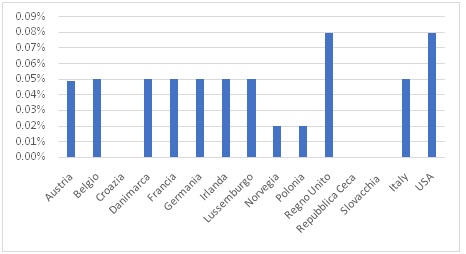
In the following picture (Figure 4) is shown the legal limit of alcohol intake for several countries.
Alcoholic level depends from several individual factors: Depends on the mechanism of alcohol diffusion (from the stomach to the blood and then to cellular brain fluids), the alcohol content of the drinks, the way alcohol is drunk, the sex and age of the subject, its alcohol habit of drinking alcohol.
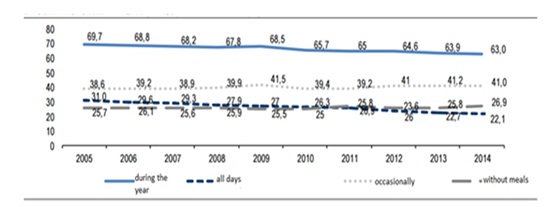
It is possible to see in the following picture (Figure 5) the trade of the alcoholic rate in time.
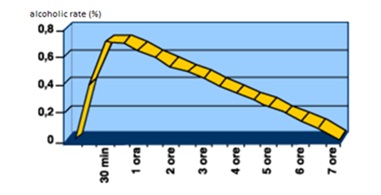
If, in a period of time (for example during and after a meal), you consume subsequent amounts of alcohol, each absorption and elimination curve is added and overlaps with the previous one, resulting in cumulative effects.
RESULTS
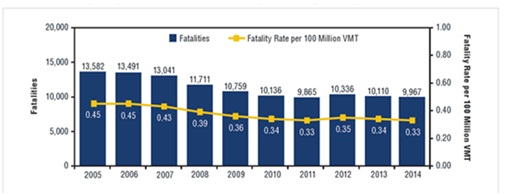
The following picture (Figure 6) presents the fatality numbers and rates for the past decade.
|
Drivers Involved in Fatal Crashes |
2005 |
2014 |
Change in Percentage with BACs0.08+2005-2014 |
||||
|
Total number |
BAC=0.08+ |
Total number of drivers |
BACs 0.08+ |
||||
|
Number |
Percent total |
Number |
Percent total |
||||
|
Total |
59,220 |
12,571 |
21% |
44,583 |
9,417 |
21% |
0 |
|
Drivers by crash type and time of day |
|||||||
|
Single vehicle crash |
|||||||
|
Total* |
22,596 |
8,314 |
37% |
17,813 |
6,053 |
34% |
-3 |
|
Daytime |
8,914 |
1,554 |
17% |
7,085 |
1,240 |
18% |
+1 |
|
Nighttime |
13,389 |
6,601 |
49% |
10,518 |
4,709 |
45% |
+4 |
|
Multiple vehicles crash |
|||||||
|
Total* |
36,624 |
4,257 |
12% |
26,770 |
3,364 |
13% |
+1 |
|
Daytime |
22,906 |
1,165 |
5% |
16,397 |
961 |
6% |
+1 |
|
Nighttime |
13,696 |
3,088 |
23% |
10,350 |
2,396 |
23% |
0 |
|
Drivers by time delay |
|||||||
|
Daytime |
31,820 |
2,718 |
9% |
23,482 |
2,201 |
9% |
0 |
|
Nighttime |
27,085 |
9,689 |
36% |
20,868 |
7,105 |
34% |
-2 |
|
Drivers by day of week and time delay |
|||||||
|
Weekday* |
35,780 |
5,358 |
15% |
26,939 |
4,262 |
16% |
+1 |
|
Daytime |
23,231 |
1,506 |
6% |
17,105 |
1,347 |
8% |
+2 |
|
Nighttime |
12,451 |
3,809 |
31% |
9,741 |
2,874 |
29% |
-2 |
|
Weekend* |
23,346 |
7,169 |
31% |
17,589 |
5,134 |
29% |
-2 |
|
Daytime |
8,588 |
1,212 |
14% |
6,377 |
854 |
13% |
-1 |
|
Nighttime |
14,634 |
5,880 |
40% |
11,127 |
4,232 |
38% |
-2 |
DISCUSSION
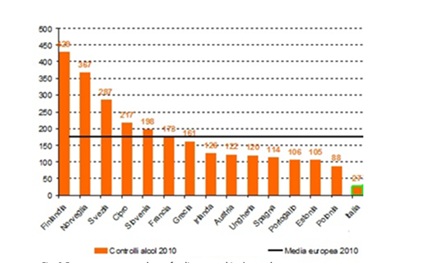
Italy is still lagging behind in alcohol-related injury prevention: there are not so much motor locks and alcohol-zero driving is only applicable to professional drivers and newcomers. In addition, the number of road alcohol controls is growing but is still insufficient. As shown in figure 8, the European average in 2010 was 176 controls per 1,000 inhabitants, while the Italian standard stands at meagre 27 per 1,000 inhabitants.
Alcohol-induced risky driving is often exacebrated by impairing effects on driver skills and poor inhibitory control [10,11].
CONCLUSION
Finally, it is possible to analyze the economic cost of all motor vehicle traffic crashes. For example, in Unites States in 2010 that cost amounted to 242 $billion, of which 44 billion $ resulted from alcohol-impaired-driving crashes. In Italy, according to the study conducted by the Ministry of Infrastructure and Transport, the cost of social accidents with injuries in 2013 was estimated to €17.95 billion. With the additional costs of accident without injured persons, this estimate increases to over €24 billion.
These costs represent tangible losses caused by motor vehicle traffic crashes. However, in cases of serious injuries or death, such costs fail to capture the relatively intangible value of the lost quality-of-life resulting directly from these injuries. When considering the quality-of-life evaluations, in the United States in 2010 it was estimated that the total value of social harm from motor vehicle traffic crashes amounted to $836 billion, of which $201.1 billion resulted from alcohol-impaired-driving crashes.
REFERENCES
- Moskowitz H, Robinson C (1987) Driving-related skills impairment at low blood alcohol levels. In: Noordzij PC, Rosbach R (eds.). Alcohol, drugs and traffic safety, T86. Excerpta Medica,, Amsterdam, Netherlands.
- https://ec.europa.eu/transport/road_safety/specialist/knowledge/alcohol/effects_of_alcohol_consumption/effects_on_driver_capabilities
- http://www.dronet.org/pdf/alcol_e_guida.pdf
- http://www.aci.it/laci/sicurezza-stradale/alcool-e-guida/cosa-ce-da-sapere.html
- http://www.istat.it/it/files/2015/04/statistica_report_alcol_2014.pdf?title=Uso+e+abuso+di+alcol+-+16%2Fapr%2F2015+-+Testo+integrale.pdf
- http://www.my-personaltrainer.it/salute/tasso-alcolemico.html
- https://it.wikipedia.org/wiki/Etilometro
- https://www.ars.toscana.it/it/aree-dintervento/problemi-di-salute/incidenti-stradali-domestici-e-balneari/incidenti-stradali/news/2475-incidenti-stradali-alcol-correlati-dati-preoccupanti-dalla-commissione-europea.html
- Traffic safety facts 2014. U.S. Department of Transportation, NHTSA, Washington DC, USA.
- Missoni E, Boži? B, Missoni I (2012) Alcohol-related road traffic accidents before and after passing of the Road Traffic Safety Act in Croatia. Coll Antropol 4: 1483-1489.
- Laude JR, Fillmore MT (2015) Simulated driving performance under alcohol: Effects on driver-risk versus driver-skill. Drug Alcohol Depend 154: 271-277.
Citation: Missoni E, Mlinari?-Vrbica S, Meschino M, Pancrazi E (2018) Alcohol Related Crashes in Europe. J J Alcohol Drug Depend Subst Abus 4: 008.
Copyright: © 2018 Eduard Missoni, et al. This is an open-access article distributed under the terms of the Creative Commons Attribution License, which permits unrestricted use, distribution, and reproduction in any medium, provided the original author and source are credited.