Another Approach to Detect Malaria Epidemics and to Evaluate the Impact of Their Control Measures in Situation of Lack of Information
*Corresponding Author(s):
Gómez- Elipe APublic Health Department, Universidad Autónoma Metropolitana; Unidad De Investigacion, Hospital Universitario NS Candelaria, Santa Cruz, Spain
Tel:+34 922600544,
Email:aagujai@gobiernodecanarias.org
Abstract
The purpose of this study is to establish a theoretical epidemiologic threshold for the rate of reported malaria cases in order to detect epidemics and evaluate the impact of control measures.
To create the epidemiologic threshold it has been used a forecasting model that reflects the dependence of the magnitude of the rate of malaria reports on the levels of rain, temperature and vegetation density.
The model makes it possible to create a curve of expected non-epidemic case reports with a reliability of 95%. The model identified four epidemics in the 7-year study period and detected the impact of a malaria control campaign in the last year.
The application of this methodological tool permits the timely detection of malaria epidemics and the evaluation of the impact of measures for its control.
Keywords
INTRODUCTION
Highlights
- Malaria is rampant in Africa and causes significant mortality and morbidity
- Malaria transmission is complex and is believed to be associated with local climate changes
- We propose a tool of malaria incidence forecasting for their epidemiological surveillance
- The proposed model could be useful for detecting and preventing malaria epidemics
Our starting hypothesis is that environmental factors such as temperature, precipitation and vegetation levels, as estimators of the population density and infectivity of the vector and the development of the parasite, on the one hand, combined with the level of malaria incidence in a recent period, as an estimator of the magnitude of the parasite reservoir and population susceptibility, on the other, could explain variations in malaria incidence. This study aims to create a theoretical epidemiologic threshold i.e., endemic, non-epidemic, usually expected, normally, incidence, based on the behavior of the incidence rate predicted by a model that establishes the relations among the variables. The purpose is to obtain a simple and easily applied tool that provides a practical and reliable way to identify epidemics, so that health services can implement timely control measures to interrupt the spread of the disease or mitigate its effects, and to assess the effectiveness of health interventions to these ends. Considering the methodological purpose of this study we use only real data in order to verify the validity and accuracy of our theoretical elaboration. This verification uses as empirical material the available reports of monthly malaria cases treated by the medical services routinely collected by the surveillance system, together with monthly levels of rain, temperature and vegetation density in the province of Karuzi, Burundi, during a seven years period.
MATERIAL AND METHODS
One way of symbolically representing these assumptions can be obtained by taking It to mean the malaria incidence rate in month t; Rt as the cumulative level of precipitation in that month; Tt as the mean temperature in that month; Vt as the mean vegetation density in that month; p as the seasonal oscillation period for the previous three variables; and It+k as the malaria incidence rate for a future month that is kmonths from month t. These variables would then be interrelated as follows:
ΣαIt * Σβ sin (2Π/p)(Rt * Tt * Vt) It+k →(a)
This relation represents a cumulative linear combination of previous values of the incidence rate, as an estimator of immunity or population reservoir, and the combination of past levels of rainfall, temperature and vegetation density, as estimators of vector capacity, combined to influence future values of the incidence rate. The term that includes rainfall, temperature and vegetation confers an oscillation in the malaria incidence with a period according to their common seasonality. In expression (a) α is the coefficient for the incidence rate, and β for the amplitude of seasonal oscillation estimated by regression. The use of * as an operator to link the components expresses the lack of a priori knowledge of how they are interrelated. The model combines all those terms having significant autocorrelation and cross-correlation coefficients with the incidence rate in their corresponding lags.
Data processing
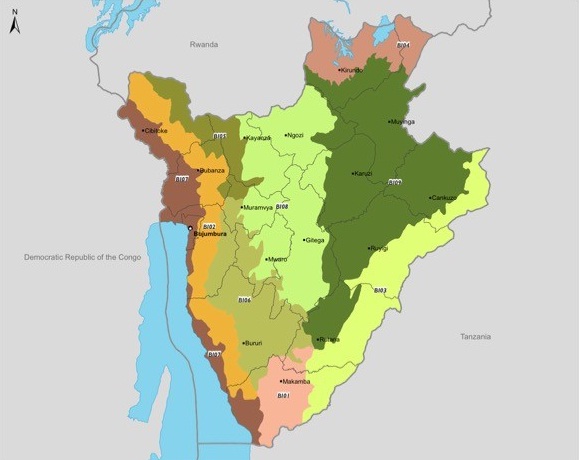 Figure 1: Burundi map of vegetation.
RESULTS
Figure 2 show the 1997-2003 series used to construct the model. Its visual exploration does not seem to indicate any trend; for rain, temperature and vegetation, there is a certain seasonal-type oscillation with a 0.5-1 year period. The results of the trend analysis and periodograms show neither trend nor periodic oscillation in the cumulative monthly rate of malaria reports, while for the rest of the series they confirm the trend absence, and yearly period seasonality. Consequently, for rainfall, temperature and vegetation series the 1997-2002 period is taken as the base, reserving their values during 2003 as the complement, and the malaria rate series is forced to the same cut-offs to form its base and complement.
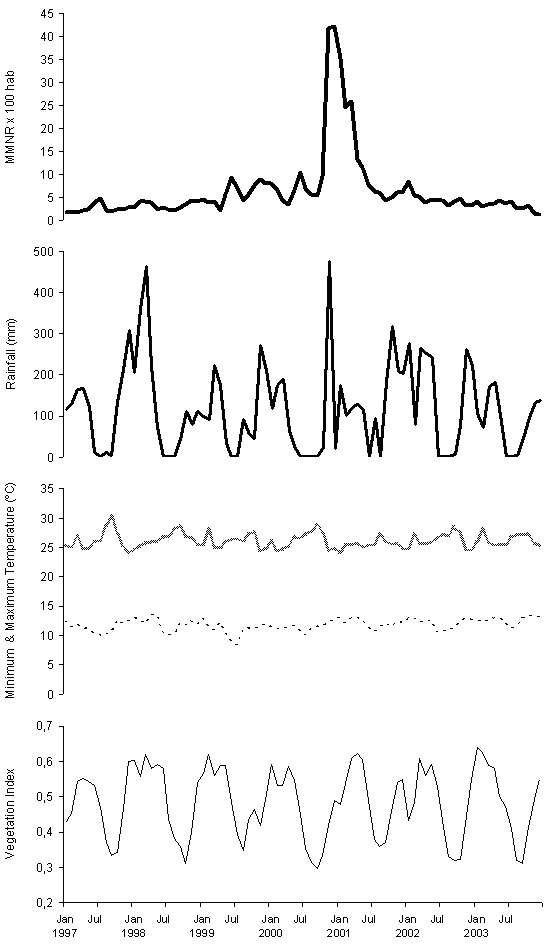 Figure 2: Monthly Malaria Notification Rate per 100 inhabitants in Karuzi province, Burundi, from January 1997 to December 2003 (MMNR, first picture in heavy bold solid line); Monthly cumulative rainfall in mm (Rainfall, second pictures in light bold solid line); Maximum and Maximum monthly temperature in ºC (Maximum Temperature, third picture in bold dashed line; Minimum monthly, fourth picture in light dashed line); and Normalized Difference Vegetation Index (Vegetation Index, fifth picture in light solid line).
Correlograms of the base malaria rates show a non-seasonal configuration with significant coefficients only in lag 1 (ACF = 0.82, PACF = 0.82, both p<0.05) which indicates that ARIMA model (1,0,0) represents the influence of each preceding value on the following one. This model fits with a coefficient of 0.80 (p<0.0001) and explains 80% of the observed variability in the rate, leaving a residual that is nearly white noise, but with hints of regular patterns.
The base periodograms of precipitation, temperature and vegetation show, similar to complete series, a seasonal oscillation with a period of 12 months, therefore term (1) of the model takes the form βsin (0.52 Rt Tt Vt). Cross-correlation of this term with the residuals of ARIMA (1,0,0) shows that only the lag 1 coefficient is significant, therefore the environmental influence on the malaria rate becomes βsin (0.52Rt-1 Tt-1 Vt-1). With the addition of the term for the influence of the environmental variables to the autoregressive term, and after fitting the model, it takes the form:
It = 0.80It-1 + 0.99sin (0.52Rt-1 Tt-1 Vt-1) (b)
This model explains an 82% of the observed variability in the malaria rate (R2adj, p<0.0001) with a 95% CI of 0.68-0.95 (p<0.0001) for the coefficient of the autoregressive term and of 0.97-1.00 (p<0.0001) for the environmental term. Model (b) leaves a white noise residual on the base malaria rates, normally distributed with a mean of 0 and 0.98 SD.
Figure 3 depicts the expected epidemiologic threshold for the malaria rate, with its 95% confidence interval, that is obtained with this model for the period February 1997-December 2002, using the rate for January 1997 as the initial value, and the precipitation, maximum temperature and vegetation density for each preceding month. Table 1 shows the expected non-epidemic monthly cumulative malaria case-reported rate for the base malaria series, the epidemiologic threshold, and the observed value for each month in the period 1997-2002. This epidemiologic threshold identifies four periods of an excess in malaria incidence rates: June-July 1999, October 1999-January 2000, June-July 2000, and October 2000-June 2001, corresponding to the four epidemics that occurred in the study period [13,19]. The two values of the rate that exceeds the threshold of the epidemiologic threshold during a single month (July 1997 and January 2002) were not considered epidemic outbreaks, following the Serfling’s criteria [24].
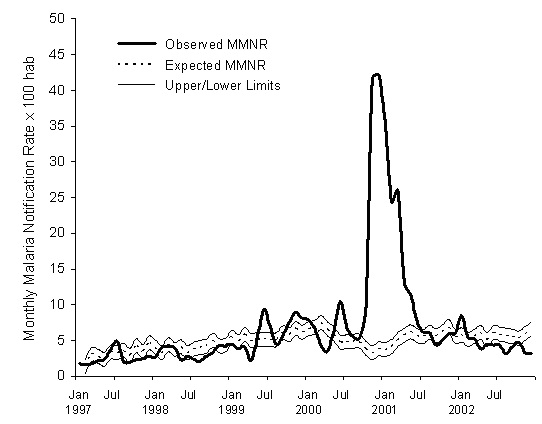 Figure 3: Expected and observed values for the Monthly Malaria Notification Rate (MMNR) per 100 inhabitants in Karuzi, Burundi, from January 1997 to December 2002. The upper and lower limits of the expected values are estimated for a 95% confidence endemic threshold.
| Month | Expected | Max | Observed | Month | Expected | Max | Observed |
| Jan 1997 | --- | --- | 1.7 | Jan 2000 | 6.6 | 7.5 | 7.9 |
| Feb | 1.3 | 2.3 | 1.6 | Feb | 6.8 | 7.8 | 6.5 |
| Mar | 3 | 4 | 1.7 | Mar | 7.4 | 8.4 | 4.2 |
| Apr | 2.7 | 3.7 | 2.2 | Apr | 6.5 | 7.5 | 3.5 |
| May | 2.3 | 3.3 | 2.3 | May | 5.8 | 6.8 | 6.5 |
| Jun | 3.3 | 4.3 | 3.8 | Jun | 4.7 | 5.7 | 10.4 |
| Jul | 3.2 | 4.2 | 4.9 | Jul | 4.8 | 5.8 | 6.8 |
| Aug | 3.6 | 4.6 | 2.1 | Aug | 4.8 | 5.8 | 5.6 |
| Sep | 2.9 | 3.9 | 1.9 | Sep | 4.8 | 5.8 | 5.4 |
| Oct | 4.2 | 5.2 | 2.3 | Oct | 3.9 | 4.8 | 9.5 |
| Nov | 3.4 | 4.4 | 2.4 | Nov | 3.2 | 4.2 | 41.6 |
| Dec | 4.6 | 5.6 | 2.8 | Dec | 3.8 | 4.7 | 42.2 |
| Jan 1998 | 4 | 5 | 2.7 | Jan 2001 | 3.6 | 4.6 | 35.3 |
| Feb | 3.2 | 4.2 | 4.1 | Feb | 4 | 5 | 24.4 |
| Mar | 4.3 | 5.3 | 4.1 | Mar | 5.1 | 6 | 25.9 |
| Apr | 3.7 | 4.7 | 4 | Apr | 5.7 | 6.6 | 13.2 |
| May | 4 | 5 | 2.3 | May | 6.1 | 7.1 | 11.4 |
| Jun | 3.2 | 4.2 | 2.7 | Jun | 5.6 | 6.6 | 7.7 |
| Jul | 3.7 | 4.7 | 2.4 | Jul | 5.5 | 6.5 | 6.2 |
| Aug | 4 | 5 | 2.1 | Aug | 6.1 | 7.1 | 6 |
| Sep | 4.2 | 5.1 | 2.8 | Sep | 5.6 | 6.6 | 4.3 |
| Oct | 5 | 5.9 | 3.4 | Oct | 6.2 | 7.1 | 5 |
| Nov | 4.2 | 5.2 | 4.3 | Nov | 6.8 | 7.8 | 5.9 |
| Dec | 4.3 | 5.3 | 4.2 | Dec | 5.5 | 6.5 | 6 |
| Jan 1999 | 5.4 | 6.4 | 4.5 | Jan 2002 | 5.7 | 6.7 | 8.4 |
| Feb | 4.8 | 5.8 | 3.8 | Feb | 5.1 | 6.1 | 6.1 |
| Mar | 5.8 | 6.7 | 4.1 | Mar | 5.5 | 6.5 | 5.2 |
| Apr | 4.9 | 5.9 | 2.2 | Apr | 6.1 | 7 | 3.8 |
| May | 5.1 | 6.1 | 5.6 | May | 5.1 | 6 | 4.4 |
| Jun | 5.1 | 6.1 | 9.4 | Jun | 6 | 7 | 4.3 |
| Jul | 5.1 | 6.1 | 6.9 | Jul | 5.8 | 6.8 | 4.3 |
| Aug | 5.1 | 6 | 4.4 | Aug | 5.6 | 6.6 | 3.1 |
| Sep | 6 | 7 | 5.7 | Sep | 5.5 | 6.5 | 4.1 |
| Oct | 5.8 | 6.8 | 7.6 | Oct | 5.3 | 6.3 | 4.7 |
| Nov | 6.6 | 7.6 | 8.9 | Nov | 5.9 | 6.9 | 3.2 |
| Dec | 6.1 | 7.1 | 8.1 | Dec | 6.6 | 7.6 | 3.2 |
Table 1: Values predicted for the expected endemic cumulative monthly rate of malaria case reports per 100 inhabitants in Karuzi with the Upper Limit at 95% confidence for the epidemic threshold (Max) obtained by the forecasting model and the corresponding rates of monthly malaria cases reported during 1997-2002.
The epidemiologic threshold predicted for the cumulative rate of malaria monthly reports for 2003, with its 95% threshold, is shown in Figure 4 and in Table 2. A change in the trend in the observed rate can be seen beginning in November 2003, with a more than 60% reduction with respect to the preceding month, which can be attributed to the health intervention that began in October of that year [22]. This unusual decline in the months of November and December 2003 is captured by the lower threshold of the epidemiologic threshold obtained with the model, which reflects chance fluctuation in the rate.
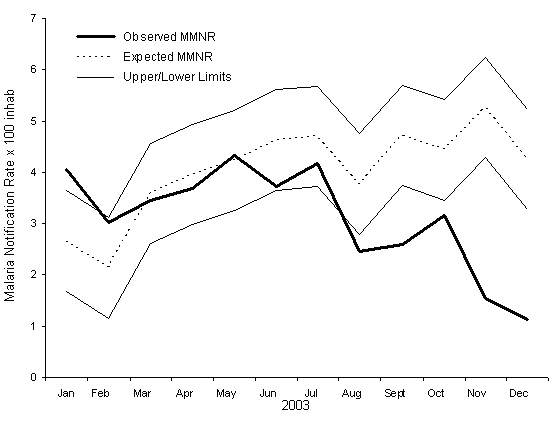 Figure 4: Expected and observed values for the Monthly Malaria Notification Rate per 100 inhabitants (MMNR) in Karuzi, Burundi in 2003. The Upper and Lower Limits of the expected values are estimated for a 95% confidence epidemiologic threshold.
| Month (2003) |
Threshold Lower Limit |
Expected |
Threshold Upper Limit |
Observed |
| January | 1.6 | 2.6 | 3.6 | 4 |
| February | 1.1 | 2.1 | 3.1 | 3 |
| March | 2.6 | 3.5 | 4.5 | 3.4 |
| April | 2.9 | 3.9 | 4.9 | 3.6 |
| May | 3.2 | 4.2 | 5.2 | 4.3 |
| June | 3.6 | 4.6 | 5.6 | 3.7 |
| July | 3.7 | 4.7 | 5.6 | 4.1 |
| August | 2.7 | 3.7 | 4.7 | 2.4 |
| September | 3.7 | 4.7 | 5.7 | 2.6 |
| October | 3.4 | 4.4 | 5.4 | 3.1 |
| November | 4.2 | 5.2 | 6.2 | 1.5 |
| December | 3.2 | 4.2 | 5.2 | 1.1 |
Table 2: Endemic values predicted for the expected cumulative monthly rate of malaria case reports per 100 population in Karuzi in 2003 according to the forecasting model, with the upper and lower 95% confidence limits of the epidemiologic threshold and the observed values for the period.
DISCUSSION
In this work we propose a tool for malaria surveillance that is simple in conception and easy to use in defining and detecting malaria epidemics, and to evaluate the impact of the measures for their control. Direct information about variables related to the intensity of malaria transmission, as anopheline density in relation to man, about the probability of mosquito survival or about the duration of the extrinsic cycle of the parasite in the mosquito is not available nor information regarding the state of the human population reservoir. This tool makes it possible to forecast an epidemiologic threshold for the cumulative monthly consultations rate of malaria for one year period based on the values preceding months and on the combination of temperature, rainfall and vegetation data observed in the preceding months. The estimation of the epidemiologic threshold with our model is based on the hypothesis that the malaria incidence rate is an estimator of the volume of the parasite reservoir in the human population, while rainfall, temperature and vegetation density are an estimator of vector transmission capacity.
Different methods for the definition and early detection of malaria epidemics, such as those proposed by Cullen [25], Najera [26] and CDC [27], use the monthly mean and median with their confidence intervals for preceding years, with a minimum of 5 years required, to identify an excess of reported cases. An evaluation of these methods in Kenya raises considerable doubts about their precision: their sensitivity and transparency are reduced when rates are transformed into logarithms; alert thresholds are established based on small samples (n = 5) for which standard deviations are calculated; and they arbitrarily exclude “epidemic years” in these samples (10-11). From our point of view, moreover, these techniques do not consider the influence of an environmental component reflecting parasite and vector conditions that may result in increased malaria transmission due to climatic variations.
Our model for estimating the endemic, non-epidemic, threshold offers an explanation for much of the variability observed in the malaria rate. Its reliability was shown by the ability to identify four empirically-defined epidemics in 1997-2002 and to detect the impact of a control program in 2003. It could generally be said that the expected incidence threshold through which the malaria consultations rate in Karuzi should pass between 1997 and 2003 is a theoretical representation of how this variable would behave, beginning with a particular initial number, given the influence of the environmental factors observed in that period. This implies that fluctuations in the incidence rate “outside” this threshold are not due to important variations in these climatic factors, but to factors related with other types of events that also determine the triggering and magnitude of malaria epidemics. Thus, for the same area and time period, Checchi have suggested as triggering factors for malaria epidemics: i) armed civil conflict with the consequent displacement of the non-immune population, and ii) the progressive expansion of rice cultivation in the valleys of central Burundi [28]. This would explain why the expected rate in our model for the months of the large epidemic between October 2000 and June 2001 is lower than the expected rate for preceding months, so that the model would be able to detect epidemics that are produced mainly by increased transmission related with human activity rather than climatic variability. The same thing occurs with the identification in the model of an important decrease in the observed rate in the months of November and December 2003, when the previously mentioned health intervention was carried out. Again, a reduction in the base rate of reproduction, or mean number of secondary infections produced from a single infected individual, would lead to an incidence rate much lower than expected by the model, by reducing the population reservoir of gametocytes as a result of treatment with artemisinin derivatives, and not because of the influence of climatic variables.
The proposed model for the detection of epidemic events in this area can be evaluated using the CDC criteria for evaluating surveillance systems [27]. That is, a) simplicity: health units routinely report malaria cases to the provincial office of the Ministry of Health; rigorous and ongoing collection of rainfall and temperature data which are relayed to the area epidemiologist; collection of vegetation data is not complex for a person with minimum training; channels for the flow of information are well established and have been improved; and the expected endemic threshold obtained for the province can easily be computed by putting all the components into the model; b) flexibility: Since the system is based on a computer program, it would be flexible enough to include changes in data collection that may occur among the different actors involved; c) acceptability: the malaria epidemic detection system would clearly be accepted since the persons involved in the process understand the repercussions of these events in their area; d) sensitivity: confirmation of cases by serological testing increases specificity, but not sensitivity; in contrast, using reports of suspected malaria cases would detect epidemics with higher sensitivity, albeit with a higher number of “false positives”; e) Positive Predictive Value (PVP): this system may detect epidemics that are not true epidemics, but if we use Serfling’s criteria [24], considering at least two consecutive months with an incidence above the established threshold, the PVP of the system increases considerably since this area is prone to malaria epidemics; f) representativeness: this may be limited when using reports of consultations for suspected malaria instead of microbiological confirmation; what is most important, however, is the historic stability of this form of reporting or notification that may be affected during period of conflicts or other issues outside the scope of the model; and g) timeliness: a limitation of the model is the minimum surveillance period it offers for the detection of epidemics but, as occurs in most epidemiological surveillance systems in rural areas of Africa, it is very difficult to obtain weekly reports of malaria cases that would permit earlier alerts. With appropriate changes in the forecasting model, the same methodology could be used with weekly cumulated reporting rates, and this approach would improve the timeliness of the epidemic early warning if this data would be obtained by the surveillance system of Burundi.
The combination of two modeling tools to predict malaria endemic-epidemic incidence rates, the described in this work for endemic, and another previously published for epidemic forecasting [29] offers a complete surveillance system for detection and development prediction of malaria epidemics and the evaluation of control measures. Thus, the model establishing endemic thresholds makes it possible to know when an epidemic took place, at which time the epidemic forecasting model can be applied to estimate its magnitude and plan the type and intensity of control measures. Finally, the results of these measures can be evaluated using the expected endemic thresholds.
The design and development of these types of models constitute one more tool-and not the only one - in what should be an appropriate and balanced policy for preventive action in areas prone to malaria epidemics. Because the multifactorial nature of these epidemics makes them difficult to detect, Malaria Early Warning Systems are needed that take into account variables related with climate, environment and population susceptibility [14]. With regard to the latter point, these Malaria Early Warning Systems should include components that go from rigorous and timely epidemiological surveillance and improved access to health services with adequate diagnostic and therapeutic measures, to monitoring the factors that may affect waning individual immunity, i.e., movements of the non-immune population or malnutrition.
Our model would need to be tested and evaluated before being proposed as an operational tool for malaria surveillance. Meanwhile, our research continues to focus on these techniques and their refinement in order to be able to define precisely when an excess of reported cases is a true malaria epidemic. Early warning of such epidemics would make allow time on time implementation of activities to reduce the suffering caused by these events. We can conclude that the application of this methodological tool permits the timely detection of malaria epidemics and the evaluation of the impact of measures for its prevention and control.
REFERENCES
- Brown V, Abdir Issak M, Rossi M, Barboza P, Paugam A (1998) Epidemic of malaria in north-eastern Kenya. Lancet 352: 1356-1357.
- Lindblade KA, Walker ED, Onapa AW, Katungu J, Wilson ML (1999) Highland malaria in Uganda: prospective analysis of an epidemic associated with El Niño. Trans R Soc Trop Med Hyg 93: 480-487.
- Kilian AH, Langi P, Talisuna A, Kabagambe G (1999) Rainfall pattern, El Niño and malaria in Uganda. Trans R Soc Trop Med Hyg 93: 22-23.
- Protopopoff N, Van Bortel W, Speybroeck N, Van Geertruyden JP, Baza D, et al. (2009) Ranking malaria risk factors to guide malaria control efforts in African highlands. PLoS One 4: 8022.
- Nkurunziza H, Gebhardt A, Pilz J (2010) Bayesian modelling of the effect of climate on malaria in Burundi. Malar 9: 114.
- Hay SI, Snow RW, Rogers DJ (1998) From predicting mosquito habitat to malaria seasons using remotely sensed data: practice, problems and perspectives. Parasitol Today 14: 306-313.
- Connor SJ, Thomson MC, Molyneux DH (1999) Forecasting and prevention of epidemic malaria: new perspectives on an old problem. Parassitologia 41: 439-448.
- Abeku TA, van Oortmarssen GJ, Borsboom G, de Vlas SJ, Habbema JD (2003) Spatial and temporal variations of malaria epidemic risk in Ethiopia: factors involved and implications. Acta Trop 87: 331-340.
- Zhoua G, Minakawab N, Andrew K, Githekoc, Yan G (2005) Climate variability and malaria epidemics in the highlands of East Africa. Trends Parasitol 21: 54-56.
- Hay SI, Simba M, Busolo M, Noor AM, Guyatt HL, et al. (2002) Defining and detecting malaria epidemics in the highlands of western Kenya. Emerg Infect Dis 8: 555-562.
- Hay SI, Were EC, Renshaw M, Noor AM, Ochola SA, et al. (2003) Forecasting, warning, and detection of malaria epidemics: a case study. Lancet 361:1705-1706.
- Thomson MC, Connor SJ, Milligan P, Flasse SP (1997) Mapping malaria risk in Africa: What can satellite data contribute? Parasitol Today 13: 313-318.
- World Health Organization (2000) Twentieth Report, WHO Expert Committee on Malaria. WHO Technical Report Series, No 892. World Health Organization, Geneva, Switzerland.
- World Health Organization (2001) A framework for field research in Africa: Malaria Early Warning Systems: Concepts, indicators and partners. World Health Organization, Geneva, Switzerland.
- World Health Organization (2004) Field guide for malaria epidemic assessment and reporting. World Health Organization, Geneva, Switzerland.
- World Health Organization (2004) Malaria Epidemics: Forecasting, Prevention, Early Detection and Control. From policy to practice. Report of an Informal consultation, Leysin, Switzerland 8-10 December 2003. World Health Organization, Geneva, Switzerland.
- Dantoine F (2000) Epidémie de paludisme, Evaluation des systèmes de surveillance épidémiologiques. Secteur de santé de Buhiga, province de Karuzi, Burundi, décembre 2000. Rapport Epicentre 378.
- MacDonald G (1957) The epidemiology and control of malaria. Oxford University Press, London, UK.
- United Nations (2000) World Population Prospects: The 2002 Revision. Volume III: Analytical Report, Department of Economic and Social Affairs, Population Division, World Health Organization, Geneva, Switzerland.
- Africa Data Dissemination Service. Dekadal Normalised Difference Vegetation Index, Africa.
- Legros D, Dantoine F (2001) Epidémie de paludisme du Burundi. Septembre 2000-Mai 2001. Rapport Epicentre 395, París, Europe.
- Ndayiragije A, Niyungeko D, Karenzo J, Niyungeko E, Barutwanayo M, et al. (2004) [Efficacy of therapeutic combinations with artemisinin derivatives in the treatment of non complicated malaria in Burundi]. Trop Med Int Health 9: 673-679.
- Protopopoff N, Van Herp M, Maes P, Reid T, Baza D, et al. (2007) Vector control in a malaria epidemic occurring within a complex emergency situation in Burundi: a case study. Malar J 6: 93.
- Serfling RE (1963) Methods for current statistical analysis of excess pneumonia-influenza deaths. Public Health Rep 78: 494-506.
- Cullen JR, Chitprarop U, Doberstyn EB, Sombatwattanangkul K (1984) An epidemiological early warning system for malaria control in northern Thailand. Bull World Health Organ 62: 107-114.
- Najera JA, Kouznetzsov RL, Delacollette C (1998) Malaria epidemics. Detection and control, forecasting and prevention. World Health Organization, Geneva, Switzerland.
- German RR, Lee LM, Horan JM, Milstein RL, Pertowski CA, et al. (2001) Updated guidelines for evaluating public health surveillance systems: recommendations from the Guidelines Working Group. MMWR Recomm Rep 50: 1-35.
- Checchi F, Cox J, Balkan S, Tamrat A, Priotto G, et al. (2006) Malaria epidemics and interventions, Kenya, Burundi, southern Sudan, and Ethiopia, 1999-2004. Emerg Infect Dis 12: 1477-1485.
- Gomez-Elipe A, Otero A, van Herp M, Aguirre-Jaime A (2007) Forecasting malaria incidence based on monthly case reports and environmental factors in Karuzi, Burundi, 1997-2003. Malar J 6: 129.
Citation: Aguirre-Jaime A (2016) Another Approach to Detect Malaria Epidemics and to Evaluate the Impact of Their Control Measures in Situation of Lack of Information. J Community Med Public Health Care 3: 018.
Copyright: © 2016 Gómez- Elipe A, et al. This is an open-access article distributed under the terms of the Creative Commons Attribution License, which permits unrestricted use, distribution, and reproduction in any medium, provided the original author and source are credited.