Application of Principal Components Analysis for Selection of Parental Materials in Rice Breeding
*Corresponding Author(s):
Simon Martin MvuyekureRwanda Agriculture Board, African Centre For Crop Improvement, School Of Agricultural, University Of KwaZulu-Natal, Kigali, Rwanda
Tel:+25 0785140678,
Email:msmartin202@gmail.com
Abstract
An investigation was carried out to determine agro-morphological variability among 64 accessions and relationships between parental materials suitable for various rice breeding programs in Rwanda. Trials were laid inan 8 x 8 lattice square designs, replicated twice in each of three locations.The analysis of variance revealed significant differences between genotypes for 18 studied agro-morphological traits, with environmental effects being of relatively minor importance. Principal component analysis extracted seven components contributing to around 72% of total variatiability. Three components which were most reliable to variability were highly correlated with a number of traits such as plant height, number of branches per panicle, number of grains per panicle, single panicle weight, grain yield and number of tillers.Principal component based biplots revealed groups of genotypes suitable for specific breeding programs. These include clusters of genotypes combining grain yielding potential with plant stature, tillering ability as well as grain length. This study has provided useful information, on evaluation of genetic diversity of rice germplasm and its possible application to rice improvement programs in Rwanda.
Keywords
INTRODUCTION
Rice, as one of the major food crops, ranks only second to wheat among the most cultivated cereals in the world. Its production is becoming an important component of the agricultural sector in Rwanda. The area under rice cultivation in Rwanda has tripled in the last 10 years resulting in a substantial production increase, from less than 20,000 tons to around 70,000 tones, involving about 62,000 small scale farmers [1]. Despite this steep production increase, the country still imports about 40% of the rice it consumes [2].
With evolving rice farming systems and changing farmers and consumer preferences, rice breeding programs in Rwanda have received significant attention with respect to improvement of yield with best grain quality. In spite of thousands of rice accessions available in Rwanda rice germplasm collections, little is known about the genetic variability, and consequently few of elite rice varieties have been released for suitability to different agro-climatic conditions [3].
Agro-morphological variability characterization of local germplasm is very important to better understand existing diversity, attain targeted genetic broadening of breeding populations, and potentially link this knowledge to genotypic information [4]. It also exposes the genetic variability in diverse populations and provides justification for introgressions of desired genes to enhance performance.
One of methods to analysis genetic variability in a given population is the Principal Component Analysis (PCA). According to Sanni et al., the PCA is a measure of how important impact a certain trait has in explaining a total variability and each coefficient of proper vectors indicates the degree of contribution of every original variable with which each principal component is associated [5]. PCA based biplots contain a lot of information and can be helpful in interpreting relationships between experimental groups and features [6]. It is therefore a reliable guiding tool in the process of parental selection in various breeding programs.
In this study, 64 rice accessions were evaluated in 3 different locations with the aim to (i) assess genetic variability of these accession across different agro-ecological conditions; (ii) evaluate the possibility to assign different accessions into relationship groups and (iii) derive conclusions regarding the potential use of this rice germplasm in different breeding programs in Rwanda.
MATERIALS AND METHODS
Experimental location and design
|
Code |
Name |
Type |
Origin |
Code |
Name |
Type |
Origin |
Code |
Name |
Type |
Origin |
Code |
Name |
Type |
Origin |
|
G1 |
Yunyine |
Japonica |
RAB |
G17 |
Mpembuke |
Indica |
RAB |
G33 |
Cyicaro |
Indica |
RAB |
G49 |
AER 16 |
Indica |
IRRI |
|
G2 |
Nyiragikara |
Japonica |
RAB |
G18 |
IRN 1-10 |
Indica |
IRRI |
G34 |
IUR 33 |
Indica |
IRRI |
G50 |
NERICA 10 |
** |
ARC |
|
G3 |
Buryohe |
Indica |
RAB |
G19 |
IRN 5 |
Indica |
IRRI |
G35 |
IRC 9 |
Indica |
IRRI |
G51 |
NERICA 4 |
** |
ARC |
|
G4 |
Ndamirabana |
Indica |
RAB |
G20 |
IUR 54 |
Indica |
IRRI |
G36 |
FAC 56 |
Indica |
IRRI |
G52 |
IR 56 |
Indica |
IRRI |
|
G5 |
IRN 41 |
Indica |
IRRI |
G21 |
Fashingabo |
Japonica |
RAB |
G37 |
IRC 1-4 |
Indica |
IRRI |
G53 |
IRN 60 |
Indica |
IRRI |
|
G6 |
IUR 94 |
Indica |
IRRI |
G22 |
LL 29 |
Indica |
IRRI |
G38 |
Zongeng |
Indica |
RAB |
G54 |
IIR 1-43 |
Indica |
IRRI |
|
G7 |
Ndamirabhinzi |
indica |
RAB |
G23 |
IUR 69 |
Indica |
IRRI |
G39 |
IRF 13 |
Indica |
IRRI |
G55 |
IIR 1-18 |
Indica |
IRRI |
|
G8 |
IRC 22 |
Indica |
IRRI |
G24 |
IUR 98 |
Indica |
IRRI |
G40 |
IIR 47 |
Indica |
IRRI |
G56 |
IUR 60 |
Indica |
IRRI |
|
G9 |
Rumbuka |
Indica |
RAB |
G25 |
IRF 18 |
Indica |
IRRI |
G41 |
IUR 53 |
Indica |
IRRI |
G57 |
IRN 44 |
Indica |
IRRI |
|
G10 |
Nerica 1 |
** |
RAB |
G26 |
IRN 63 |
Indica |
IRRI |
G42 |
LL 72 |
Indica |
IRRI |
G58 |
IRN 15 |
Indica |
IRRI |
|
G11 |
Moroberekan |
** |
ARC |
G27 |
Imbaturabukungu |
Indica |
RAB |
G43 |
IUR 48 |
Indica |
IRRI |
G59 |
AER 6 |
Indica |
IRRI |
|
G12 |
Intsindagira |
Indica |
RAB |
G28 |
IRN 41 |
Indica |
IRRI |
G44 |
Gakire |
Indica |
RAB |
G60 |
Yunertian |
Japonica |
RAB |
|
G13 |
AER 17 |
Indica |
IRRI |
G29 |
IIR 1-27 |
Indica |
IRRI |
G45 |
IUR 30 |
Indica |
IRRI |
G61 |
IRF 10 |
Indica |
IRRI |
|
G14 |
IRN 40 |
Indica |
IRRI |
G30 |
Ndengera |
Indica |
RAB |
G46 |
IRN 80 |
Indica |
IRRI |
G62 |
Jyambere |
Indica |
RAB |
|
G15 |
IUR 31 |
Indica |
IRRI |
G31 |
IUR 56 |
Indica |
IRRI |
G47 |
Kigega |
Japonica |
RAB |
G63 |
Tetep |
japonica |
ARC |
|
G16 |
Intsinzi |
Indica |
RAB |
G32 |
IUR 84 |
Indica |
IRRI |
G48 |
Yunkeng |
Japonica |
RAB |
G64 |
Kimaranzara |
Indica |
RAB |
RAB: Asian cultivars already released by the Rwanda Agriculture Board, rice research program
IRRI: Rice varieties newly introduced from the International Rice Research Center
ARC: Varieties introduced from the Africa Rice Center
RESULTS
Determination of genetic variability parameters
|
Mean squares |
|||||||
|
|
CV |
||||||
|
Trait |
Mean |
s.e |
MS g |
MS s |
MS gxs |
MSe |
(%) |
|
DFF |
111.58 |
3.45 |
332.3** |
1825** |
9.03 |
11.91 |
3.09 |
|
PH50 |
79.82 |
7.16 |
1026.8** |
2531.65** |
70.19* |
51.31 |
8.97 |
|
NoT50 |
10.46 |
2.95 |
12.206* |
53.408* |
6.488 |
8.7 |
28.2 |
|
FLL50 |
23.8 |
6.5 |
58.47* |
6.02 |
45.12 |
42.2 |
27.29 |
|
DM |
146.14 |
6 |
470.18** |
10.34 |
48.45 |
35.94 |
4.1 |
|
PH |
87.37 |
5.96 |
1270** |
1185.24** |
49.95* |
35.51 |
6.82 |
|
NoT |
12.3 |
0.85 |
7.50** |
27.36** |
2.54** |
0.73 |
6.95 |
|
NoPT |
10.09 |
1.15 |
10.986** |
75.358** |
4.246** |
1.324 |
11.41 |
|
FLA |
21.42 |
4.06 |
297.88** |
161.17** |
17.63 |
16.51 |
18.97 |
|
ShL |
27.59 |
3.1 |
57.16** |
129.631** |
11.68 |
9.63 |
11.25 |
|
PL |
19.47 |
2.7 |
22.33** |
66.13** |
7.25 |
7.28 |
13.86 |
|
BrP |
10.3 |
0.82 |
3.233** |
136.64** |
2.23** |
0.67 |
7.95 |
|
GP |
136.24 |
15.36 |
875.6** |
2259.5** |
326.9* |
236.1 |
11.28 |
|
TPP |
262.22 |
26.11 |
7568.6** |
3126.3** |
1163.1** |
681.5 |
9.95 |
|
SPW |
2.37 |
0.21 |
0.35** |
0.27** |
0.071** |
0.04 |
8.75 |
|
W1000G |
23.49 |
2.41 |
13.41** |
33.98* |
4.65 |
5.81 |
10.26 |
|
GL |
8.72 |
1.04 |
6.613** |
0.38 |
0.56 |
1.08 |
11.94 |
|
GY |
313.77 |
73.61 |
15525** |
1013772** |
6887 |
5418 |
23.46 |
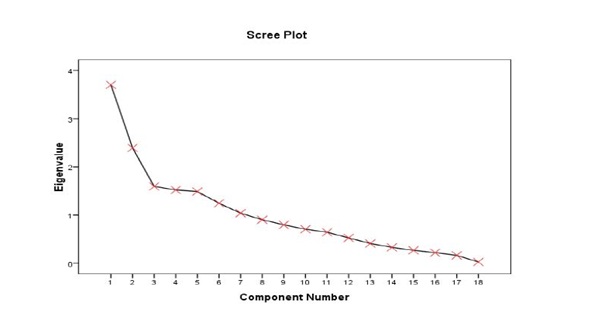
Figure 1: Scree plot illustrating eigenvalues corresponding to 18 extracted principal components.
|
|
PC 1 |
PC 2 |
PC 3 |
PC 4 |
PC 5 |
PC 6 |
PC 7 |
|
Contribution (%) |
20.568 |
13.302 |
8.864 |
8.454 |
8.272 |
6.922 |
5.783 |
|
Cumulative contribution (%) |
20.568 |
33.87 |
42.734 |
51.188 |
59.46 |
66.382 |
72.165 |
|
DFF |
0.019 |
-0.037 |
-0.007 |
-0.058 |
-0.071 |
-0.126 |
0.843 |
|
PH50 |
0.887 |
0.138 |
-0.194 |
0.129 |
0.053 |
0.041 |
-0.138 |
|
NoT50 |
-0.283 |
0.18 |
0.082 |
0.154 |
0.154 |
0.086 |
0.652 |
|
FLL50 |
0.102 |
-0.014 |
0.09 |
0.888 |
0.037 |
-0.141 |
0.087 |
|
DM |
-0.009 |
0.27 |
0.105 |
-0.174 |
0.755 |
-0.301 |
-0.072 |
|
PH |
0.902 |
0.064 |
-0.168 |
0.16 |
0.097 |
-0.029 |
-0.009 |
|
NoT |
-0.427 |
0.072 |
0.642 |
-0.053 |
0.25 |
-0.161 |
0.194 |
|
NoPT |
-0.347 |
0.036 |
0.823 |
0.088 |
0.162 |
-0.062 |
0.033 |
|
FLA |
0.338 |
0.105 |
-0.208 |
0.006 |
0.002 |
0.633 |
-0.262 |
|
ShL |
0.552 |
0.211 |
-0.012 |
-0.419 |
0.061 |
0.069 |
-0.091 |
|
PL |
0.088 |
0.374 |
0.01 |
0.735 |
-0.088 |
0.131 |
-0.076 |
|
BrP |
-0.188 |
0.714 |
-0.25 |
0.191 |
0.085 |
0.016 |
0.02 |
|
GP |
0.281 |
0.634 |
0.091 |
0.082 |
-0.176 |
0.074 |
0.159 |
|
TPP |
0.086 |
-0.091 |
0.832 |
0.059 |
-0.157 |
-0.008 |
-0.039 |
|
SPW |
0.417 |
0.452 |
0.221 |
0.068 |
-0.348 |
-0.064 |
-0.173 |
|
W1000G |
-0.237 |
0.288 |
-0.007 |
-0.142 |
-0.756 |
-0.297 |
-0.106 |
|
GL |
-0.126 |
-0.049 |
0.003 |
-0.064 |
-0.017 |
0.843 |
0.054 |
|
GY |
0.2 |
0.807 |
0.03 |
-0.039 |
0.104 |
-0.068 |
0.003 |
Table 3: Contribution of each extracted PC in total variability and their coefficients of correlation with evaluated traits.
Italic faced scripts show component score coefficient matrix: the high value indicates a high correction between the trait and the PC.
Classification of accessions into relationship groups
DISCUSSIONS
Significant differences observed among these genotypes indicate the existence of considerable genetic variability among the evaluated germplasm with regard to the 18 quantitative traits considered in this study. This was expected given that, evaluated accessions were developed from a diverse gene pool in different programs with different breeding objectives; a suggestion also shared with Oladosu et al., [9].
The results from the present study are in general agreement with a number of findings obtained elsewhere. For instance, Pandey et al., reported highly significant differences among 40 rice accessions involving 12 quantitative characters [10]. Similarly, Tuhina-Khatun et al., found a wide range and significant variation among 43 upland rice cultivars for the 22 quantitative agro-morphological characters [11]. These results provide useful information that can be applied by rice breeders in Rwanda. This is because, effective evaluation of varietal diversity provides, a considerable scope of choice of parents prior hybridization [10]. However, variability in terms of genetic divergence for agronomic traits is not sufficient as stand alone, but also requires reliable estimates of heritability to plan an efficient hybridization programme [12].
The principal component analysis method has been widely used on rice for various objectives. The cumulative variance of 72.165% by the first 7 axes (Table 3), indicates the identified traits within the axes exhibited great influence on the phenotype of the accessions, and could effectively be used for selection. According to various reports quoted by Sanni et al., and Sinha and PK Mishra the first 3 components (PC1, PCR2 and PC3) and associated traits are the most reliable to explain variation patterns among different genotypes [5,13]. Findings in table 3, suggest a common trend such that, in some circumstances, traits within a component contribute only one-sidedly, either reproductively (PC2) or vegetatively (PC1 and PC3), same remark has also been formulated by Chakravorty et al., [14]. Rabara et al., also observed 18 independent PC7 of which were responsible for 74.95%, of total variation among 307 rice landraces using 57 characters in Philippines [15]. Gana et al., observed 5 components strongly correlated with 12 traits among 39 genotypes and explaining 68.9% of total variation [16].
Remarkably, findings by these authors corroborate with results of the present study. In fact, a number of traits are commonly found positively correlated with the first three components. These include plant height, number of tillers, number of panicle per plot, panicle ramification, weight of 1000 grains, panicle length and grain yield.
Therefore, this may be taken into consideration during utilization of these traits in breeding programs.
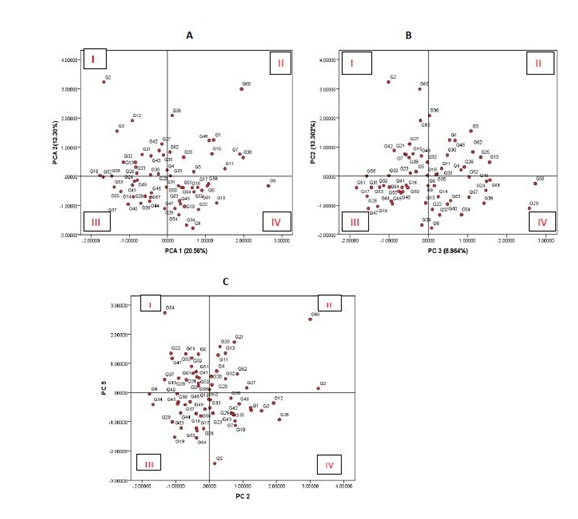
As rice farming systems in Rwanda aim mainly grain yield and quality, the biplot in figure 2A, exhibits only two clusters of accessions, of most interest. Quadrant I gather a group of accessions that are dwarf or semi-dwarf and high yielding potential, whereas quadrant II harbors a group of tall and high yielding varieties. This can be explained by the fact that grain yield has been found to be mostly directly determined by three yield components: number of panicles per unit land area, the average number of grain produced per panicle and the average weight of the individual grains [17]. Short and high yielding varieties have been reported elsewhere. Mishra et al., and Pandey described a list of high yielding and short statured Indian varieties [18,19]. In Rwanda, Ndikumana and ER Gasore characterized a number of short statured varieties that can potentially yield more than 6 tons per hectare, with very good quality characteristics [3].
As far as relationship between rice tillering ability and yield are concerned, interesting information is found in figure 2B. Observations are centered on 4 scenarios. Quadrant I groups high yielding and low tillering ability accessions while quadrant II groups accessions combining high yielding and high tillering ability. On the other hand, quadrant III assembles low yielding and low tillering ability accessions and finally quadrant IV clusters low yielding and high tillering ability accessions.
Normally, tillering ability should be in direct relationship with grain yield [20]. However, situations like the ones in quadrant I and II, is not a special case for this study but happens quite often. The reason is that number of tillers per hill for some varieties had negative impact on other traits by creating a sort of bushy stand. It is evident that there should be an optimum number of tillers per hill for a given crop spacing and for a specific variety. This should permit adequate resource use efficiency, at the most sensitive physiological and growth stages [21]. On this issue, Dingkuhn et al., explained that growth and limiting properties of the canopy at flowering indicated that tillers and leaf area production was excessive while foliar nitrogen concentration was suboptimal during reproductive and ripening phase [22]. According to De Datta in some areas of rice growing, especially in temperate climate, high tillering capacity of rice is not essential, but low tillering capacity is compensated by higher number of seedlings per plot [23].
Yield is the most noticeable characteristic to farmers but when the product of the crop reaches the market, quality becomes the key determinant of its marketability. If consumers do not accept the taste, texture, aroma, or appearance of a newly developed variety, its usefulness is greatly questionable. The length and width of a rice grain are important attributes that determine quality of rice. Once grain length is concerned, PC5 (positively and highly correlated with grain length) and PC2 (correlated with grain yield) explains more in figure 2C. This biplotresulted in quadrant I exhibiting long grain and low yielding genotypes whereas quadrant II contains high yielding and long grain genotypes. Quadrant IV is made of high yielding and short grain genotypes and finally quadrant III gathers short grain and low yielding genotypes.
Logically quadrant I and II are more interesting from the breeding point of view because of number of reasons. Grain yield and quality have largely been reported negatively correlated as far as grain quality parameters, except length and width, are concerned (http:/irri.org/about-us/our-organization/grain-quality-and-nutrition-center). This depends on the meaning attached to high yields for different rice producers. For instance, in Thailand like in the Rwandan rice market, good quality rice is defined as that with a long, slender, translucent grain with a length of more than 7 mm [23,24]. According to the same author, in developed countries and in other rice exporting countries, physical appearance of the grain is often more important than grain yield.
For rice breeding purpose involving traits considered in this study, accessions appearing in quadrant II of figure 2A are suitable for breeding objectives involving improved yield and tall or intermediate stature. These include the likes of G60, G36, G48, G1, G4 etc. Quality for this group is doubtful as generally tall varieties have short grain and subsequent quality characteristics.
Accessions appearing in quadrant I of figure 2A are potentially interesting for breeding programs aimed at grain yield and improved quality with short stature. Generally, dwarf genotypes are Asian imported for their quality characteristics and dwarf stature and long grain are widespread in these rice growing regions. Yield is associated with their greater resource use efficiency in terms of less foliar growth and enhanced assimilate export from leaves to stems along with sustained high nitrogen concentration [21]. Accessions in this group include the likes of G2, G12, G3, G32, G42 etc.
Breeding programmes involving tillering ability and improved yield are suggested to consider accessions in quadrant II and IV of figure 2B. These include high yielding and tillering ability accessions (G36, G3, G1, G62, G25 etc.,) on one hand, and high yielding and low tillering ability (G2, G60, G12, G27, G42, etc.,) on the other hand.
Breeding investigations aimed at physical quality of the grain (length for instance), accessions in quadrants I and II of figure 2C are more suitable for parental selection prior to hybridization. These include, respectively G55, G22, G14, G47, G55 and G60, G21, G28, G13, G11.
CONCLUSION
This study highlighted existence of high level of genetic variability among 64 rice accessions available in Rwanda’s rice germplasm collection. Much of the variability was found to be due to genetic component of variation with little influence from environmental factors within the sites.
Principal components analysis extracted 8 most polymorphic traits mostly responsible for genetic variability. These traits are plant height at both growth stages, number of branches per panicle, number of grains per panicle, single panicle weight, grain yield, number of tillers and total panicle per plot. These traits should therefore be given special emphasis during parental selection in hybridization process. Based on these traits, biplot analysis proposed clusters of accessions to be considered in varietal improvement strategies involving grain yield, on one hand, and vegetative characteristics (plant stature, tillering ability) and physical quality of grains (length) on the other hand. Hence these results are expected to be of significant importance in identifying potential parental materials for improving various morphological traits considered in this study.
ACKNOWLEDGEMENT
The Alliance for Green Revolution in Africa (AGRA), African Center for Crop Improvement (ACCI) and University of KwaZulu-Natal are gratefully acknowledged for funding and supervising this study. Special thanks go also Rwanda Agriculture Board (RAB) for facilitating this study in one way or another.
REFERENCES
- Kathiresan A (2010) Enabling Self Sufficiency and Competitiveness of Rwanda Rice. Ministry of Agriculture and Animal Resources, Kigali, Rwanda.
- Promar Consulting (2012) Agriculture, forestry and fisheries of Rwanda: Fact-finding survey for the support of aid to developing countries (fiscal year 2011 research project). Promar Consulting, Tokyo, Japan.
- Ndikumana I, Gasore ER, Nkima G, Twagirayezu A (2010) Description Of New Rice Varieties Introduced in Rwanda. Institut des Sciences Agronomiques du Rwanda, Kigali, Rwanda.
- Pucher A, Sy O, Angarawai II, Gondah J, Zangre R, et al. (2015) Agro-morphological characterization of west and central african pearl millet accessions. Crop Science 55: 737-748.
- Sanni KA, Fawole I, Ogunbayo A, Tia D, Somado EA, et al. (2012) Multivariate analysis of diversity of landrace rice germplasm. Crop Science 52: 494-504.
- Jolliffe IT (2002) Principal component analysis. Springer-Verlag, New York, USA.
- Payne R, Welham S, Harding S (2015) A Guide to REML in Genstat® (18th edn). VSN International, UK.
- Atlin G (2006) Multi-environment trials, design and analysis: planning rice breeding programs for impact. International Rice Research Institute, Los Baños, Philippines.
- Oladosu Y, Rafii MY, Norhani A, Mohammad AM, Rahim HA, et al. (2014) Genetic Variability and Selection Criteria in Rice Mutant Lines as Revealed by Quantitative Traits. The Scientific World Journal 2014: 190531.
- Pandey P, Anurag PJ, Tiwari DK, Yadav SK, Kumar B (2011) Genetic Variability, Diversity and Association of Quantitative Traits with Grain Yield in Rice (Oryza sativa L.). Journal of Bio-Science 17: 77-82.
- Tuhina-Khatun M, Hanafi MM, Yusop MR, Wong MY, Salleh FM, et al. (2015) Genetic Variation, Heritability, and Diversity Analysis of Upland Rice (Oryza sativa L.) Genotypes Based on Quantitative Traits. BioMed Research International 2015: 290861.
- Akinwale MG, Gregorio F, Nwilene BO, Akinyele SA, Ogunbayo, et al. (2011) Heritability and correlation coefficient analysis for yield and its components in rice (Oryza sativa L.). Afr J Plant Sci 5: 207-212.
- Sinha AK (2013) Agro-morphological characterization and morphology based genetic diversity analysis of landraces of rice variety (Oryza sativa L.) of Bankura district of West Bengal. International Journal of Current Research 5: 2764-2769.
- Chakravorty A, Ghosh PD, Sahu PK (2013) Multivariate Analysis of Phenotypic Diversity of Landraces of Rice of West Bengal. American Journal of Experimental Agriculture 3: 110-123.
- Rabara RC, Ferrer MC, Diaz CL, Newingham MCV, Romero GO (2014) Phenotypic diversity of farmers’ traditional rice varieties in the Philippines. Agronomy 4: 217-241.
- Gana AS, Shaba SZ, Tsado EK (2013) Principal component analysis of morphological traits in thirty-nine accessions of rice (Oryza sativa L.) grown in a rainfed lowland ecology of Nigeria. J Plant Breed Crop Sci 4: 120-126.
- Moldenhauer K, Wilson CE, Counce P, Hardke J (2013) Rice growth and development. In: T Hardke (ed.). Arkansas rice production handbook, University of Arkansas Division of Agriculture Cooperative Extension Service, Little Rock, Arkansas, USA.
- Mishra B, Singh RK, Senadhira D (2003) Advances in breeding salt-tolerant rice varieties. In: Khush GS, Brar DS, HardyB (eds.). Advances in rice genetics. International Rice Research Institute. Philippines.
- Pandey B (2006) A textbook of botany: angiosperms: anatomy, embryology and economic botany. S Chand Limited, Ram Nagar, New Delhi, India.
- Dixit S, Singh A, Kumar A (2014) Rice Breeding for High Grain Yield under Drought: A Strategic Solution to a Complex Problem. International Journal of Agronomy 2014: 863683.
- Kang KK, Kim YG (2012) Temperate rice in Korea. In: Jena KK, Hardy B (eds.). Advances in temperate rice research. Interantional Rice Research Institute, Los Baños, Philippines.
- Dingkuhn M, Penning De Vries FWT, Miezan KM (1993) Improvement of rice plant type concepts: Systems research enables interaction of physiology and breeding. In: Penning de Vries F, Teng P, Metselaar K (eds.). Systems approaches for agricultural developmentl, Spinger, The Netherlands.
- De Datta SK (1981) Principles and practices of rice production. John Wiley & Sons, Singapore.
- Kathiresan A (2013) Rwanda’s rice commodity chain - Facing Globalization. Ministry of Agriculture and Animal Resources, Kigali, Rwanda.
Citation: Mvuyekure SM, Sibiya J, Derera J, Nzungize J, Nkima G (2018) Application of Principal Components Analysis for Selection of Parental Materials in Rice Breeding. J Genet Genomic Sci 3: 010.
Copyright: © 2018 Simon Martin Mvuyekure, et al. This is an open-access article distributed under the terms of the Creative Commons Attribution License, which permits unrestricted use, distribution, and reproduction in any medium, provided the original author and source are credited.