Body Mass Index and Overall Graft Survival: An Analysis of ANZDATA
*Corresponding Author(s):
Sze Kit YuenDepartment Of Medicine & Geriatrics, Caritas Medical Centre, Hong Kong
Tel:+852 34087111,
Email:yuenskit@yahoo.com.hk
Abstract
Obesity is an increasing medical problem across the world and may be associated with adverse renal transplantation outcomes despite contradicting evidences. This retrospective study from 1991 to 2021 using ANZDATA data found that after the initial first 3 years, allografts transplanted to either underweight or obese patients have inferior long-term survival. While weight gain is commonly observed, allografts transplanted to patients who did not gain weight at 3 or 6 months post-transplant fared worse in terms of renal survival. Centers should include baseline body mass index in considering eligibility for renal transplantation.
Keywords
ANZDATA; Graft survival; Obesity; Renal transplantation
BACKGROUND/INTRODUCTION
The epidemic of obesity had spread to the Asian-Pacific world. Sixty-four percent of Australians and New Zealanders were considered as obese (body mass index or BMI≥25kg/m2) [1]. On the other hand, nearly half of new patients on renal replacement therapy suffered from diabetes [2], that often coexisted with unhealthy lifestyle, lack of exercise and obesity. In fact, the proportion of overweight or obese renal transplant recipients had been increasing [3]. Despite contradicting evidence [4], obese patients suffered more post-surgical complications such as wound infection, lymphocele, perinephric hematoma and incisional hernia after renal transplantation and required longer hospital stay [5,6]. The biggest study to date involved 51927 adult primary renal transplants performed between 1988 and 1997 using USRDS data. Extremes of BMI were associated with inferior graft and patient survival, death-censored graft survival and chronic allograft failure. For BMI above 26kg/m2, there appeared to be a gradual increase in risk of graft loss as BMI increases [7]. A study based at Australia & New Zealand Dialysis & Transplant Registry (ANZDATA) found obesity to be associated with a higher risk for graft loss and patient death in univariate but not multivariate analysis. Yet, underweight patients had a higher risk for graft loss (especially beyond 5 years) in multivariate analysis despite lower 6-month rejection rates [8]. It is prudent to re-visit the impact of BMI on short and long-term overall graft outcome since variability in the literature was partially accounted by the difference in pre-transplant screening, evaluation and list maintenance [9].
METHODS
This was a retrospective cohort study on ANZDATA and included all adult (≥18 years’ old) renal transplants performed between 1 January 1991 and 31 December 2012 in Australia and New Zealand. Exclusion criteria included missing data on donor or recipient blood groups and BMI at transplant ≤15kg/m2 or ≥45kg/m2. This cohort was categorized into BMI quartiles and followed up for overall graft survival till the end of 2012 or death, whichever was earlier. Continuous data was presented as mean ± standard deviation or median with Interquartile Range (IQR). Group comparisons were calculated by Fisher’s exact, Pearson’s Chi-square, one-way ANOVA, Student’s t or Mann-Whitney U tests whenever appropriate. Kaplan-Meier survival curves were created and groups compared by log-rank test. Multivariate analysis for predictors of overall graft survival was performed by stepwise backward Cox proportional hazards model. Exploratory analyses were performed to see if weight change post-transplant impacted overall graft survivals differently in different baseline BMI quartiles. All p values were two-sided with <0.05 indicating statistically significance. SPSS 20.0 (SPSS Inc., Chicago, IL) was used for all statistical calculations.
RESULTS
A total of 13135 kidney transplants on 12281 patients (7578 male and 4703 female) were enrolled after excluding 1415 allografts according to pre-specified criteria. Patient characteristics were shown in table 1. Over a median follow-up of 6.83 years, female had a lower all-cause mortality (Figure 1) but overall graft survival transplanted to female was not superior (5 years’ survival, female: male=81.1% vs. 81.6%; p=0.089).
|
|
Female (n=4703) |
Male (n=7578) |
All (n=12281) |
p |
|
Race |
|
|
|
0.000 |
|
Caucasoid |
3782 (80.4%) |
6372 (84.1%) |
10154 (82.7%) |
|
|
Aboriginal |
158 (3.4%) |
194 (2.6%) |
352 (2.9%) |
|
|
Maori |
116 (2.5%) |
183 (2.4%) |
299 (2.4%) |
|
|
Indian |
93 (2.0%) |
196 (2.6%) |
289 (2.4%) |
|
|
Chinese |
92 (2.0%) |
125 (1.6%) |
217 (1.8%) |
|
|
Filipino |
115 (2.4%) |
65 (0.9%) |
180 (1.5%) |
|
|
Vietnamese |
82 (1.7%) |
92 (1.2%) |
174 (1.4%) |
|
|
Others |
265 (5.6%) |
351 (4.6%) |
616 (5.0%) |
|
|
Age (years) |
45.99±13.25 |
46.78±13.03 |
46.48±13.12 |
0.001 |
|
Weight (kg) |
65.70±14.02 |
79.41±14.89 |
74.16±16.01 |
0.000 |
|
Height (m) |
161.26±8.06 |
174.40±8.63 |
169.37±10.57 |
0.000 |
|
BMI (kg/m2) |
25.24±4/06 |
26.06±4.30 |
25.75±4.58 |
0.000 |
|
Primary renal disease |
|
|
|
0.000 |
|
Diabetes mellitus |
545 (11.6%) |
967 (12.8%) |
1512 (12.3%) |
|
|
Glomerulonephritis |
1899 (40.4%) |
3797 (50.1%) |
5696 (46.4%) |
|
|
Polycystic kidney |
713 (15.3%) |
907 (12.0%) |
1620 (13.2%) |
|
|
Uncertain |
180 (3.8%) |
324 (4.3%) |
504 (4.1%) |
|
|
Others |
1366 (28.9%) |
1583 (20.8%) |
2949 (24.0%) |
|
Table 1: Patient characteristics at the time of transplant.
Note: BMI=Body Mass Index in kg/m2.
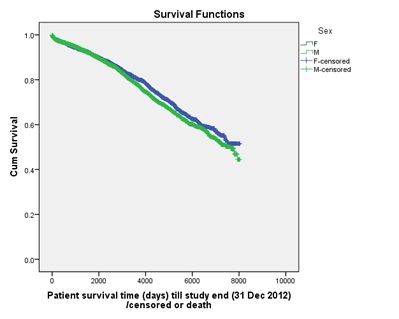
Figure 1: All-cause mortality was slightly lower in female (p=0.022).
Recipient and donor characteristics, categorized according to BMI quartiles and defined as underweight, normal, overweight and obesity (Table 2), were tabulated in table 3. In Kaplan-Meier analysis, overall graft survivals diverge significantly after 36 months with allografts transplanted to obese patients survived worst (Figure 2).
|
Quartile |
BMI at Transplant |
BW Change at 3 Months* |
BW Change at 1 Year* |
BW Change at 3 Years* |
|
1st(Q1) |
->2kg |
< 0 kg |
||
|
2nd (Q2) |
22.39-25.21 (Normal) |
-2kg to +1kg |
+0-4kg |
+0-4kg |
|
3rd(Q3) |
25.21-28.63 (overweight) |
+1kg to +4kg |
+4-8kg |
+4-10kg |
|
4th(Q4) |
>28.63 (obesity) |
+>4kg |
+>8kg |
+>10kg |
Table 2: Derived quartiles of BMI or change of BW at various time points.
Note: BMI=Body Mass Index in kg/m2; BW=Body Weight in kg.
* when compared with body weight at transplantation.
|
|
Q1 (n=3267) |
Q2 (n=3301) |
Q3 (n=3286) |
Q4 (n=3281) |
p |
|
Median (IQR) days of follow-up |
2341 (1028-4137) |
2284 (980-3869) |
2107 (889-3664) |
1694 (699-3133) |
|
|
Being male |
1596 (48.9%) |
2146 (65%) |
2250 (68.5%) |
2109 (64.3%) |
0.000 |
|
Age |
41.42±13.37 |
45.77±13.01 |
48.65±12.39 |
48.99±12.07 |
0.000 |
|
Body weight (kg) |
57.58±8.56 |
69.12±8.76 |
78.07±9.53 |
91.11±13.51 |
0.000 |
|
Body height (cm) |
167.87±10.36 |
170.05±10.50 |
170.43±10.18 |
168.66±11.75 |
0.000 |
|
BMI (kg/m2) |
20.34±1.51 |
23.81±0.81 |
26.79±0.97 |
31.96±2.92 |
0.000 |
|
CMV seropositive |
2126 (65.5%) |
2138 (65.1%) |
2203 (67.4%) |
2279 (69.8%) |
0.000 |
|
EBV seropositive |
2307 (71%) |
2338 (71.3%) |
2445 (74.8%) |
2524 (77.3%) |
0.000 |
|
Peak panel-reactive antibody |
|
|
|
|
0.001 |
|
<25% |
2500 (76.5%) |
2614 (79.2%) |
2654 (80.8%) |
2630 (80.2%) |
|
|
25-50% |
296 (9.1%) |
269 (8.1%) |
262 (8.0%) |
281 (8.6%) |
|
|
>50% |
459 (14%) |
403 (12.2%) |
354 (10.8%) |
362 (11.0%) |
|
|
Repeat transplant |
424 (13%) |
355 (10.8%) |
317 (9.6%) |
271 (8.3%) |
0.000 |
|
ABO incompatible transplant |
36 (1.1%) |
53 (1.6%) |
61 (1.9%) |
58 (1.8%) |
0.067 |
|
Deceased-donor transplant |
2085 (63.8%) |
2158 (65.4%) |
2194 (66.8%) |
2221 (67.7%) |
0.006 |
|
Donor being male |
1743 (53.4%) |
1703 (51.6%) |
1709 (52%) |
1757 (53.6%) |
0.546 |
|
Donor age |
42.73±16.09 |
43.05±16.17 |
43.85±15.99 |
44.42±15.67 |
0.000 |
|
Number of HLA (A, B, DR) mismatches |
|
|
|
|
|
|
0 |
205 (6.3%) |
204 (6.2%) |
204 (6.2%) |
217 (6.6%) |
|
|
1 |
320 (9.8%) |
336 (10.2%) |
319 (9.7%) |
328 (10%) |
|
|
2 |
786 (24.1%) |
735 (22.3%) |
684 (20.8%) |
722 (22%) |
|
|
3 |
770 (23.6%) |
669 (20.3%) |
715 (21.8%) |
629 (19.2%) |
|
|
4 |
479 (14.7%) |
541 (16.4%) |
514 (15.6%) |
543 (16.5%) |
|
|
5 |
479 (14.7%) |
557 (16.9%) |
561 (17.1%) |
550 (16.8%) |
|
|
6 |
228 (7%) |
259 (7.8%) |
289 (8.8%) |
292 (8.9%) |
|
|
Ischemic time (hours) |
9.71±6.98 |
9.98±6.91 |
10.28±7.00 |
10.30±6.78 |
0.001 |
Table 3: Characteristics of renal allografts at transplantation according to BMI quartiles.
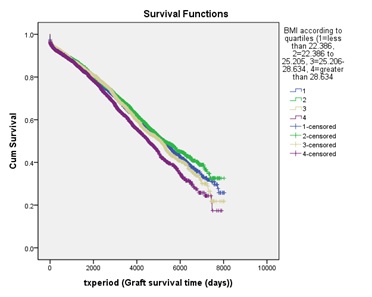
Figure 2: Long-term overall graft survivals according to BMI quartiles.
This was confirmed in univariate and multivariate analyses which showed BMI having no impact on graft survivals at 1-year, 2-years and 3-years (Table 4). A piecewise multivariate analysis enrolling those 9224 allografts that survived through the first 3 years found allografts transplanted to underweight or obese patients to be independently associated within ferior long-term graft survivals, with an adjusted hazards ratio of 1.160 and 1.223, respectively (Table 5).
|
|
Overall Graft Survival (Univariate Analysis) |
||||||||
|
|
At 1 Year |
At 2 Years |
At 3 Years |
||||||
|
BMI quartile* |
HR |
95% CI |
P |
HR |
95% CI |
P |
HR |
95% CI |
P |
|
1st(Q1) |
0.992 |
0.831-1.183 |
0.926 |
1.014 |
0.867-1.187 |
0.858 |
1.043 |
0.906-1.201 |
0.554 |
|
2nd(Q2) |
1 |
|
|
1 |
|
|
1 |
|
|
|
3rd (Q3) |
0.912 |
0.762-1.092 |
0.319 |
0.983 |
0.839-1.151 |
0.829 |
1.048 |
0.910-1.207 |
0.513 |
|
4th (Q4) |
1.058 |
0.889-1.259 |
0.525 |
1.084 |
0.929-1.266 |
0.307 |
1.090 |
0.947-1.255 |
0.230 |
Table 4: BMI at transplantation did not influence short-term graft survivals.
Note: CI=Confidence Intervals; HR=Unadjusted Hazards Ratio.
*As defined in table 2.
|
|
Allograft Failure at 3 Years |
Long-term Allograft Failure |
||||
|
Multivariate analysis |
HR |
95% CI |
P |
HR |
95% CI |
p |
|
BMI quartiles |
|
|
|
|
|
|
|
1.067 |
0.922-1.235 |
0.383 |
1.158 |
1.039-1.291 |
0.008 |
|
|
22.39-25.21 (normal) |
1 |
|
|
1 |
|
|
|
25.21-28.63 (overweight) |
1.024 |
0.886-1.184 |
0.744 |
1.018 |
0.911-1.138 |
0.751 |
|
>28.63 (obese) |
1.054 |
0.911-1.219 |
0.479 |
1.216 |
1.086-1.361 |
0.001 |
|
Recipient being male |
1.001 |
0.996-1.005 |
0.790 |
1.179 |
1.085-1.281 |
0.000 |
|
Recipient each year older |
|
|
NA |
1.013 |
1.010-1.017 |
0.000 |
|
DM as primary disease |
1.283 |
1.116-1.476 |
0.000 |
1.469 |
1.311-1.645 |
0.000 |
|
Recipient CMV seropositive |
1.156 |
1.029-1.299 |
0.015 |
1.036 |
0.950-1.129 |
0.422 |
|
Recipient EBV seropositive |
0.777 |
0.664-0.910 |
0.002 |
|
|
NA |
|
Maximal panel-reactive antibody |
|
|
|
|
|
|
|
25-50 (c/w <25) |
1.334 |
1.129-1.575 |
0.001 |
1.267 |
1.117-1.437 |
0.000 |
|
>50 (c/w <25) |
1.639 |
1.424-1.888 |
0.000 |
1.464 |
1.303-1.646 |
0.000 |
|
Being a repeat transplant |
1.392 |
1.190-1.628 |
0.000 |
1.379 |
1.209-1.574 |
0.000 |
|
Donor each year older |
1.017 |
1.014-1.020 |
0.000 |
1.012 |
1.009-1.014 |
0.000 |
|
Deceased donor |
1.233 |
1.021-1.488 |
0.029 |
1.001 |
0.861-1.166 |
0.985 |
|
Each HLA-A/B/DR MM |
1.096 |
1.062-1.131 |
0.000 |
1.053 |
1.028-1.079 |
0.000 |
|
Each hr more ischemic time |
1.040 |
1.028-1.051 |
0.000 |
1.015 |
1.009-1.021 |
0.000 |
|
Chronic lung disease |
1.270 |
1.019-1.583 |
0.034 |
1.283 |
1.065-1.545 |
0.009 |
|
Composite CV comorbidities |
1.454 |
1.269-1.667 |
0.000 |
1.385 |
1.235-1.553 |
0.000 |
Table 5: Multivariate analyses of the impact of BMI at transplantation on overall graft survival at 3 years and long-term.
Note: CI=Confidence Intervals; CV=Any of the following cardiovascular comorbidities: Cerebrovascular disease, coronary artery disease, peripheral vascular disease; HR=Adjusted hazards ratio in multivariate analysis; NA=Not applicable. The variable was not included in multivariate analysis since it was not statistically significant in univariate analysis.
An exploratory analysis on 13125 allografts was carried out after excluding allografts that was transplanted to patients with body weight at transplant of ≤35kg or ≥180kg. BMI quartiles (in kg/m2) were redefined as: <22.40, 22.40-25.21, 25.21-28.63, >28.63. The impact of BMI at transplant on 3-years and long-term graft survivals remained similar. Data on change of body weight post-transplant at 1, 2, 3, 6, 12, 24 and 36 months were available for 12181 allografts. Weight gain post-transplant was common and peaked at 3 months, with a median of +12kg/year (Table 2 and Figure 3).
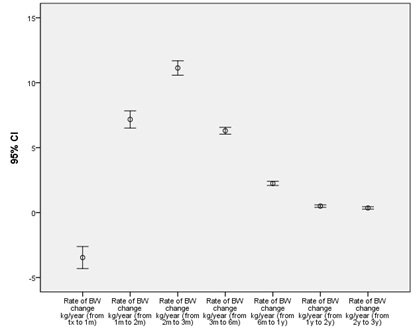
Figure 3: Median (95% confidence intervals) body weight change post-transplant.
Allografts transplanted to patients who did not gain weight or those who lost by more than 2kg at 3 months (or 6 months) post-transplant fared worse in 3 years’ (and long-term) survivals (Figure 4). This was observed across all BMI quartiles at transplant. After excluding allografts transplanted to patients with weight loss of more than 2kg at 3 months (i.e. lowest BW change quartile), survival curves similar to figure 2 was observed, with allografts of obese patients distinctly worse in long-term graft survivals (p by pair wise comparisons<0.014). For patients who were underweight at transplant, gaining more weight at 3 years was associated with improved long-term graft survival. On the other hand, for people with higher BMI, marked weight gain appeared to be increasingly associated with less favourable graft outcome (Figure 5).
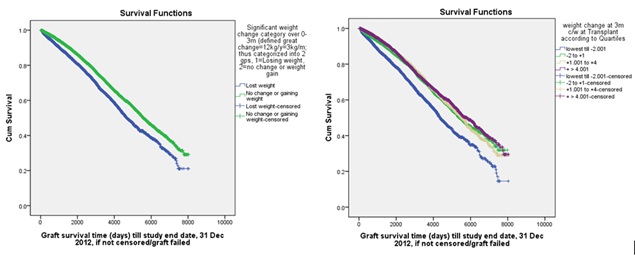
Figure 4: Weight loss at 3 months was associated with poor long-term outcome.
Note: Similar survival curves were obtained in separate analyses using weight change at 6 months as variable or 3-year graft survival as outcome.
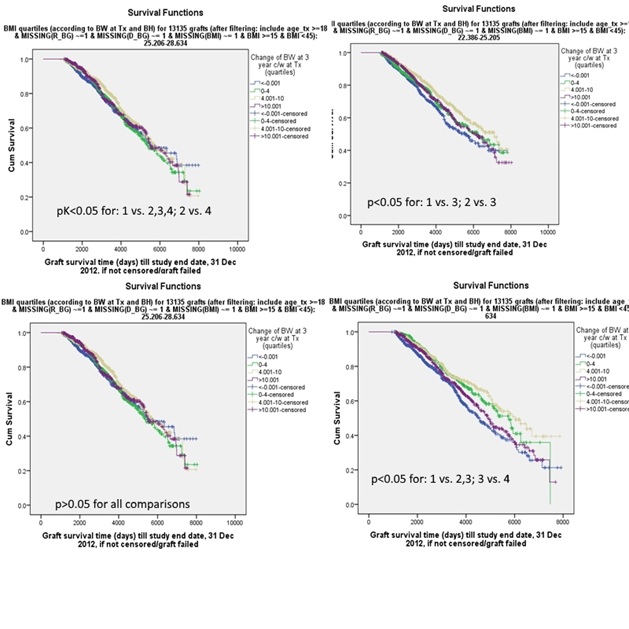
Figure 5: Impact of weight change at 3 years differed for patients with different BMI at transplantation.
DISCUSSION
Obesity was a known risk factor for coronary artery disease, post-transplant diabetes, hyperlipidaemia and pre-transplant or post-transplant hypertension [3,10,11]. Adverse impact of underweight probably partially cancelled out that of obesity, such that inconsistent conclusions been made on the relationship between BMI at transplant and long-term graft outcomes in single-centre studies [12]. Registry studies allowed classifying BMI into multiple categories with adequate number of cases such that a J or U-shaped relationship could be observed [12].
We studied overall graft survival instead of patient or death-censored graft survivals since this outcome provided the best insight to policy makers on whether a certain BMI should deter a patient from receiving a transplant. We found obesity to be associated with more than 20% increased risk of long-term but not short-term (1, 2 or 3 years’) overall graft survival. In addition, underweight at transplant increased the risk of long-term graft failure by nearly 16%. This was consistent with the finding of a J-shaped relationship between BMI and graft outcome if BMI at transplant was divided into 11 categories [7]. The findings were supported by one meta-analysis that showed risk of graft failure in underweight and obese classes to be 1.29 and 1.25, respectively [13]. Difference in enrolment period, primary outcome and definition of underweight or obesity contributed to the variable findings in the literature including a study based at ANZDATA [8].
Despite contradicting evidence [4,6], obese patients probably carried the same risk of acute rejection [7,9,11], but higher risk of delayed graft function and surgical wound complications [7,12]. It was intriguing to suggest explanations such as inadequate exposure to lipophilic maintenance immunosuppression [14] or inadequate ‘nephron dose’ in obese recipient [11]. Post-transplant Glomerular Filtration Rate (GFR) at 1 year, as determined by 125I-iothalamate, was higher in the highest BMI tertile [15]. The observation persisted after excluding all diabetic cases which might act as confounder. At 5 years post-transplant, the difference in GFR among BMI groups disappeared, mainly because GFR in the highest BMI tertile dropped when compared with the first year [15]. Nevertheless, given our findings that BMI at transplant never significantly impacted overall graft survival at 1, 2 or 3 years, it was likely that these early complications were mostly manageable or reversible. As such, despite increased surgical difficulties, obesity per se might be considered as one of the adverse risk factors that affect graft and patient outcomes [4]. With paucity supply of organ, setting a specific BMI limit that deter patients from getting a transplant is more than an academic question and complicated by suggestions that relationship between BMI and transplant risk might be continuous [3] and obese patients might be otherwise healthier with more aggressive screening for heart-related problems and closer medical scrutiny [3,16].
Poorer short-term (1 or 5 years’) graft survival for underweight patients had been reported [17] and might be explained by the ‘carry-over effect’ of underweight while on dialysis. Difference in criteria of exclusion of malnourished patients from getting a transplant might explain our finding of no relationship between underweight and short-term graft survival, as similarly reported previously [8]. However, our underweight patients were still at risk of inferior long-term graft survival, with an adjusted odds ratio of 1.158. Chronic calcineurin toxicity due to non weight-adjusted prescription was an intuitive explanation but altered pharmacokinetics, possible predisposition to infections [18] and release of interleukin 2 (IL2) from T cell in reduced energy supply were intriguing factors that promoted development of chronic allograft nephropathy [19]. Whether matching donor and recipient BMI could benefit the long-term graft outcome remained controversial [9] and we did not have enough data for meaningful analyses. Whatsoever, we might infer that inferior graft outcome in underweight or obese transplant recipients likely involved multiple mechanisms that took time to act.
Allografts transplanted to patients who lost weight by >2kg at 3 months functioned distinctly worse in the long-term. It was likely that these patients either had unmeasured increased risk of transplantation or suffered from post-transplant misfortune or complications including infective or cardiovascular events. In the majority, however, post-transplant weight gain peaked at 3 months and persisted for at least 3 years. In a study enrolling 1000 renal transplant performed on 909 recipients, weight gain at 1 year averaged 5kg or 8.7%. About 50% and 30% of recipients displayed weight gain of 5% and 10%, respectively [12]. Nevertheless, weight gain was not related to baseline BMI [20] and not shown to affect graft or patient outcome [12,15]. In our exploratory analyses, gaining weight (even by>10kg) did not led to poorer graft survival for patients who were underweight at transplant. Yet, despite far from conclusive, our data raised the possibility of adverse impact of persistent huge weight gain at 3 years for obese patients on long-term graft outcome. Obese patients were likely aggressively screened for risk factors before undergoing transplant and thus did well early post-transplant. Obesity and its incident comorbidities, physical inactivity and unhealthy lifestyle likely negatively impacted on graft survival slowly. Since most patients who were obese at transplant were most likely to be obese at 1 or 5 years [8], whether protective weight adjustment before renal transplant could improve graft outcome warrant further studies [7].
As in many retrospective studies, our registry analyses remained mostly descriptive and inspiring rather than allowing confirmation of causal association [21]. We used BMI as the sole definition of obesity or underweight and did not study acute rejection, donor and recipient size mismatch, immunosuppression regime and drug levels [22-30].
In conclusion, underweight (BMI <22.39kg/m2) and obesity (BMI >28.63) at renal transplant was associated with inferior long-term but not short-term graft survivals. Weight loss at 3 months post-transplant predicted inferior graft outcome while weight gain at 3 years might be problematic in patients who were obese at transplant. Further study of the interplay of weight change post-transplant and baseline BMI is warranted.
REFERENCES
- Global Health Observatory data repository. Overweight (body mass index >=25) (age-standardized estimate) data by country. WHO, Geneva, Switzerland.
- ANZDATA Registry. 38th Report, Chapter 1: Incidence of End Stage Kidney Disease. Australia and New Zealand, Dialysis and Transplant Registry, Adelaide, Australia.
- Zrim S, Furlong T, Grace BS, Meade A (2012) Body mass index and postoperative complications in kidney transplant recipients. Nephrology (Carlton) 17: 582-587.
- Howard RJ, Thai VB, Patton PR, Hemming AW, Reed AI, et al. (2002) Obesity does not portend a bad outcome for kidney transplant recipients. Transplantation 73: 53-55.
- Singh D, Lawen J, Alkhudair W (2005) Does pretransplant obesity affect the outcome in kidney transplant recipients? Transplant Proc 37: 717-720.
- Abou-Jaoude MM, Nawfal N, Najm R, Honeidi M, Shaheen J, et al. (2010) Effect of pretransplantation body mass index on allograft function and patient survival after renal transplantation. Transplant Proc 42: 785-788.
- Meier-Kriesche HU, Arndorfer JA, Kaplan B (2002) The impact of body mass index on renal transplant outcomes: A significant independent risk factor for graft failure and patient death. Transplantation 73: 70-74.
- Chang SH, Coates PT, McDonald SP (2007) Effects of body mass index at transplant on outcomes of kidney transplantation. Transplantation 84: 981-987.
- Massarweh NN, Clayton JL, Mangum CA, Florman SS, Slakey DP (2005) High body mass index and short- and long-term renal allograft survival in adults. Transplantation 80: 1430-1434.
- Cheung CY, Chan YH, Chan HW, Chau KF, Li CS (2010) Optimal body mass index that can predict long-term graft outcome in Asian renal transplant recipients. Nephrology (Carlton) 15: 259-265.
- Chow KM, Szeto CC, Leung CB, Lui SF, Tong YF, et al. (2006) Body mass index as a predictive factor for long-term renal transplant outcomes in Asians. Clin Transplant 20: 582-589.
- Marcén R, Fernández A, Pascual J, Teruel JL, Villafruela JJ, et al. (2007) High body mass index and posttransplant weight gain are not risk factors for kidney graft and patient outcome. Transplant Proc 39: 2205-2207.
- Ahmadi SF, Zahmatkesh G, Streja E, Molnar MZ, Rhee CM, et al. (2014) Body mass index and mortality in kidney transplant recipients: A systematic review and meta-analysis. Am J Nephrol 40: 315-324.
- Curran SP, Famure O, Li Y, Kim SJ (2014) Increased recipient body mass index is associated with acute rejection and other adverse outcomes after kidney transplantation. Transplantation 97: 64-70.
- Bosma RJ, Kwakernaak AJ, van der Heide JJ, de Jong PE, Navis GJ (2007) Body mass index and glomerular hyperfiltration in renal transplant recipients: Cross-sectional analysis and long-term impact. Am J Transplant 7: 645-652.
- Kuo JH, Wong MS, Perez RV, Li CS, Lin TC, et al. (2012) Renal transplant wound complications in the modern era of obesity. J Surg Res 173: 216-223.
- Chung H, Lam VW, Yuen LP, Ryan BJ, O'Connell PJ, et al. (2015) Renal transplantation: Better fat than thin. J Surg Res 194: 644-652.
- Sezer S, Ozdemir FN, Elsurer R, Uyar M, Arat Z, et al. (2005) Pretransplantation and posttransplantation body mass indices and prognosis in renal transplant recipients: Low versus normal. Transplant Proc 37: 2994-2997.
- Rettkowski O, Wienke A, Hamza A, Osten B, Fornara P (2007) Low body mass index in kidney transplant recipients: Risk or advantage for long-term graft function? Transplant Proc 39: 1416-1420.
- Raiss-Jalali GA, Mehdizadeh AR, Razmkon A, Rouzbeh J, Behzadi S, et al. (2005) Effect of body mass index at time of transplantation and weight gain after transplantation on allograft function in kidney transplant recipients in Shiraz. Transplant Proc 37: 2998-3000.
- Costa B, Moratelli L, Silva LB, Paiva AC, Silva AN, et al. (2014) Body mass index in the first year after kidney transplantation. Transplant Proc 46: 1750-1752.
- Hill CJ, Courtney AE, Cardwell CR, Maxwell AP, Lucarelli G, et al. (2015) Recipient obesity and outcomes after kidney transplantation: A systematic review and meta-analysis. Nephrol Dial Transplant 30: 1403-1411.
- Mohamed Ali AA, Abraham G, Mathew M, Fathima N, Sundararaj S, et al. (2009) Can serial eGFR, body mass index and smoking predict renal allograft survival in south Asian patients. Saudi J Kidney Dis Transpl 20: 984-990.
- Papalia T, Greco R, Lofaro D, Maestripieri S, Mancuso D, et al. (2010) Impact of body mass index on graft loss in normal and overweight patients: Retrospective analysis of 206 renal transplants. Clin Transplant 24: 241-246.
- Meier-Kriesche HU, Vaghela M, Thambuganipalle R, Friedman G, Jacobs M, et al. (1999) The effect of body mass index on long-term renal allograft survival. Transplantation 68: 1294-1297.
- Hatamizadeh P, Molnar MZ, Streja E, Lertdumrongluk P, Krishnan M, et al. (2013) Recipient-related predictors of kidney transplantation outcomes in the elderly. Clin Transplant 27: 436-443.
- Clinical Guidelines on the Identification, Evaluation, and Treatment of Overweight and Obesity in Adults--The Evidence Report. National Institutes of Health. Obes Res 1998 2: 51-209.
- Johnson DW, Isbel NM, Brown AM, Kay TD, Franzen K, et al. (2002) The effect of obesity on renal transplant outcomes. Transplantation 74: 675-681.
- Gore JL, Pham PT, Danovitch GM, Wilkinson AH, Rosenthal JT, et al. (2006) Obesity and outcome following renal transplantation. Am J Transplant 6: 357-363.
- Aalten J, Christiaans MH, de Fijter H, Hené R, van der Heijde JH, et al. (2006) The influence of obesity on short- and long-term graft and patient survival after renal transplantation. Transpl Int 19: 901-907.
Citation: Yuen SK, McDonald S (2020) Body Mass Index and Overall Graft Survival: An Analysis of ANZDATA. J Nephrol Renal Ther 6: 028.
Copyright: © 2020 Sze Kit Yuen, et al. This is an open-access article distributed under the terms of the Creative Commons Attribution License, which permits unrestricted use, distribution, and reproduction in any medium, provided the original author and source are credited.