Carotid Thin Fluttering Bands: Fact or Artifact?
*Corresponding Author(s):
Luca CostanzoDepartment Of Cardiotoracovascular, Division Of Angiology, Ferrarotto-Policlinic Hospital, University Of Catania, Catania, Italy
Tel:+39 3384486289,
Email:lucacost84@gmail.com
Abstract
Background: Carotid artery ultrasound is able to investigate various step of atherosclerosis progression. Thin Fluttering Bands (TFBs) have been described in carotid lumen at various stage of atherosclerosis; however the incidence reported was low.
Aim: To investigate incidence of TFBs in carotid lumen after a long time learning curve and to provide ultrasound features of such finding.
Methods: 915 patients were admitted from October 2015 to October 2016. Patients with recent of Cerebral Ischemia (CI) were excluded.
Results: TFBs were found in 96 patients (10.5%). The mean age was 64.14 ± 10.52 years. In all patients increased Intima-Media Thickness (IMT) was found. In 70 patients (72.9%) the TFB was related to a carotid plaque while in 26 (27.1%) no carotid plaque was found. Multiple TFBs were found in 11.5% of patients and the preferential carotid region was the bulb (82.6%). No significant difference in localization between right and left carotid was fond (44% left, 56% right).
Conclusion: After a long-time of learning curve we found higher incidence of TFB. The pathophysiology is still unknown; however it could be related atherosclerosis evolution.
Keywords
Artifact; Atherosclerosis; Carotid; Thin fluttering band; Ultrasound.
INTRODUCTION
Atherosclerosis is a complex phenomenon than involves complex interactions among several processes as lipo-protein retention, inflammatory cell recruitment, foam cell formation, apoptosis and necrosis, Smooth Muscle Cell (SMC) proliferation and matrix synthesis, calcification, angiogenesis, arterial remodelling [1]. Carotid Ultrasound Scan (CUS) is a validated technique to assess systemic atherosclerosis and has shown high sensitivity and specificity to investigate the presence and severity of atherosclerotic disease [2,3]. Particularly, CUS is able to investigate various step of atherosclerosis progression and carotid Intima-Media-Thickness (IMT) measurement is considered as an early marker of atherosclerosis involvement [4]. In a previous paper we described presence of thin bands fluttering into carotid lumen and we postulated such finding is a step in atherosclerosis progression [5]. We found carotid Thin Fluttering Band (TFB) in 2.1% of patients who underwent CUS for atherosclerosis’ screening, the majority in absence of a carotid plaque (69%) and in all cases increased IMT was observed [5].
Aim of the present study is to report last year experience in assessing TFB after a long learning curve and to describe differences between TFB and artefacts.
METHODS
TFB was defined as presence of hyperechoic fluttering band in the carotid lumen in absence of echo graphic pattern of dissection such as visualization of false lumen, low-reflection mural hematoma or thrombus or Doppler high-resistance flow [6]. All studies were performed using GE Vivid E Ultrasound system (GE Healthcare, Horten, Norway) equipped with a dedicated 8L-RS linear array transducer (4-12 MHz) by a single experienced vascular sonographer.
STUDY PROTOCOL
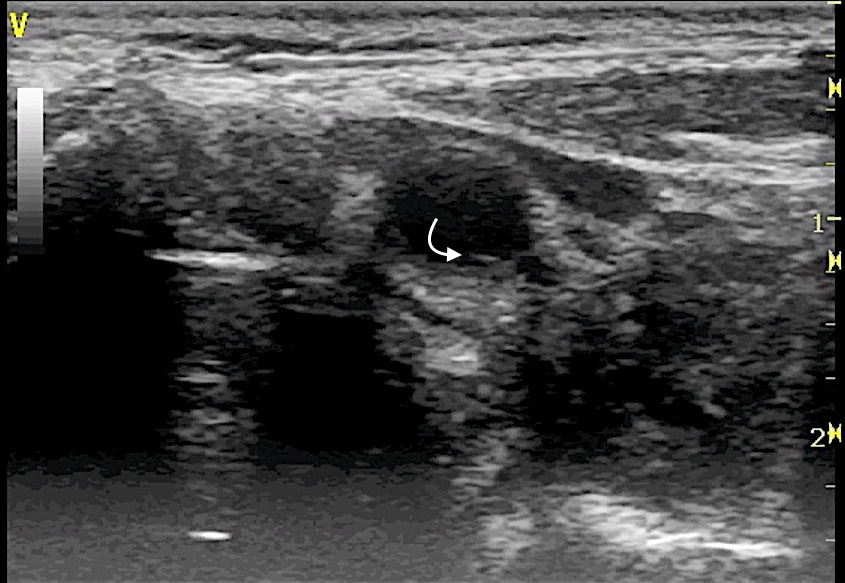
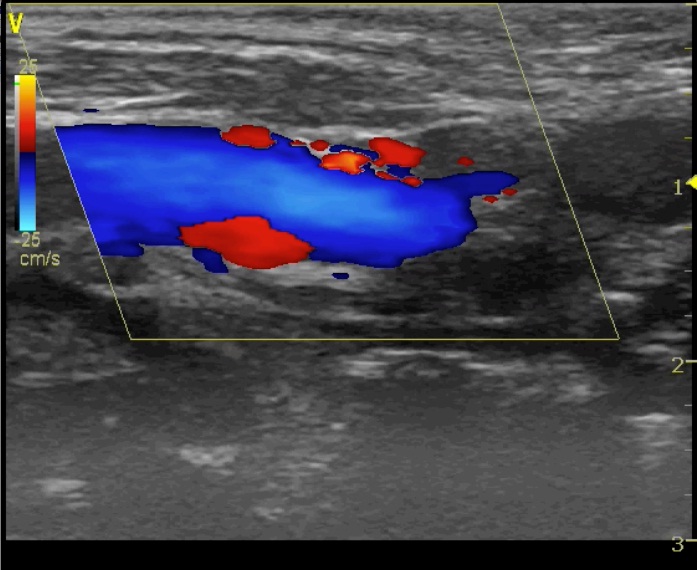
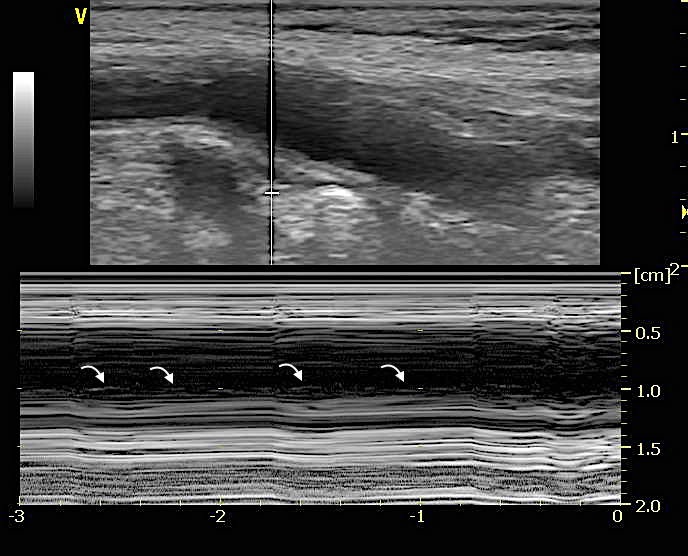
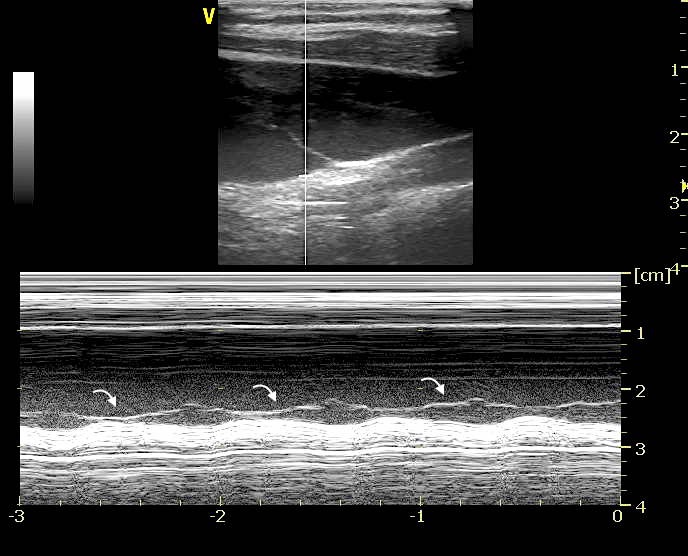
TFB was visualized in both longitudinal (Figure 1A, Video 1A), transverse B-mode scan (Figure 1B, Video 1B) and color-doppler scan (Figure 1C, Video 1C); the Motion mode (M-mode) image scan, perpendicularly oriented to the TFB, was also performed in both sections to confirm the intra-vessel location of TFB (Figure 1D). M-mode scan helped in differentiate TFB from reverberation artifacts (Video 2) or venous valve (Figure 2, Video 3).
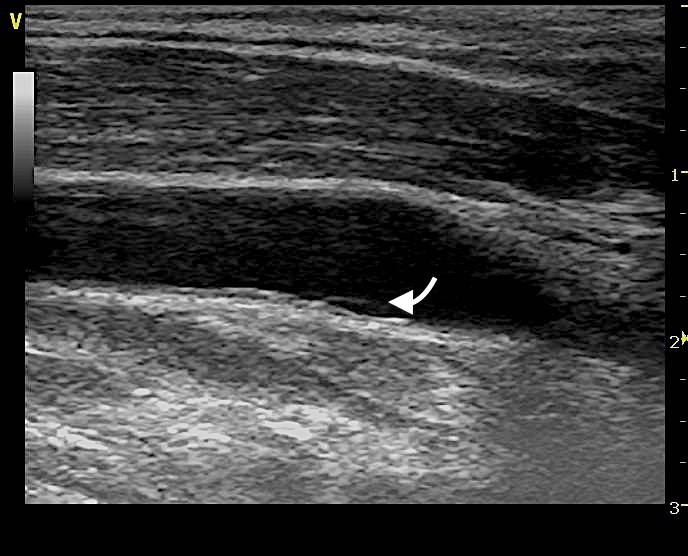 Figure 1: Long axis view in B-mode show the Thin Fluttering Band (TFB) in the posterior carotid wall (arrow).
Video 1 A: Pancreatoscopy showing floating mucin in the pancreatic duct and the whitish mucin globule.
RESULTS
|
Overall N=96 |
NP-TFB N=26 |
P-TFB N=70 |
p-value* | |
| Age, mean ± SD | 64.14 ± 10.52 | 56.35 ± 11.14 | 67.03 ± 8.74 | 0.001 |
| IMT (mm), mean ± SD | 1.15 ± 0.14 | 1.09 ± 0.14 | 1.17 ± 0.13 | 0.022 |
| BMI (kg/m2), mean±SD | 25.30 ± 0.27 | 25.10 ± 2.70 | 25.37 ± 2.54 | 0.64 |
| Gender male, n (%) | 59 (61.5) | 12 (46.2) | 47 (67.1) | 0.060 |
| Smoke, n (%) | 49 (51.0) | 11 (42.3) | 38 (54.3) | 0.297 |
| Hypertension, n (%) | 55 (57.3) | 12 (46.2) | 43 (61.4) | 0.179 |
| Diabetes, n (%) | 16 (16.7) | 2 (7.7) | 14 (20) | 0.22 |
| Dyslipidemia, n (%) | 59 (61.5) | 14 (53.8) | 45 (64.3) | 0.35 |
| Family history of CAD, n (%) | 26 (27.1) | 8 (30.8) | 18 (25.7) | 0.615 |
| CKD, n (%) | 5 (5.6) | 1 (3.8) | 3 (4.3) | 0.059 |
*p calculated among groups
In all patients we found increased intima media thickness (IMT – mean 1.15 ± 0.14); in 70 patients (72.9%) TFB was found in presence of a plaque while in 26 patients (27.1%) no carotid plaque was observed (Figure 3, Video 4). TFB was single in most of patients (n=85, 88.5%) while in 11 patients (11.5%) it was multiple. Total TFBs observed were 109, 61 (56 %) in the right carotid and 48 (44%) in the left carotid. The majority originated in the carotid bulb (82.6%) followed by the internal carotid artery (10.1%) and the common carotid artery (7.3%).
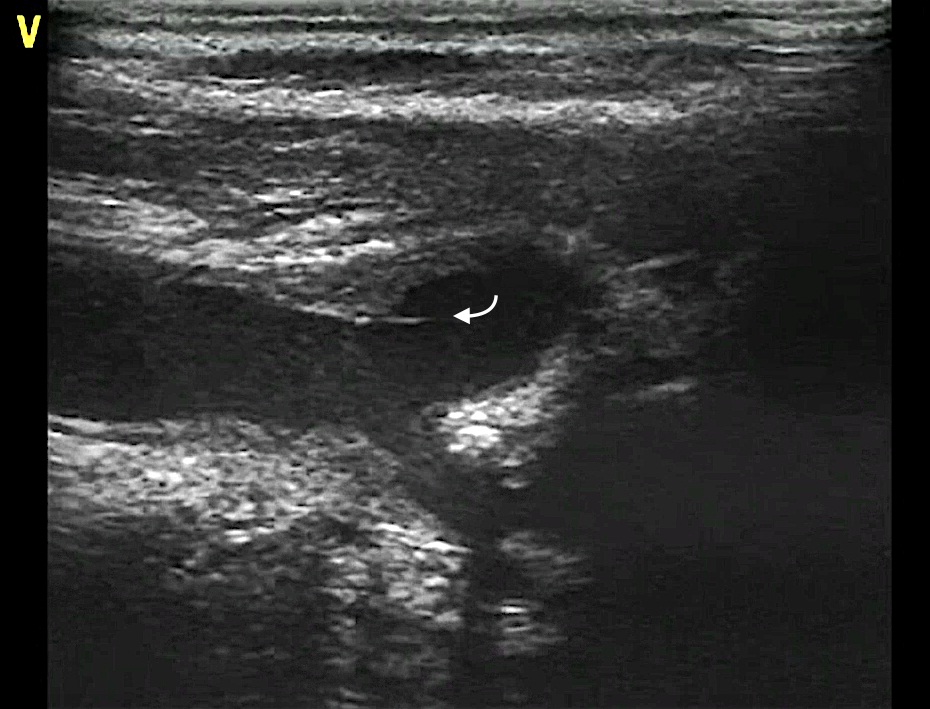 Figure 3: A plaque with a TFB is observed in the bulb of a right carotid artery.
DISCUSSION
This study also confirm the previous observation that most of TFBs originated in the carotid bulb, a well known site of disturbed flow where alternation of color doppler are frequently found in presence of TFB (Figure 1C, Video 1C).
Respect to the previously reported series we found higher prevalence of TFBs related to carotid plaque. Ultrasound characteristics of P-TFB are comparable to those found in NP-TFB indeed TFB co-localize with augmented IMT therefore we believe that TFB is not a structure related to the plaque. The increased IMT found in P-TFB group could be explained by the different atherosclerotic stage of patient with carotid plaque respect to those without carotid plaque.
A practical tip that may help in visualize TFB is to tilt slowly the probe from lateral to the center in longitudinal scan when focal augmented IMT is associated with large disturbed flow (alternation of color) in carotid bulb.
Although the pathophysiology of TFB is still unknown, also in this report all patients showed increased IMT, therefore we can speculate that TFB occurs in a precocious stage of atherosclerotic involvement and it could be a dynamic phenomenon of vessel remodeling. Endothelial Shear Stress (ESS) alteration, commonly observed in the carotid bulb, triggers expression of several factors such as adhesion molecules, chemokines and pro-inflammatory cytokines [8-10]. Intimal layer adapts in response to changes in ESS and tensile stress through several dynamic process (REF) that lead to progressive thickening of such tunica, therefore TFB could be the expression of intimal turnover [11].
LIMITATIONS
REFERENCES
- Bentzon JF, Otsuka F, Virmani R, Falk E (2014) Mechanisms of plaque formation and rupture. Circ Res 114: 1852-1866.
- Müller M, Ciccotti P, Reiche W, Hagen T (2001) Comparison of color-flow Doppler scanning, power Doppler scanning, and frequency shift for assessment of carotid artery stenosis. J Vasc Surg 34: 1090-1095.
- Rodondi N, Auer R, de Bosset Sulzer V, Ghali WA, Cornuz J (2012) Atherosclerosis screening by noninvasive imaging for cardiovascular prevention: a systematic review. J Gen Intern Med 27: 220-231.
- Devine PJ, Carlson DW, Taylor AJ (2006) Clinical value of carotid intima-media thickness testing. J Nucl Cardiol 13: 710-718.
- Costanzo L, Sole A, Tamburino C, Di Pino L (2015) Carotid thin fluttering bands: A new element of arterial wall remodelling? An ultrasound study. Int J Cardiovasc Imaging 31: 1393-1400.
- Flis CM, Jäger HR, Sidhu PS (2007) Carotid and vertebral artery dissections: clinical aspects, imaging features and endovascular treatment. Eur Radiol 17: 820-834.
- Stein JH, Korcarz CE, Hurst RT, Lonn E, Kendall CB, et al. (2008) Use of carotid ultrasound to identify subclinical vascular disease and evaluate cardiovascular disease risk: a consensus statement from the American Society of Echocardiography Carotid Intima-Media Thickness Task Force. Endorsed by the Society for Vascular Medicine. J Am Soc Echocardiogr 21: 93-111.
- Augst AD, Ariff B, McG Thom SA, Xu XY, Hughes AD ( 2007) Analysis of complex flow and the relationship between blood pressure, wall shear stress, and intima-media thickness in the human carotid artery. Am J Physiol Heart Circ Physiol 293: 1031-1037.
- Orr AW, Sanders JM, Bevard M, Coleman E, Sarembock IJ, et al. (2005) The subendothelial extracellular matrix modulates NF-kappaB activation by flow: a potential role in atherosclerosis. J Cell Biol 169: 191–202.
- Cheng C, Tempel D, van Haperen R, de Boer HC, Segers D, et al. (2007) Shear stress-induced changes in atherosclerotic plaque composition are modulated by chemokines. J Clin Invest 117: 616-626.
- Wentzel JJ, Chatzizisis YS, Gijsen FJ, Giannoglou GD, Feldman CL, et al. (2012) Endothelial shear stress in the evolution of coronary atherosclerotic plaque and vascular remodelling: current understanding and remaining questions. Cardiovasc Res 96: 234–243.
Citation: Di Pino L, Costanzo L, Tamburino C (2017) Carotid Thin Fluttering Bands: Fact or Artifact? J Non invasive Vasc Invest 2: 006.
Copyright: © 2017 Luigi Di Pino, et al. This is an open-access article distributed under the terms of the Creative Commons Attribution License, which permits unrestricted use, distribution, and reproduction in any medium, provided the original author and source are credited.