Cause-Specific Trajectories of Terminal Decline in Walking Speed: Evidence from the English Longitudinal Study of Ageing
*Corresponding Author(s):
Paola ZaninottoDepartment Of Epidemiology And Public Health, University College London, 1-19 Torrington Place London, WC1E 7HB, United Kingdom
Tel:+0044 02076791668,
Email:p.zaninotto@ucl.ac.uk
Abstract
Objective: To explore over trajectories of terminal decline and terminal drop in a large nationally representative sample of older adults aged 60 and over living in England. We further explore whether trajectories in terminal decline differed according to the cause of death.
Methods: Data are from participants aged 60 and over of the English Longitudinal Study of Ageing (ELSA) from 2002 to 2018. Repeated measures of walking speed were used, which was assessed objectively over a distance of 8ft (2.4m). Mortality by cause was ascertained up to 2018. Mixed effects models were used to estimate growth curve models of walking speed by cause of death, adjusted for confounders.
Results: Compared to survivors, respondents who died of cancer (b=-0.034m/s; 95% CI: -0.05; -0.01), cardiovascular diseases (b=-0.082m/s; 95% CI: -0.13; -0.06), and respiratory diseases (b=-0.137m/s; 95% CI: -0.24; -0.10) reported significant lower walking speed. Also, declines in walking speed accelerate closer to death particularly for those who died of cardiovascular (b=-0.003m/s) and respiratory diseases (b=-0.005m/s).
Conclusion: We observed both terminal decline and terminal drop in walking speed in the years preceding death. Participants aged 70 who died of cardiovascular and respiratory conditions had steeper decline of walking speed.
Keywords
Cardiovascular; Mortality; Older age; Respiratory; Walking speed
INTRODUCTION
Waking speed is a simple and accessible performance based measure that has been recommended as an indicator of the vitality of an individual [1]. Walking speed is often used in clinical and research settings [2]. It has been shown that slow walking speed is an early marker of disability, frailty and mortality [3-8], most likely because it integrates clinical and subclinical disturbances in several organs and systems, many of which are thought to affect both dependence and survival [4,9-11]. Although slow walking speed has consistently been found to be associated with all- cause mortality, little attentions has been paid to cause-specific mortality. Some evidence is emerging on the association between slow walking speed and increased risk of cardiovascular mortality [11]. Several explanations of this link have been formulated, such as chronic exposure to vascular risk factors which in turn is associated with both slower walking speed and cardiovascular mortality. It is also possible that heart failure or peripheral artery diseases are linked to slower walking speed [11]. Other possible explanations of the link between slow walking speed and cardiovascular mortality include risk factors for CVD, such as higher inflammatory and oxidative stress levels, and it has been observed that people with endocrine abnormalities often have slow gait speed [12,13]. Nevertheless, little is known about whether a link between walking speed and mortality exists when also other causes of death are considered, such as respiratory and cancer mortality.
Moreover, the few studies which have investigated the relationship between repeated measures of walking speed and all-cause mortality among older adults [10,14-17] have paid little attention to terminal decline and terminal drop in walking speed. Generally, terminal decline refers to a gradual decline in individuals’ functional capacities [18] in the years preceding death, whereas a terminal drop refers to an abrupt decline closer to death. To date no studies have investigated whether these trajectories of terminal decline and drop differ by mortality cause. Accordingly, the aim of this study is to explore the trajectories of terminal decline and terminal drop in a large nationally representative sample of older adults aged 60 and over living in England. We further explore whether trajectories in terminal decline differed according to the cause of death.
MATERIALS AND METHODS
Study design and participants
The English Longitudinal Study of Ageing (ELSA) is an ongoing cohort study of individuals aged 50 and older who live in private households in England. The first wave of data collection took place in 2002/03, with subsequent data collected biennially with a total of 9 waves collected up to 2018/19. Data collection includes a face-to-face interview at each wave and trained-nurse visits in the participants’ homes at alternative waves, to collect anthropometry measures. The full details of the study are described elsewhere [19,20]. The analytical sample for this study includes individuals aged 60 and over at the time of their first interview, as only individuals aged 60 and older were eligible for a walking speed test, our main variable of interest (n=8,642). We then restricted our sample to those who had at least two valid walking speed measurements (n=6,157). To account for height and weight, we further restricted inclusion to those respondents who had at least 1 valid anthropometric measurement (n=5,619). Ethical approval and experimental protocols were granted by the Multi-centre Research and Ethics Committee (MREC). Respondents in ELSA gave their informed consent to participate in the study and for data linkage.
Mortality outcome
Study participants were linked to the National Health Service's Central Registry which provides vital status data. For each deceased participant, the month and year of death are recorded up to the end of follow-up (April 2018). Also, data regarding causes of death are provided for broad classifications of disease according to the International Classification of Diseases. These classifications include cancer (codes C00-C97), Cardiovascular Disease (CVD, codes I00-I99), diseases of the respiratory system (codes J00-J99), and “other [remaining] causes.”
Walking speed
Respondents aged 60 and older were eligible for a walking speed test, which involved timing how long it took to walk a distance of 8 ft (2.4 m) and back to the start. Walking aids were permitted for the walking speed test and were used by approximately 4% of the respondents who successfully completed the task. We used mean walking speed based on the two timings (range = 0.09 – 2.2 m/s).
Covariates
We considered the following time-invariant variables: age (continuous variable, centred at the mean age of the sample); sex (0 = male; 1 = female); ethnicity (0 = white; 1 = non-White); education (0= college and above; 1= less than college). All other covariates were time-varying and included cohabitation status (currently living with a partner or not) and total wealth in quintiles (with the top quintile indicating the richest group). We also controlled for a wide range of major risk factors: smoking status (0 = never and ex-smoker; 1 = current smoker); physical activity (0 = physically active; 1 = hardly ever engage in any physical activity); limitations with Instrumental Activity of Daily Living (IADL, none versus at least one); memory score index (immediate and delayed recall of 10 items, ranging from 0 to 20). Chronic diseases and health conditions were determined at each wave by asking respondents whether a doctor ever told them that they had one of the following conditions: Coronary Heart Disease (CHD), diabetes, chronic respiratory illness (bronchitis, emphysema, pulmonary disease, or asthma), stroke, cancer, arthritis and osteoporosis. Symptoms of depression were measured using the eight-item version of the Centre for Epidemiologic Studies Depression Scale (with respondents classified as depressed if they reported four or more symptoms). Finally, Body Mass Index (BMI) was calculated using nurse-measured height and weight and we additionally controlled independently for the respondent’s height.
Statistical analysis
Given repeated measures of health outcomes within individuals, mixed effects models were used to estimate growth curve models of walking speed by cause of death using a maximum likelihood algorithm. Respondents were censored at their date of death or at their latest available follow-up, whichever came first. Given our interest in the terminal decline as well as terminal drop, we considered both time (in years) as well as a quadratic function of time. Moreover, in order to understand whether respondents experience differential changes in their walking speed based on their cause of death, we allowed for random slopes. Minimally and fully adjusted models were estimated. The former adjusted for age, time, time squared, gender and cause of death. The latter model further controlled for the socio-economic, life-style related risk factors and chronic health conditions above mentioned. As a robustness check, analyses were then re-run separately for those aged 60-69 and 70 and older at baseline to examine whether, the trajectories were dependant on age groups, given that a smaller percentage of those aged 60-69 died by the end of the period considered in this study. All analyses were performed in Stata 15.
RESULTS
Baseline sample characteristics
Baseline characteristics of both deceased and surviving individuals are shown in table 1. Overall, surviving individuals had a higher walking speed that those who died, and tended to be younger, wealthier, better educated, and generally to be in good health. Among those who died, respondents who deceased from cardiovascular diseases and diseases of the respiratory system were older and walked slower than those who died of cancer.
|
|
|
Mortality Status by April 2018 |
|
|||||||
|
|
Alive |
Dead |
Cancer |
CVD |
Respiratory disease |
Other |
P value |
|||
|
Number of Respondents |
3,475 |
2,144 |
682 |
681 |
307 |
474 |
|
|||
|
Time to death (years): mean (s.d.) |
|
9.39 (3.69) |
8.99 (3.67) |
9.08 (3.72) |
9.68 (3.59) |
10.3 (3.60) |
<0.001 |
|||
|
Walking speed (m/sec): mean (s.d.) |
0.94 (0.27) |
0.79 (0.26) |
0.85 (0.24) |
0.75 (0.27) |
0.75 (0.24) |
0.76 (0.28) |
<0.001 |
|||
|
Age (years): mean (s.d.) |
66.2 (4.47) |
72.7 (7.06) |
70.5 (6.18) |
74.0 (7.16) |
73.2 (7.42) |
74.1 (7.06) |
<0.001 |
|||
|
Women, % |
57.2 |
48.2 |
44.7 |
48.3 |
45.3 |
54.6 |
<0.001 |
|||
|
Demographic and Socio-Economic characteristics |
||||||||||
|
Non-White Ethnicity, % |
2.3 |
1.3 |
0.9 |
1.9 |
1.6 |
0.8 |
0.035 |
|||
|
Partnered, % |
71.8 |
59.0 |
67.0 |
55.4 |
52.7 |
57.0 |
<0.001 |
|||
|
No educational qualification, % |
38.6 |
52.2 |
45.4 |
53.5 |
56.2 |
57.2 |
<0.001 |
|||
|
In lowest wealth quintile, % |
17.2 |
25.4 |
21.1 |
26.1 |
35.9 |
24.0 |
<0.001 |
|||
|
Health characteristics and health behaviours |
||||||||||
|
BMI (Kg/m2): mean (s.d.) |
28.1 (4.71) |
27.6 (4.82) |
27.8 (4.43) |
28.0 (5.00) |
26.6 (5.00) |
27.4 (4.90) |
<0.001 |
|||
|
Height (cm): mean (s.d) |
165.3 (9.25) |
164.2 (9.89) |
166.1 (9.65) |
163.5 (9.70) |
163.5 (10.1) |
163.0 (10.0) |
<0.001 |
|||
|
Current smoker, % |
11.4 |
18.5 |
19.2 |
16.6 |
30.3 |
12.3 |
<0.001 |
|||
|
Any difficulty in IADL, % |
12.6 |
23.2 |
16.9 |
24.8 |
28.3 |
26.8 |
<0.001 |
|||
|
Hardly ever engage in any physical activity, % |
3.9 |
7.6 |
4.7 |
9.5 |
9.4 |
7.8 |
<0.001 |
|||
|
Memory score: mean (s.d.) |
10.0 (3.17) |
8.2 (3.37) |
9.1 (3.37) |
7.8 (3.26) |
7.9 (3.23) |
7.6 (3.38) |
<0.001 |
|||
|
Diagnoses and Health conditions, % |
||||||||||
|
CHD |
9.2 |
20.3 |
14.7 |
28.3 |
18.9 |
17.7 |
<0.001 |
|||
|
Diabetes |
5.6 |
11.3 |
9.2 |
12.8 |
9.1 |
13.7 |
<0.001 |
|||
|
Depressive symptoms (4+ CESD) |
12.7 |
17.7 |
12.6 |
19.1 |
22.2 |
20.0 |
<0.001 |
|||
|
Chronic Respiratory Illness |
13.9 |
18.8 |
14.7 |
17.3 |
34.9 |
16.5 |
<0.001 |
|||
|
Stroke |
2.2 |
6.3 |
3.7 |
8.8 |
5.9 |
7.0 |
<0.001 |
|||
|
Cancer |
5.4 |
9.0 |
15.1 |
6.9 |
4.9 |
5.7 |
<0.001 |
|||
|
Arthritis |
32.4 |
37.6 |
31.8 |
42.1 |
36.7 |
39.7 |
<0.001 |
|||
|
Osteoporosis |
5.3 |
6.5 |
5.0 |
7.0 |
8.1 |
6.8 |
0.087 |
|||
Table 1: Baseline characteristics of participants according to their mortality status by April 2018 (n=5,619).
Source: ELSA, Waves 1-8 with at least 2 valid measurements of walking speed. Own calculations.
Multilevel models of walking speed by mortality status
Table 2 shows the main effects for the relationship between mortality status and walking speed at baseline. The coefficients for the interaction between mortality status and time provide the effect of mortality on the rate of change in walking speed. In the minimally adjusted model, the mean intercept at 60 years was 0.806m/s. All respondents who died had significantly lower walking speed than those still alive at the end of period considered. In particular, respondents who died of diseases of the respiratory system reported the lowest baseline walking speed (b=-0.260m/s, p<0.001) compared to those who died of CVD and cancer. Both the linear (b=-0.018) and quadratic (b=-0.001) time terms were negatively and statistically significant, indicating accelerating walking speed declines in proximity to death. Finally, in the minimally adjusted model, those who died of respiratory-related diseases reported the fastest walking speed decline (b=-0.010, p value<0.001).
|
|
Minimal adjustment model (age, gender, time, time2) |
Fully adjusted model |
|
Alive |
Reference |
Reference |
|
Cancer |
-0.068 (-0.09; -0.04) |
-0.034 (-0.54; -0.01) |
|
CVD |
-0.167 (-0.19; -0.14) |
-0.082 (-0.13; -0.06) |
|
Respiratory disease |
-0.260 (-0.27; -0.20) |
-0.137 (-0.24; -0.10) |
|
Time (years) |
-0.018 (-0.02;-0.02) |
-0.014 (-0.02; -0.01) |
|
Time2 |
-0.001 (-0.00; -0.00) |
-0.000 (-0.00; -0.00) |
|
Time* cause of death |
|
|
|
Cancer |
-0.003 (-0.01; -0.00) |
-0.001 (-0.00; 0.00) |
|
CVD |
-0.007 (-0.01; -0.00) |
-0.003 (-0.01; -0.00) |
|
Respiratory disease |
-0.010 (-0.01; -0.01) |
-0.005 (-0.01; -0.00) |
|
Gender |
-0.088 (-0.10; 0.07) |
-0.032 (-0.05; -0.02) |
|
Gender slope |
-0.002 (-0.00; -0.00) |
-0.001 (-0.00; 0.00) |
|
Constant |
0.806 (0.79; 0.81) |
0.692 (0.48; 0.79) |
Table 2: Fully adjusted growth curve model, both genders together (n=5,579).
ELSA, Waves 1-8 and nurse visits. Fully adjusted model controls for Ethnicity, partnership, wealth quintiles, education, BMI, Height (cm), smoking, Memory score, IADL limitations, level of physical activity, depressive symptoms, CHD, diabetes, Respiratory disease, Arthritis, Stroke, Cancer, and osteoporosis. Own calculations
After full adjustment (full model available as Supplementary table 1), both the intercept and the rate of decline in walking speed were attenuated. However, we observed that those who died during the follow-up period had a slower walking speed at baseline compared to surviving individuals, even after controlling for socio-economic status, health behaviours and health conditions. In particular, those who died of cancer, CVD, and respiratory diseases reported lower walking speed of 0.034m/s (95% CI: -0.05; -0.01), 0.082m/s (95% CI: -0.13; -0.06) and 0.137m/s (95% CI: -0.24; -0.10) compared to survivors. The linear and quadratic time terms remained statistically significant, indicating accelerating change in walking speed closer to death, so called terminal drop. Lastly, in the fully-adjusted model, only those who died of cardiovascular and respiratory diseases reported significantly faster declines in walking speed, on average, compared to the surviving group (b=-0.003m/s and -0.005m/s respectively). Women reported slower walking speed than men at baseline, but no gender differences were observed in the rate of decline.
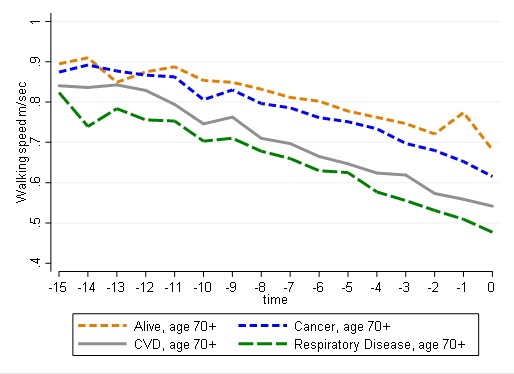
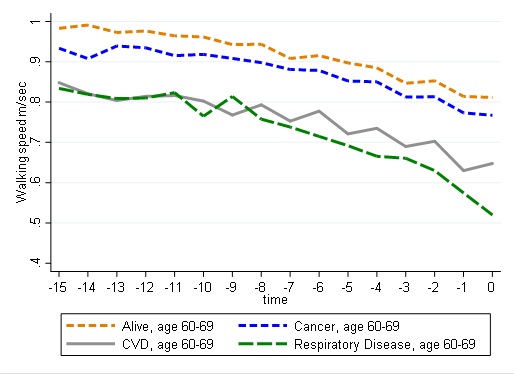
Figure 1 shows graphically the trajectories of walking speed in the 15 years preceding death (or the latest available information for survivors). As expected, for all individuals, walking speed declined over time, with those surviving starting off with higher speed and maintaining higher walking speed levels over the entire follow-up period. Those who died of cancer had a lower starting point but declined similarly than surviving respondents, whereas those dying of CVD or respiratory diseases showed worse walking speed profiles at baseline and reported faster declines closer to their death. In a separate set of analysis by age-group (Supplementary table 2), we found that those aged 70 and older, who died of CVD and respiratory diseases, had accelerated change in walking speed.
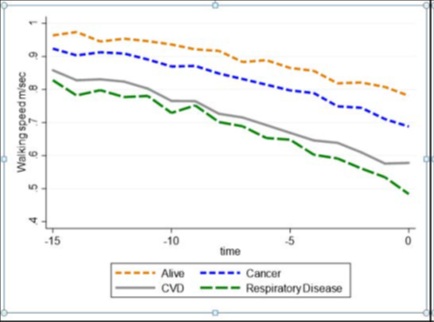
Figure 1: Graphical trajectories of walking speed.
DISCUSSION
Using 15 years of follow-up data linked to mortality registry, we examined trajectories of terminal decline and terminal drop and explored the extent to which these trajectories differed according to the cause of death in a large nationally representative sample of older individuals aged 60 and over in England. First, we analysed longitudinal data to explore whether a gradual decline in walking speed was observed in the years preceding death. In line with previous research, we found that that steeper decline in walking speed was associated with increased risk of all-cause mortality [10,14,17]. Furthermore, for the first time, this study reported an accelerated change in walking speed prior to death, referred to as terminal drop.
We also explored whether terminal decline in walking speed differed according to the cause of death, which has not been explored before. We found that those who died of cardiovascular and respiratory diseases had faster decline in walking speed, compared to those who remained alive. No differences were found in terminal decline between those dying of cancer and those who remained alive. Moreover, we observed an overall terminal drop in walking speed, and this was particularly significant among people aged 70 and over who died of cardiovascular and respiratory diseases. As these findings are novel, direct comparisons with previous studies are not possible. Nevertheless, previous studies have shown associations between slow walking speed and respiratory diseases [21,22] and slow walking speed and cardiovascular death [11]. A possible explanation for the observed terminal decline and terminal drop among people who died of respiratory diseases include muscle fatigue and muscle weakness associated with respiratory diseases [21,22]. Furthermore, it has been shown that people with chronic obstructive pulmonary disease manifest gait abnormalities, and they are also at higher risk of falls compared to healthy people [21,22]. Inflammation has also been shown to play a role in both cardiovascular health [23] and decline in walking speed [24,25], which might explain the steeper decline in walking speed observed in this study among those who died of cardiovascular diseases. Another possible explanation for the steeper decline in walking speed among people who died of cardiovascular disease include chronic exposure to vascular risk factors which in turn is associated with both increased cardiovascular mortality and decreased walking speed [11].
Strengths of this study include a large nationally representative sample of older people in England, objective measures of walking speed linked to mortality registry, and a long follow-up time. In addition, we were able to adjust our analyses for a wealth of covariates found to be related to both mortality and walking speed. However, a few limitations apply. First, no information on walking speed was available prior to the age of 60, it cannot be ruled out that decline in walking speed might start at even younger ages. Second, highly frail individuals did not attempt the walking speed test for security reasons, and this might further bias our results. Finally, walking speed measures were collected every two years and on a single occasion: it is possible that such time scale misses a wider range of possible patterns of decline and that more frequent repeated measure would better allow to capture the terminal drop.
To conclude, this is the first study to report both terminal decline and terminal drop in walking speed in the years preceding death. Furthermore, we found that among people aged 70 and over trajectories of walking speed were steeper for those dying of cardiovascular and respiratory conditions. As walking speed is a relatively simple test to administer, more efforts should be made to monitor decline in walking speed especially among older people with cardiovascular and respiratory conditions.
DISCLOSURE
No conflicts of interest declared concerning the publication of this article.
FUNDING
The English Longitudinal Study of Ageing is supported by the National Institute on Aging (grant numbers: 2RO1AG7644 and 2RO1AG017644-01A1) and a consortium of the UK government departments coordinated by the National Institute for Health Research. The funding bodies had no role in the study design; in the collection, analysis, and interpretation of data; in the writing of the manuscript; and in the decision to submit the manuscript for publication.
REFERENCES
- Hall WJ (2006) Update in geriatrics. Ann Intern Med 145: 538-543.
- Peel NM, Kuys SS, Klein K (2013) Gait speed as a measure in geriatric assessment in clinical settings: a systematic review. J Gerontol A Biol Sci Med Sci 68: 39-46.
- Cooper R, Kuh D, Hardy R; Mortality Review Group; FALCon and HALCyon Study Teams (2010) Objectively measured physical capability levels and mortality: systematic review and meta-analysis. BMJ 341: 4467.
- Studenski S, Perera S, Patel K, Rosano C, Faulkner K, et al. (2011) Gait speed and survival in older adults. JAMA 305: 50-58.
- Liu B, Hu X, Zhang Q, Fan Y, Li J, et al. (2016) Usual walking speed and all-cause mortality risk in older people: A systematic review and meta-analysis. Gait Posture 44: 172-177.
- Veronese N, Stubbs B, Volpato S, Zuliani G, Maggi S, et al. (2018) Association Between Gait Speed With Mortality, Cardiovascular Disease and Cancer: A Systematic Review and Meta-analysis of Prospective Cohort Studies. J Am Med Dir Assoc 19: 981-988.
- Guralnik JM, Ferrucci L, Pieper CF, Leveille SG, Markides KS, et al. (2000) Lower extremity function and subsequent disability: consistency across studies, predictive models, and value of gait speed alone compared with the short physical performance battery. J Gerontol A Biol Sci Med Sci 55: 221-231.
- Cesari M, Kritchevsky SB, Penninx BW, Nicklas BJ, Simonsick EM, et al. (2005) Prognostic value of usual gait speed in well-functioning older people--results from the Health, Aging and Body Composition Study. J Am Geriatr Soc 53: 1675-1680.
- Heiland EG, Welmer AK, Wang R, Santoni G, Angleman S, et al. (2016) Association of mobility limitations with incident disability among older adults: A population-based study. Age Ageing 45: 812-819.
- White DK, Neogi T, Nevitt MC, Peloquin CE, Zhu Y, et al. (2013) Trajectories of gait speed predict mortality in well-functioning older adults: The Health, Aging and Body Composition study. J Gerontol A Biol Sci Med Sci 68: 456-464.
- Dumurgier J, Elbaz A, Ducimetière P, Tavernier B, Alpérovitch A, et al. (2009) Slow walking speed and cardiovascular death in well functioning older adults: Prospective cohort study. BMJ 339: 4460.
- Libby P (2006) Inflammation and cardiovascular disease mechanisms. Am J Clin Nutr 83: 456-460.
- Nettleship J, Jones R, Channer K, Jones T (2009) Testosterone and coronary artery disease. Front Horm Res 37: 91-107.
- Wilson RS, Segawa E, Buchman AS, Boyle PA, Hizel LP, et al. (2012) Terminal decline in motor function. Psychol Aging 27: 998-1007.
- Elbaz A, Sabia S, Brunner E, Shipley M, Marmot M, et al. (2013) Association of walking speed in late midlife with mortality: Results from the Whitehall II cohort study. Age (Dordr) 35: 943-952.
- Buchman AS, Wilson RS, Boyle PA, Bienias JL, Bennett DA (2007) Change in motor function and risk of mortality in older persons. J Am Geriatr Soc 55: 11-19.
- Sabia S, Dumurgier J, Tavernier B, Head J, Tzourio C, et al. (2014) Change in fast walking speed preceding death: Results from a prospective longitudinal cohort study. J Gerontol A Biol Sci Med Sci 69: 354-362.
- Gerstorf D, Ram N (2013) Inquiry into terminal decline: Five objectives for future study. Gerontologist 53: 727-737.
- Zaninotto P, Steptoe A (2019) English Longitudinal Study of Ageing. In: Gu D, Dupre ME (eds.). Encyclopedia of Gerontology and Population Aging. Springer International Publishing, Cham, Switzerland.
- Steptoe A, Breeze E, Banks J, Nazroo J (2013) Cohort profile: The English longitudinal study of ageing. Int J Epidemiol 42: 1640-1648.
- Ilgin D, Ozalevli S, Kilinc O, Sevinc C, Cimrin AH (2011) Gait speed as a functional capacity indicator in patients with chronic obstructive pulmonary disease. Ann Thorac Med 6: 141-146.
- Ozalevli S, Ilgin D, Narin S, Akkoclu A (2011) Association between disease-related factors and balance and falls among the elderly with COPD: A cross-sectional study. Aging Clin Exp Res 23: 372-377.
- Ridker PM, Hennekens CH, Buring JE, Rifai N (2000) C-reactive protein and other markers of inflammation in the prediction of cardiovascular disease in women. N Engl J Med 342: 836-843.
- Hamer M, Kivimaki M, Lahiri A, Yerramasu A, Deanfield JE, et al. (2010) Walking speed and subclinical atherosclerosis in healthy older adults: the Whitehall II study. Heart 96: 380-384.
- Verghese J, Holtzer R, Oh-Park M, Derby CA, Lipton RB, et al. (2011) Inflammatory markers and gait speed decline in older adults. J Gerontol A Biol Sci Med Sci 66: 1083-1089.
SUPPLEMENTARY TABLES & FIGURE
Supplementary Table 1: Fully adjusted growth curve model
|
Variables |
Coef. |
Coef. |
95% CI |
|
|
Alive |
Ref |
(.) |
. |
. |
|
Cancer |
-0.034** |
(0.011) |
-0.054 |
-0.013 |
|
CVD |
-0.082** |
(0.012) |
-0.105 |
-0.059 |
|
Respiratory Disease |
-0.137** |
(0.017) |
-0.170 |
-0.105 |
|
Other |
-0.165** |
(0.014) |
-0.194 |
-0.137 |
|
Time (years) |
-0.014** |
(0.001) |
-0.016 |
-0.011 |
|
Time2 |
-0.000** |
(0.000) |
-0.000 |
-0.000 |
|
Time* cause of death |
|
|
|
|
|
Cancer |
-0.001 |
(0.001) |
-0.003 |
0.001 |
|
CVD |
-0.003* |
(0.001) |
-0.005 |
-0.000 |
|
Respiratory Disease |
-0.005** |
(0.002) |
-0.009 |
-0.002 |
|
Other |
-0.009** |
(0.002) |
-0.012 |
-0.006 |
|
Age (centred) |
-0.008** |
(0.000) |
-0.009 |
-0.007 |
|
Gender |
-0.032** |
(0.008) |
-0.047 |
-0.016 |
|
Gender slope |
-0.001+ |
(0.001) |
-0.003 |
0.000 |
|
Ethnicity |
-0.130** |
(0.018) |
-0.165 |
-0.096 |
|
Partnered |
0.014** |
(0.004) |
0.005 |
0.022 |
|
2nd wealth quintile |
0.015** |
(0.004) |
0.007 |
0.023 |
|
3rd wealth quintile |
0.022** |
(0.005) |
0.013 |
0.031 |
|
4th wealth quintile |
0.044** |
(0.005) |
0.035 |
0.054 |
|
Higher wealth quintile |
0.057** |
(0.005) |
0.047 |
0.067 |
|
Low Education |
-0.071** |
(0.008) |
-0.086 |
-0.056 |
|
BMI value |
-0.007** |
(0.000) |
-0.008 |
-0.006 |
|
Height (cm) |
0.002** |
(0.000) |
0.001 |
0.003 |
|
Smoker |
-0.017** |
(0.006) |
-0.028 |
-0.005 |
|
Memory score |
0.005** |
(0.000) |
0.004 |
0.005 |
|
IADL limitation (1 or more) |
-0.078** |
(0.003) |
-0.084 |
-0.071 |
|
Sedentary |
-0.067** |
(0.006) |
-0.078 |
-0.056 |
|
With 4 or more CESD depressive symptoms |
-0.039** |
(0.004) |
-0.046 |
-0.031 |
|
CHD |
-0.032** |
(0.005) |
-0.042 |
-0.022 |
|
Diabetes |
-0.037** |
(0.006) |
-0.048 |
-0.026 |
|
Respiratory |
-0.026** |
(0.005) |
-0.035 |
-0.016 |
|
Arthritis |
-0.050** |
(0.004) |
-0.057 |
-0.043 |
|
Stroke |
-0.056** |
(0.007) |
-0.071 |
-0.042 |
|
Cancer |
-0.010+ |
(0.006) |
-0.021 |
0.001 |
|
Osteoporosis |
-0.039** |
(0.006) |
-0.051 |
-0.028 |
|
Constant |
0.692** |
(0.063) |
0.569 |
0.815 |
|
Observations |
25,799 |
|
|
|
|
Number of groups |
5,579 |
|
|
|
Supplementary Table 2: Fully adjusted growth curve model, both genders together, among those aged 60-69 (n=3,323)
|
|
Model 1 |
Model 4 (Model 3 + Diagnoses and Health conditions) |
|
Alive |
Reference |
Reference |
|
Cancer |
-0.055 (-0.09; -0.02) |
-0.033 (-0.06; -0.00) |
|
CVD |
-0.168 (-0.21; -0.12) |
-0.061 (-0.10; -0.02) |
|
Respiratory disease |
-0.256 (-0.32; -0.20) |
-0.138 (-0.19; -0.08) |
|
Time (years) |
-0.018 (-0.02; -0.01) |
-0.014 (-0.02; -0.01) |
|
Time2 |
-0.000 (-0.00; -0.00) |
-0.000 (-0.00; -0.00) |
|
Time* Cause of death |
|
|
|
Cancer |
0.002 (-0.00; 0.00) |
0.000 (-0.00; 0.00) |
|
CVD |
-0.000 (-0.00; 0.00) |
-0.001 (-0.00; 0.00) |
|
Respiratory disease |
-0.009 (-0.02; -0.00) |
-0.005 (-0.01; 0.00) |
|
Gender |
-0.075 (-0.09; -0.06) |
-0.024 (-0.04; -0.00) |
|
Gender slope |
-0.001 (-0.00; 0.00) |
-0.001 (-0.00; 0.00) |
|
Constant |
0.897 (-0.88; 0.91) |
0.787 (-0.63; 0.94) |
Supplementary Table 3: Fully adjusted growth curve model, both genders together, among those aged 70+ (n=2,256)
|
|
Model 1 |
Model 4 (Model 3 + Diagnoses and Health conditions) |
|
Alive |
Reference |
Reference |
|
Cancer |
-0.062 (-0.10; -0.03) |
-0.028 (-0.06; 0.00) |
|
CVD |
-0.149 (-0.18; -0.12) |
-0.085 (-0.11; -0.06) |
|
Respiratory disease |
-0.212 (-0.26; -0.17) |
-0.132 (-0.17; -0.09) |
|
Time (years) |
-0.021 (-0.03; -0.02) |
-0.013 (-0.02; -0.01) |
|
Time2 |
-0.000 (-0.00; -0.00) |
-0.000 (-0.00; -0.00) |
|
Time* Cause of death |
|
|
|
Cancer |
-0.004 (-0.01; -0.00) |
-0.001 (-0.00; 0.00) |
|
CVD |
-0.008 (-0.01; -0.00) |
-0.004 (-0.01; -0.00) |
|
Respiratory disease |
-0.009 (-0.01; -0.00) |
-0.005 (-0.01; -0.00) |
|
Gender |
-0.108 (-0.13; -0.05) |
-0.047 (-0.07; -0.02) |
|
Gender slope |
-0.001 (-0.00; 0.00) |
-0.001 (-0.00; 0.00) |
|
Constant |
0.760 (-0.74; 0.78) |
0.632 (-0.43; 0.83) |
Supplementary Figure 1: Graphical trajectories of walking speed by age and cause of death
Citation: Zaninotto P, Di Gessa G (2020) Cause-Specific Trajectories of Terminal Decline in Walking Speed: Evidence from the English Longitudinal Study of Ageing. J Gerontol Geriatr Med 6: 051.
Copyright: © 2020 Paola Zaninotto, et al. This is an open-access article distributed under the terms of the Creative Commons Attribution License, which permits unrestricted use, distribution, and reproduction in any medium, provided the original author and source are credited.