Chemical Effects of Kainic Acid Injection into the Rat Superior Olivary Region
*Corresponding Author(s):
Donald A GodfreyDepartment Of Neurology And Division Of Otolaryngology And Dentistry, Department Of Surgery, University Of Toledo College Of Medicine And Life Sciences, Toledo, Ohio, United States
Tel:+1 4192446010,
Email:Donald.godfrey@utoledo.edu
Abstract
Kainic acid injections have been used to destroy neuron somata in particular regions without damaging fiber tracts. We injected a solution of kainic acid into the region of the rat superior olivary complex in an effort to destroy its cholinergic projections to the cochlea and cochlear nucleus, which derive especially from the lateral superior olivary nucleus and ventral nucleus of the trapezoid body. In the lateral superior olivary nucleus, there were relatively small but fairly consistent decreases of choline acetyltransferase (ChAT) activity, larger decreases of acetylcholinesterase (AChE) activity, and consistent decreases of malate dehydrogenase activity, as a marker for oxidative metabolism. Other superior olivary regions were less affected by the kainic acid injections, but most showed overall significant decreases of AChE activity. Our results suggest that the cholinergic neurons giving rise to the centrifugal pathways to the cochlea and cochlear nucleus are more resistant to the effects of kainic acid than are the neurons that receive major ascending input from the cochlear nucleus and project to higher levels of the auditory system. Comparison with published anatomical studies suggests that this resistance to the effects of kainic acid is related to relatively little glutamatergic input to the somata and proximal dendrites of these neurons. We also found a consistent approximately 16 % decrease of ChAT activity in the injected-side facial nerve root, which is most easily explained as a small effect of kainic acid on the facial nerve fibers passing through the injection site.
Keywords
Acetylcholinesterase; Choline acetyltransferase; Cochlea; Cochlear nucleus; Facial nerve; Olivocochlear
ABBREVIATIONS
AChE: Acetylcholinesterase
AVCN: Anteroventral cochlear nucleus
ChAT: Choline acetyltransferase
LSO: Lateral superior olivary nucleus
MDH: Malate dehydrogenase
MNTB: Medial nucleus of the trapezoid body
NAD: Nicotinamide adenine dinucleotide
SEM: Standard error of the mean
VNTB: Ventral nucleus of the trapezoid body
INTRODUCTION
The use of kainic acid to destroy neurons while sparing nearby fiber tracts has contributed to our understanding of neuronal circuitry and function in the central nervous system [1-5], including in the central auditory system [6-10]. The superior olivary complex is a major component of the central auditory system where sound localization is coded [8,11-13]. It is also a source of centrifugal cholinergic pathways to the cochlea of the inner ear and to the first auditory brainstem nucleus, the cochlear nucleus [14-21]. We injected kainic acid into the superior olivary region of rats in an attempt to destroy cholinergic neurons whose axons project to the cochlea and cochlear nucleus. We measured activities of choline acetyltransferase (ChAT), a reliable marker for cholinergic neurons, acetylcholinesterase (AChE), a second, less reliable, marker that is associated with cells receiving cholinergic input as well as with cholinergic neurons [22], and malate dehydrogenase (MDH), an important enzyme of oxidative energy metabolism [23]. Our results, published only in abstract form [24], did not show much effect on ChAT activity in the cochlea or cochlear nucleus. Since our aim at that time was to examine chemical effects of eliminating brainstem projections to the cochlear nucleus, the kainic acid experiments were not pursued further. More recent studies found a major effect of kainic acid injection into the superior olivary complex on cochlear nucleus activity [9] related to cholinergic input [25]. In the present report, a detailed analysis of the results of our study and comparison to the results of Kraus and Illing [9], together with other results published since our study [17,19,21,26], enable an explanation for the difference in reported findings between the two studies.Also, they provide insights about kainic acid effects and about inputs to auditory neurons of the superior olivary complex.
METHODS
Kainic acid injection and rat survival
The results are based on measurements on 4 Sprague-Dawley rats. The rats were anesthetized with sodium pentobarbital (35 mg/kg) and then placed in a stereotaxic frame (Kopf Instruments). The cerebral cortex overlying the right side of the brain was exposed after skull penetration with a high-speed electrical drill. Based on the atlas of Paxinos and Watson [27], lesions in the right side of the brain stem were produced by stereotaxically injecting toward the right superior olivary complex 0.5 or 1 µL of saline solution containing 10 nmol (2 µg) of kainic acid per µL. In accordance with animal care guidelines current at the time, the rats were kept in separate cages in the animal care facility for 7 days after kainic acid injection, during which their conditions were checked daily and their weights measured on most days. The rats appeared to recover well, were able to drink from their water bottles, and their rat chow was supplemented with orange slices placed into their cages in order to provide extra nutrition that was easy for them to reach (Table 1).
|
Rat |
Sex |
Weight |
Injection amount and duration |
Survival |
Final weight |
|
22581 |
Male |
417 g |
10 nmol (2 µg) in 1 µL over 5 min |
7 days |
374 g |
|
22681A |
Female |
370 g |
5 nmol (1 µg) in 0.5 µL over 15 min |
7 days |
356 g |
|
22681B |
Female |
295 g |
10 nmol (2 µg) in 1 µLa over 15 min |
7 days |
249 g |
|
22681C |
Female |
295 g |
5 nmol (1 µg) in 0.5 µL over 10 min |
7 days |
246 g |
aPossibly only 0.5 µL was injected
Table 1: Information about kainic acid injections into the right superior olivary region.
Tissue processing
The rats were euthanized by rapid decapitation 7 days after kainic acid injection. Brain stems with attached cerebellum, cut into left and right halves, and temporal bones containing the cochleas were isolated, trimmed, and frozen within 30 minutes in Freon (Freeze-it) cooled to its freezing point (-130°C) with liquid nitrogen.
Microdissection of samples and chemical assays were done in the same way as in our other studies [15,26,28-30]. Left and right brain pieces were sectioned transversely at 20 µm thickness in a cryostat at -20°C, and sections were saved in 3 alternating groups: every third section was either stained with thionin to reveal Nissl substance, stained for AChE activity [15,31,32], or placed in an aluminum tissue rack for freeze-drying [33]. Freeze-dried sections were stored under vacuum at -20°C. Temporal bones were freeze-dried for 3 days and then stored under vacuum at -20°C.
Brainstem samples for assay were obtained by microdissecting freeze-dried sections on the stage of a Wild dissecting microscope at 25X magnification, using hand-made dissecting tools [33]. A drawing tube attached to the microscope was used to record all sample locations in a map of the dissected region of each microdissected section [28]. Samples of cochlear tissue were removed from pieces of freeze-dried cochlea in the same way as previously reported [29]. Samples were weighed on quartz-fiber microbalances [33]. Brain sample weights ranged from 0.07 to 1.5 µg.
Brainstem regions sampled included the most prominent nuclei of the rat superior olivary complex: lateral superior olivary nucleus (LSO), medial nucleus of the trapezoid body (MNTB), and ventral nucleus of the trapezoid body (VNTB). Other superior olivary samples were grouped into dorsal and ventral portions of periolivary regions and the ventralmost periolivary region containing the fibers of the trapezoid body. The superior paraolivary nucleus [14,34] was not specifically sampled but was included among the dorsal periolivary samples. The medial superior olivary nucleus, which is very small in rats [34], was not specifically sampled. Also sampled were the rostral portion of the anteroventral cochlear nucleus (AVCN), its overlying granular region, and the lateral portion of the trapezoid body medial to it; the dorsal and posteroventral cochlear nuclei of rat 22581; the centrifugal labyrinthine bundle, containing predominantly (roughly three-fourths) the olivocochlear bundle but also centrifugal vestibular fibers [35]; and the facial nucleus and nerve root.
Assays
Sample dry weights per volume were determined by dividing the weight of each sample by its volume. Sample volumes were measured by importing microdissection maps into Neurolucida software, which calculated areas of samples or groups of samples whose boundaries were traced, then multiplying by the 20 µm section thickness. Errors could result from any variations in section thickness.
ChAT activities were measured by incubating samples for 30 min at 38°C in 400 µl-capacity microtubes with 5 µl of sodium-phosphate-buffered medium (90 mM, pH 7.4) containing 80 µM [14C]acetyl coenzyme A, 6 mM choline chloride, 0.1 mM neostigmine methyl sulfate, 0.1 % (w/v) bovine serum albumin, 0.1 % (v/v) Triton X-100, and 0.3 M sodium chloride. Product [14C]acetylcholine was extracted into 3-heptanone containing 15 mg/ml sodium tetraphenyl boron. The heptanone layer was washed with 10 mM sodium phosphate buffer containing 0.5 mg/ml tetraphenyl boron to eliminate a tissue blank, then an aliquot of the heptanone layer was added to a vial containing a 2:1 ‘Scintilene’/’Scintiverse’ cocktail for scintillation counting [30,36].
AChE activities were measured by incubating samples for 30 min at 38°C in 400 µl-capacity microtubes with 10 µl of potassium phosphate-buffered medium (100 mM, pH 7.4) containing 0.6 mM [14C]acetylcholine, 0.01 mM tetraisopropylpyrophosphoramide, 0.1 % (w/v) bovine serum albumin, and 0.1 % (v/v) Triton X-100. The reaction was stopped by adding 1 µl of 1 N hydrochloric acid, product [14C] acetate extracted into ethyl acetate, and an aliquot of the ethyl acetate layer added to a vial containing a 2:1 ‘Scintilene’/’Scintiverse’ cocktail for scintillation counting [30].
MDH activities were measured by incubating samples at room temperature in 10 x 75 mm glass tubes containing 1 ml of Tris HCl-buffered medium (100 mM, pH 8.5) containing 19 mM sodium malate, 1 mM nicotinamide adenine dinucleotide (NAD), and 0.02 % (w/v) bovine serum albumin. Formation of reduced NAD (NADH) product was measured at 0, 15, and 30 min via a Farrand Ratio Fluorometer. Data were all converted from the values measured at room temperature, which varied from 24 to 25°C, to a 25°C basis by using correction factors determined for whole brain homogenate [30].
MATERIALS
‘Freeze-it’ was obtained from Curtin-Matheson. Aluminum racks for storing freeze-dried sections, microdissection tools, and micropipets for use in the assays were made in the lab as needed [33]. Vacuum tubes were obtained from Ace Glass, Inc., Vineland, NJ. Neurolucida software was obtained from MicroBrightfield (MBF Bioscience, Williston, VT). For the radiometric assays, the [14C]-labeled substrates and also products, used for measuring product recovery in the extractions, were obtained from New England Nuclear, Boston, MA, and Amersham-Searle, Arlington Heights, IL. Microtubes (400 ml-capacity) were obtained from Bio-Rad. Other chemicals and supplies were obtained from Sigma or Fisher.
Data analysis
Enzyme activities are expressed as µmol/kg dry wt/min for ChAT, mmol/kg dry wt/min for AChE, and mol/kg dry wt/hr for MDH. Data are presented as mean±standard error of the mean (SEM), with number of measurements. Statistical significance was evaluated using two-tailed t-tests, with levels of significance shown by p values for cases where p < 0.05.
RESULTS
Injection locations and extents
The damage resulting from the kainic acid injections included two components. The more obvious damage appeared as areas of gliosis in Nissl-stained sections and decreased staining in AChE-stained sections (Figure 1). Beyond this damage, there was loss of neuron somata in some locations. Within the superior olivary complex, Nissl-stained somata appeared to be absent from the injected-side LSO, whereas the MNTB and VNTB were not as obviously affected. Staining for AChE activity, which was darker medially than laterally in the contralateral LSO, was reduced on the injected side, whereas staining in the VNTB, which showed relatively dark staining, and in the MNTB, which showed only very light staining, showed no obvious differences between sides. In periolivary regions, Nissl-stained somata appeared less prevalent in the dorsal portions of rats 22581 and 22681C on the injected side as compared to contralateral.
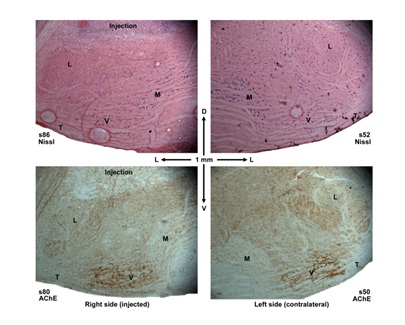 Figure 1: Photomicrographs of transverse sections containing the superior olivary complex stained for Nissl substance and for acetylcholinesterase (AChE) activity. The sections are from rat 22681C. The right side, injected with kainic acid, is shown on the left and the left uninjected side on the right. The injection appears as a region of gliosis in the Nissl stain and as a light area in the AChE stain. The 1 mm scale also shows dorsal (D), ventral (V), and lateral (L) directions. Regional abbreviations are L, lateral superior olivary nucleus; M, medial nucleus of the trapezoid body; T, trapezoid body; V, ventral nucleus of the trapezoid body. The medial portion of the ventral nucleus of the trapezoid body appears slightly lighter than the lateral portion in the sections stained for AChE activity.
The exact location and extent of the region lesioned by the kainic acid injection, as assessed by gliosis in the Nissl-stained sections, varied among the 4 rats (Figure 2). The region of gliosis was much smaller in rat 22681A than in the other rats. The lesion extent was included within the saved sections for rat 22681C but extended beyond them for the other 3 rats. For rat 22581, the lesioned area was well represented in sections from 0.3 mm caudal to beyond 0.9 mm rostral to that shown in figure 2. In sections 0.3-0.6 mm rostral to that of figure 2, the gliotic damage approached the ventral surface of the brain. For rat 22681A, the small lesioned area was seen in sections extending from 0.4 mm caudal to beyond 1.2 mm rostral to that shown in figure 2. For rat 22681B, the lesioned area was well represented in sections from 0.5 mm caudal to beyond 1.0 mm rostral to that shown in figure 2. It was more laterally located than those in the other rats. For rat 22681C, the lesioned area was well represented in sections from 0.5 mm caudal to 1.6 mm rostral to that shown in figure 2.
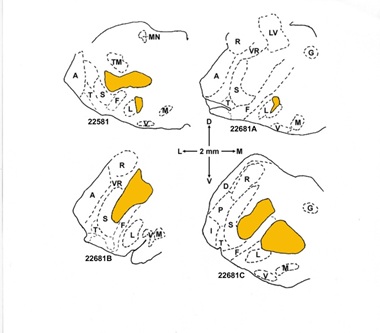 Figure 2: Tracings of lesion extents in the brainstem portions of transverse sections containing the superior olivary complex at the locations where dissections were done for chemical measurements. The directly lesioned area, seen as gliosis in Nissl-stained sections, is outlined and shaded in yellow. Regional boundaries are based on the Nissl-stained sections and the nearby sections stained for AChE activity: sections 125 and 127 for rat 22581, 60 and 62 for rat 22681A, 113 and 115 for rat 22681B (in which the brainstem had some distortion), and 80 and 82 for rat 22681C. The 2-mm directional scale shows dorsal (D), ventral (V), lateral (L), and medial (M) directions. Regional abbreviations are: A, anteroventral cochlear nucleus; D, dorsal cochlear nucleus; F, facial nerve root, extending in some sections to facial nerve beyond dash line; G, facial genu; I, interstitial nucleus (auditory nerve root); L, lateral superior olivary nucleus; LV, lateral vestibular nucleus; M, medial nucleus of the trapezoid body; MN, mesencephalic trigeminal nucleus; P, posteroventral cochlear nucleus; R, restiform body (inferior cerebellar peduncle); S, spinal trigeminal tract; T, trapezoid body; TM, trigeminal motor nucleus; V, ventral nucleus of the trapezoid body; VR, vestibular nerve root.
Injection effects on tissue density
Tissue density, expressed as dry weight per volume, measured in the major superior olivary nuclei, was not clearly affected by the kainic acid injections except in the one case where the gliosis resulting from the injection encroached on the medial portion of the LSO, in rat 22581 (Figure 2). In that case, the dry weight/volume was reduced on the right, injected, side, compared to contralateral, and also as compared to the lateral portion of the LSO on the same side (Table 2). Otherwise, there was some tendency, which did not reach statistical significance, for dry weight per volume to perhaps be slightly higher in injected-side superior olivary regions. The overall slightly higher dry weight per volume values in the VNTB compared to the other nuclei reflect a larger proportion of myelinated trapezoid body fibers in this more ventrally located nucleus.
|
Rat |
LSO lateral |
LSO medial |
MNTB |
VNTB |
|
22581 L |
367±11 (3) |
338±27 (3) |
364±25 (3) |
398±20 (3) |
|
R |
342±17 (3) |
251±9 (3)+ |
337±18 (3) |
415±13 (3) |
|
22681A L |
330 ±39 (3) |
300±20 (3) |
323±8 (3) |
402 ±27 (3) |
|
R |
392±34 (3) |
388±42 (3) |
353±38 (3) |
428±55 (3) |
|
22681B L |
361±12 (3) |
353±20 (3) |
376±27 (3) |
401±4 (3) |
|
R |
376±9 (3) |
366±15 (3) |
353±13 (3) |
394±22 (3) |
|
22681C L |
335±9 (3) |
323±16 (3) |
344±16 (3) |
353±18 (3) |
|
R |
391±31 (3) |
367±22 (3) |
410±27 (3) |
430±33 (3) |
|
Total L |
348±9 (4) |
325±15 (3)b |
352±12 (4) |
389±12 (4) |
|
R |
375±12 (4) |
374±7 (3)b |
363±16 (4) |
417±8 (4) |
aData for left (L) and right (R) regions are shown for each rat, as well as for all 4 rats totaled, as mean ±SEM (number of measurements for individual rats or number of rats for totals). Units are grams dry weight per liter. Symbol for statistical significance of comparison to contralateral is + for p < 0.05.
bData for rat 22581 not included.
Table 2: Effects of right-side kainic acid injection on superior olive dry weight/volumea.
Injection effects on superior olivary chemistry
Microdissected areas included the LSO, MNTB, VNTB, and adjoining superior olivary regions (Figure 3). In rat 22681C, activities of ChAT were slightly lower in the injected-side LSO as compared to contralateral, whereas activities of AChE and MDH were distinctly lower throughout the injected side superior olivary complex except for the most ventral portion containing the trapezoid body fibers.
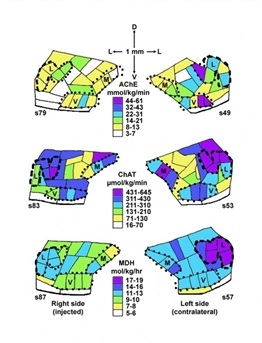 Figure 3: Distributions of enzyme activities in microdissected sections of right (side into which kainic acid was injected) and left (contralateral) superior olivary complex of rat 22681C. Enzyme activities shown are acetylcholinesterase (AChE), choline acetyltransferase (ChAT), and malate dehydrogenase (MDH). Activities are color coded as indicated. Section numbers are shown below ventrolateral boundary of each section. Directional scale at top shows dorsal (D), ventral (V), and lateral (L) directions (the medial side of each section is toward the center of the figure). Regional abbreviations are: L, lateral superior olivary nucleus; M, medial nucleus of the trapezoid body; V, ventral nucleus of the trapezoid body. The rest of the area not included in these nuclei is referred to in table 2 as periolivary region, divided arbitrarily into dorsal and ventral portions, with also trapezoid body fibers included in the most ventral part, represented in the two samples next to the ventral border of each section.
Averaged values for the major superior olivary nuclei and periolivary locations of the 4 rats are shown in table 3. Small decreases of average ChAT activity were measured in the injected-side LSO of all 4 rats, but the differences between injected-side and contralateral ChAT activities reached statistical significance only for the totaled data, which showed an overall 29 % decrease in the injected-side LSO. By contrast, decreases of AChE activity on the injected side were widespread and much larger, with overall 56 % decrease in LSO, 28 % in MNTB, 40 % in VNTB, 38 % in dorsal periolivary, and 50 % in ventral periolivary. Smaller but statistically significant decreases of MDH activity occurred in the injected-side LSO and ventralmost periolivary region: overall decreases were 35 % in LSO and 15 % in ventralmost periolivary.
|
Rat |
LSO |
MNTB |
VNTB |
Dorsal PO |
Ventral PO |
PO-TB |
|
Choline acetyltransferase (µmol/kg dry wt/min), mean±SEM (no. samples) |
||||||
|
22581 L |
553±65 (5) |
130 (2) |
309±34 (3) |
272±82 (6) |
104±13 (9) |
105 (1) |
|
R |
371±43 (5) |
190±21 (3) |
214±68 (3) |
189±40 (5) |
135±35 (9) |
67 (1) |
|
22681AL |
478±81 (6) |
235 (2) |
302±31 (4) |
166±50 (3) |
143±30 (8) |
135±46 (3) |
|
R |
387±55 (6) |
197±42 (4) |
386±22 (4) |
107±31 (6) |
145±10 (5) |
161±105 (3) |
|
22681BL |
708±96 (5) |
383±68 (3) |
506±74 (4) |
342±88 (7) |
212±42 (4) |
148 (2) |
|
R |
474±75 (5) |
189±15 (3) |
419±64 (4) |
247±54 (7) |
203±36 (4) |
67 (2) |
|
22681CL |
499±63 (5) |
361±55 (3) |
350±43 (4) |
216±75 (5) |
126±24 (5) |
39 (2) |
|
R |
352±49 (5) |
260±74 (3) |
283±35 (4) |
245±73 (7) |
266±66 (3) |
46 (2) |
|
Total L |
560±52 (4) |
277±59 (4) |
367±48 (4) |
249±38 (4) |
146±23 (4) |
107±24 (4) |
|
R |
396±27 (4)+ |
209±17 (4) |
325±47 (4) |
197±33 (4) |
187±30 (4) |
85±26 (4) |
|
Acetylcholinesterase (mmol/kg dry wt/min), mean±SEM (no. samples) |
||||||
|
22581 L |
30.6±3.6 (5) |
19.4±1.2 (3) |
38.1±7.6 (3) |
33.3±1.9 (5) |
16.8±3.7 (3) |
4.8 (1) |
|
R |
11.9±1.0 (5)* |
11.1±0.7 (4)* |
11.2±3.3 (3) |
15.9±4.4 (4)+ |
7.9±2.1 (5) |
2.8 (2) |
|
22681AL |
33.6±5.1 (5) |
16.3±1.3 (3) |
24.8±4.9 (4) |
28.3±2.3 (3) |
17.8±2.7 (5) |
5.5 (2) |
|
R |
12.6±0.7 (5)+ |
13.5±1.3 (4) |
29.5±2.8 (4) |
14.8±3.8 (3)+ |
11.7±1.6 (4) |
4.8 (2) |
|
22681BL |
25.0±2.1 (5) |
17.0±1.5 (3) |
31.1±8.4 (4) |
18.5±5.4 (4) |
15.6±3.1 (7) |
4.5 (2) |
|
R |
12.0±2.1 (5)* |
13.0 (2) |
23.0±5.1 (4) |
14.0 (1) |
5.2±1.0 (4)+ |
5.8 (2) |
|
22681CL |
26.4±7.0 (5) |
12.8±4.1 (3) |
36.5±11.6 (4) |
9.9±2.6 (3) |
16.4±3.2 (4) |
4.4 (2) |
|
R |
14.3±1.9 (5) |
9.5±0.9 (3) |
14.0±3.1 (4) |
11.1±2.4 (5) |
8.5±1.8 (6) |
4.9 (2) |
|
Total L |
28.9±2.0 (4) |
16.4±1.4 (4) |
32.6±3.0 (4) |
22.5±5.2 (4) |
16.7±0.5 (4) |
4.8±0.2 (4) |
|
R |
12.7±0.6 (4)* |
11.8±0.9 (4)+ |
19.4±4.2 (4)+ |
13.9±1.0 (4) |
8.3±1.3 (4)* |
4.6±0.6 (4) |
|
Malate dehydrogenase (mol/kg dry wt/hr), mean±SEM (no. samples) |
||||||
|
22581 L |
15.5±0.5 (5) |
10.3±0.3 (3) |
11.1 (2) |
11.2±0.9 (3) |
10.1 (2) |
6.2 (1) |
|
R |
9.3±0.2 (5)# |
9.9±0.4 (3) |
7.8 (2) |
9.4 (2) |
8.7±0.6 (3) |
|
|
22681AL |
18.0±1.6 (5) |
11.2±1.0 (3) |
9.4±0.6 (4) |
12.9±0.1 (3) |
12.6±1.0 (8) |
6.6 (2) |
|
R |
12.6±1.0 (5)+ |
11.0±0.8 (3) |
10.5±0.2 (4) |
11.0±1.0 (4) |
11.3±1.0 (6) |
5.5 (2) |
|
22681BL |
18.5±0.8 (5) |
12.3±0.8 (3) |
11.3±0.6 (4) |
13.3 (2) |
12.7±1.0 (5) |
6.5 (2) |
|
R |
12.1±0.7 (5)# |
12.3±0.4 (3) |
10.8±0.6 (4) |
12.6±1.5 (3) |
10.7 (2) |
5.5 (2) |
|
22681CL |
17.6±0.6 (5) |
13.1±0.7 (3) |
12.0 ±0.5 (4) |
13.0±0.6 (4) |
11.5±0.7 (3) |
6.6 (2) |
|
R |
11.1±0.4 (5)# |
9.8±0.7 (3)+ |
9.7±0.3 (4)* |
9.5±0.4 (4)* |
9.4±0.8 (4) |
5.5 (2) |
|
Total L |
17.4±0.7 (4) |
11.7±0.6 (4) |
10.9±0.6 (4) |
12.6±0.5 (4) |
11.7±0.6 (4) |
6.5±0.1 (4) |
|
R |
11.3±0.7 (4)# |
10.7±0.6 (4) |
9.7±0.7 (4) |
10.6±0.7 (4) |
10.0±0.6 (4) |
5.5±0.02 (3)* |
aData for left (L) and right (R) regions are shown for each rat, as mean±SEM (number of samples), as well as for all 4 rats totaled, as mean±SEM (number of rats). Regional abbreviations are: LSO, lateral superior olivary nucleus; MNTB, medial nucleus of the trapezoid body; VNTB, ventral nucleus of the trapezoid body; Dorsal PO, dorsal portion of periolivary region; Ventral PO, ventral portion of periolivary region; PO-TB, ventralmost portion of periolivary region that includes the trapezoid body. Symbols for statistical significance are + for p < 0.05, * for p < 0.01, and # for p < 0.001.
Table 3: Effects of right-side kainic acid injection on superior olive chemistrya.
Kainic acid effects on ChAT and AChE activities within the LSO were not evenly distributed, but reductions were greater in the more medial portion, so that the normally increasing lateral-to-medial gradient of these enzyme activities was eliminated (Figure 4). For MDH, the injected-side decreases were quite uniform along the lateral-to-medial axis. 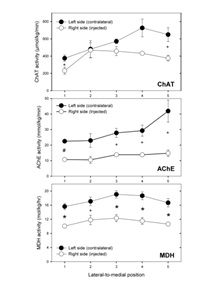 Figure 4: Plots of enzyme activity vs. lateral-to-medial location (position 1 is most lateral, 5 most medial) in injected-side and contralateral lateral superior olivary nucleus. Mean±SEM values for the 4 rats are plotted at each location. Statistically significant differences between injected and opposite sides are represented by + for p < 0.05, * for p < 0.01, and # for p < 0.001.
Kainic acid effects on VNTB chemistry included lower injected-side activities of all 3 enzymes in the 3 rats with larger regions of gliosis, but not in rat 22681A with the small region of gliosis. Although differences between injected and opposite sides did not usually reach statistical significance for individual rats because of the small numbers of samples and large variations of activity among samples, the differences were largest for the two rats in which the region of gliosis approached closest to the VNTB: rats 22581 and 22681C.
Kainic acid effects on MNTB chemistry were generally not large, although AChE activity was consistently lower on the injected side, with some statistically significant differences.
Injection effects on other brain regions and cochlea
Activities of ChAT, and in a few cases AChE, were measured in some other auditory system regions, and in the facial nerve system for comparison (Table 4). The rostral AVCN and its overlying granular region, which receive cholinergic input from the superior olivary complex [14,16,19,25], showed no differences between injected and opposite sides. The ChAT activities in rat 22581, which had a large region of gliosis that approached the ventral border of the brain in more rostral sections and came closer to the VNTB, especially its rostral portion, than the gliosis regions in the other rats, had lower ChAT activities bilaterally in AVCN and granular region than the other rats, in which the average AVCN ChAT activities were similar to control values that we have published previously [30]. Possibly, this could reflect some loss of the bilateral cholinergic projection from the VNTB to AVCN [9,19,25], although it is difficult to draw a firm conclusion from the result in this one rat. The AChE activities for either side AVCN and granular region of this rat were not lower than the previously published averages for control rats [30]. The trapezoid body, by which many cholinergic fibers reach the rat cochlear nucleus from the superior olivary complex, particularly small ChAT-positive neurons of the VNTB [19,26,37], showed no significant differences in ChAT or AChE activity between sides. A dissection of dorsal and posteroventral cochlear nucleus samples from rat 22581 also showed no statistically significant differences in ChAT activities between injected and opposite sides, although the average contralateral activity in the dorsal cochlear nucleus molecular layer was only about half the injected-side value (p = 0.07), which was not significantly different from the average for control rats [30].
|
Rat |
AVCN |
Gran-A |
TB |
CLB |
FNR |
FacN |
||
|
Choline acetyltransferase (µmol/kg dry wt/min) |
||||||||
|
22581 L |
306±21 (13) |
148±25 (6) |
101±17 (3) |
|
|
5633±633 (5) |
||
|
R |
255±17 (13) |
190±75 (3) |
175 (2) |
|
|
5316±248 (5) |
||
|
22681AL |
449±46 (8) |
385 (2) |
207±29 (3) |
6668±2269 (3) |
9508±275 (4) |
6133±349 (5) |
||
|
R |
479±55 (8) |
326 (2) |
214±43 (4) |
14737 (2) |
7933±654 (4) |
5895±369 (5) |
||
|
22681BL |
478±47 (8) |
405±69 (3) |
189±37 (3) |
11992 (2) |
10174±455 (4) |
5979±465 (5) |
||
|
R |
479±50 (8) |
305±46 (3) |
212±39 (4) |
8581±982 (3) |
8597±769 (4) |
6611±715 (5) |
||
|
22681CL |
429±42 (7) |
281±22 (3) |
149±46 (4) |
13254 (2) |
9062±284 (4) |
5593±1131 (5) |
||
|
R |
431±38 (8) |
418±68 (3) |
168±40 (4) |
9327 (2) |
7696±145 (4)+ |
7042±357 (5) |
||
|
Total L |
415±38 (4) |
305±59 (4) |
162±24 (4) |
10638±2018 (3) |
9581±323 (3) |
5835±132 (4) |
||
|
R |
411±53 (4) |
310±47 (4) |
192±12 (4) |
10882±1940 (3) |
8075±270 (3)+ |
6216±382 (4) |
||
|
Acetylcholinesterase (mmol/kg dry wt/min) |
||||||||
|
22581 L |
42.0±8.9 (8) |
71.3±5.9 (3) |
10.7±7.2 (3) |
|
|
|
||
|
R |
32.3±4.8 (7) |
61.3±13.2 (3) |
8.7±5.7 (3) |
|
|
|
||
aData for left (L) and right (R) regions are shown for each rat, as mean±SEM (number of samples), as well as for all 4 rats totaled, as mean±SEM (number of rats). Regional abbreviations are: AVCN, anteroventral cochlear nucleus, rostral portion; Gr-A,granular region adjacent to anteroventral cochlear nucleus; TB, trapezoid body adjacent to anteroventral cochlear nucleus; CLB, centrifugal labyrinthine bundle, containing olivocochlear bundle and centrifugal vestibular fibers; FNR, facial nerve root; FacN facial nucleus. Symbol for statistical significance is + for p < 0.05.
Table 4: Effects of right-side kainic acid injection on acetylcholine chemistry in other auditory and facial nerve systemsa.
The centrifugal labyrinthine bundle, containing especially olivocochlear fibers, as well as centrifugal vestibular fibers [35], was assayed for ChAT activity in 3 of the rats. Although sampling of this thin fiber bundle could not be as exact as in our previous study [15] because the sections in the present study were cut at 20 µm thickness instead of 10 µm thickness, the ChAT activities measured were overall similar to those of control rats in our previous study. No difference between sides was found when the data for all 3 rats providing samples were averaged. If only the data for rats 22681B and 22681C, wherein the lesioned area was much larger, were averaged, then the injected side ChAT activity was significantly 30 % less than the contralateral average (p < 0.005), but, in view of the difficulty of obtaining pure samples of the bundle from the 20 µm thick sections, this finding might be fortuitous.
No difference between injected and opposite sides was found for the facial nucleus ChAT activity, whose rostral limit was close to the most caudal extent of the kainate-induced lesion. However, ChAT activity was consistently lower in the facial nerve root on the injected side in the 3 rats that were sampled, and the overall 16 % lower average ChAT activity in the injected-side facial nerve root was significantly different from the contralateral average.
Only a few samples of the cochlea were obtained, from the injected side of rat 22581. Measured activities for 7 organ of Corti samples from the middle turn gave a mean±SEM ChAT activity of 4583±520 µmol/kg dry wt/min, similar to what we have measured previously for the inner hair cell region of control rats [29].
DISCUSSION
Summary of main findings
Although the number of animals used in our study was not large, many measurements were made for each rat. The results were consistent in showing kainic acid-induced decreases of the activities of the major enzymes of acetylcholine metabolism, ChAT and AChE, in the LSO, the superior olivary nucleus closest to the site of kainic acid injection, with largest effects on AChE activity and in the medial portion of the nucleus. Decreases of activity of the oxidative metabolic enzyme, MDH, were also found throughout the injected-side LSO. Decreases of AChE activity were measured in the injected-side VNTB, except in the rat with the smallest zone of kainic acid-induced direct tissue damage. Despite these changes, no clear evidence of decreased ChAT activity was found in the olivocochlear bundle or cochlea, which contain cholinergic axons and terminals deriving from the LSO and VNTB, or in the AVCN, which contains cholinergic terminals deriving from the VNTB.As discussed below, comparisons with available anatomical evidence suggest that the relative resistance of LSO and VNTB cholinergic neurons to kainic acid-induced damage correlates with relatively few glutamatergic terminals on or near their somata, since kainic acid effects are largest on neurons receiving major glutamatergic innervation.
Relation to other studies
In our preliminary interpretation of our results [24], we concluded that the kainic acid injections into the superior olivary complex did not destroy the neurons giving rise to the cholinergic projections to the cochlear nucleus or cochlea. More recent studies [9,25,38] have provided evidence that kainic acid injections into the superior olivary complex can destroy neurons that send cholinergic projections to the cochlear nucleus. The authors suggested that our different findings resulted from the kainic acid concentration used in our study being much lower than that used in theirs [9]. Re-evaluation of our study, in comparison with other studies using kainic acid, suggest an alternative explanation for the difference in reported results.
The amount of kainic acid injected in our study was within the range of amounts used in other studies and similar to most [2,6-8,10,39,40]. The study of Kraus and Illing [9] injected a higher concentration of kainic acid, but in a volume a tenth or fifth of what we used, so that the total amount of kainic acid was similar. The survival time after kainic acid injection was also longer in their study, but the differences in effects most likely result from differences in locations of the injections. Our injections produced regions of gliosis dorsal to the superior olivary complex, so that damage to neurons would result from diffusion of kainic acid ventrally into the complex. The LSO was closest to the region of gliosis, and noticeable Nissl-stained neuronal somata were absent from it in all 4 rats. Nissl-stained somata were still seen in the more ventrally located VNTB and MNTB. It is now well established that the predominant cholinergic projections to the rat cochlear nucleus derive from the VNTB [9,19,25], which is a major source of descending projections in rats [20]. Although we found indications of kainic acid effects on enzyme activities in the VNTB, these may have been insufficient to affect its cholinergic projections, except possibly in rat 22581, where the injection showed most evidence of affecting the VNTB, both in terms of the proximity of the region of gliosis and the relative decreases of enzyme activities. The study of Kraus and Illing [9] found effects on the superior olivary influences upon the ventral cochlear nucleus only in the few cases in which kainic acid injection resulted in major damage to the contralateral VNTB.
Effects of kainic acid on LSO and VNTB neurons
Although there was clear evidence of kainic acid effects on the LSO, there was little evidence of an effect on its cholinergic projection via the lateral component of the olivocochlear bundle to the ipsilateral cochlea [17,41]. The ChAT activities measured for organ of Corti samples were not lower than those measured in control rats [29], and ChAT activities in the centrifugal labyrinthine bundle, which contains predominantly olivocochlear fibers, were not clearly reduced from those measured in control rats [15]. Closer inspection of the sections stained for AChE activity revealed some small AChE-positive spots in the LSO (Figure 5). The maximal diameter of 15 of these spots measured, as mean±SEM, 8.3±2.1 µm. This value is similar to the average diameter of ChAT-immunoreactive small LSO neuron somata, considered to correspond to lateral olivocochlear neurons, in our previous study in rats [37] and the values reported for rats by some others [9,14]. The relatively light staining of these somata for AChE activity agrees with previous reports that they stain less densely than the somata of neurons in the VNTB (medial olivocochlear neurons) whose axons comprise the medial component of the olivocochlear bundle [14,41]. Survival of at least some of the lateral olivocochlear neurons after kainic acid injection was also reported by Kraus and Illing [9]. The AChE-positive processes in the LSO, which appear lighter in the injected-side LSO than contralaterally, may be related to the small AChE-positive neuron somata since no other AChE-positive neurons have been reported to be associated with the LSO and since such numerous AChE-positive processes are not seen in the LSO of the cat (personal observations), wherein the lateral olivocochlear neurons have their somata outside the LSO [17,35]. The small effect of kainic acid on the ChAT activity of the rat LSO in our study contrasts with the approximately 65-80 % reduction in ChAT activity of the rat striatum injected with a similar amount of kainic acid [1-3,39]. The difference in kainic acid effect on the predominant larger LSO neurons and the smaller lateral olivocochlear neurons likely results from their different innervations. The larger neurons, which mainly include the principal cells of the nucleus, receive their major innervation from the ipsilateral cochlear nucleus by pathways with large terminals that probably use glutamate as neurotransmitter [11,42,43]. Synaptic terminals on the lateral olivocochlear neurons may use serotonin and norepinephrine as neurotransmitters [13,44,45] as well as glutamate and glycine [46]. The glutamatergic terminals may be associated with projections from the posteroventral cochlear nucleus [47] and locations peripheral to the main body of the AVCN, termed the marginal shell [48], and appear to be mostly located at some distance from the somata [17,47-49], consistent with their relatively slow kinetics [46]. Kainic acid, as an analog and agonist of glutamate, is known to preferentially affect neurons receiving significant glutamatergic synaptic input [1,3,5-6,50]. In the LSO, the principal neurons receive such significant glutamatergic input, but the lateral olivocochlear neurons do not, so that they would be more resistant to kainic acid effects. Although we found some effect on the chemistry related to them, it appears to be incomplete.
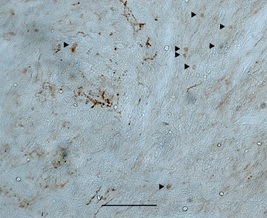 Figure 5: Higher magnification view of the medial part of the right (injected side) lateral superior olivary nucleus of rat 22681C. Some AChE-positive spots, considered to be neuronal somata, are indicated by black triangles to their left. Scale bar represents 100 µm. Dorsal is up, medial to the right.
Besides serotonergic and noradrenergic input [13,44,45], medial olivocochlear neurons of the rat VNTB likely receive more glutamatergic input from cochlear nucleus neurons than lateral olivocochlear neurons [10,13,47-48,51,52]. They may therefore be more susceptible to effects of kainic acid than lateral olivocochlear neurons, so that an injection closer to the VNTB and with a higher concentration of kainic acid than used in our study may damage them enough to affect their projection to the cochlear nucleus. In the study of Kraus and Illing [9], an effect only on the contralateral cochlear nucleus was obtained with a unilateral injection. An effect on the cochlear nucleus ipsilateral to kainic acid injection was obtained only in combination with a contralateral injection [9].
The larger effects of the kainic acid injections on AChE activity as compared to ChAT activity are not readily explained with currently available information, but they could represent some postsynaptic AChE activity in the larger neurons that are more strongly affected by kainic acid. If so, then this would imply that the superior olivary cholinergic neurons may provide collaterals to these larger neurons in addition to their centrifugal projections. The effects of kainic acid on MDH activity should especially reflect its effects on the larger neurons, particularly those of the LSO, consistent with the similar reductions of MDH activity across the lateral-to-medial axis of the LSO.
Effects of kainic acid on fiber tracts
It has generally been considered that kainic acid does not damage nerve fiber tracts [2,4,7-8], but there is some evidence for such effects [40,53]. Our results for the facial nerve root suggest that there may be a small effect of the locally injected kainic acid on the ChAT activity of the nearby facial nerve root. The region of gliosis came very close, and in some rats (22681B and C, Figure 2) the facial nerve root was seen to pass directly through it. The 16 % reduction of ChAT activity in the facial nerve root did not appear to result from damage to facial nucleus neuron somata because the rostral border of the facial nucleus was slightly caudal to the caudal extent of the region of gliosis, and there was no difference in facial nucleus ChAT activity between injected and opposite sides.
Functional considerations
There has been considerable evidence for a modulatory role of cholinergic centrifugal innervation of the cochlear nucleus [22]. More recently, evidence has been presented for increased ChAT activity [54] and immunoreactivity [25] in the rat cochlear nucleus after loss of its auditory nerve innervation, as well as changes in acetylcholine receptors [55]. The changes in ChAT immunoreactivity have been associated with formation of new synapses by cholinergic innervation deriving from the VNTB [9,25], which has been proposed to provide some compensation for the loss of the auditory nerve input [38]. Increases of cochlear nucleus ChAT activity have also been measured after cochlear damage resulting from intense tone exposure in hamsters, which may be related to development of tinnitus [56,57]. These and other recent findings [58] suggest that the cholinergic projections from the superior olivary region to the cochlear nucleus are likely to have an important role in hearing and hearing disorders.
CONCLUSION
In conclusion, the results of our study are actually quite compatible with those of Kraus and Illing [9], in that removal of superior olivary cholinergic projections to the ventral cochlear nucleus can be accomplished only by major damage to the VNTB. The results of both studies are consistent with the evidence that kainic acid has its strongest effects on neurons that receive prominent glutamatergic innervation onto or near their somata [1,3,5,6,50]. Our results additionally show that kainic acid may affect the chemistry of regions containing neuron somata and fiber tracts even when there is no obvious histological evidence for effects.
ACKNOWLEDGEMENTS
Support for this research was provided by National Institutes of Health grant NS17176, Oral Roberts University intramural funds, and the University of Toledo Foundation.
REFERENCES
- McGeer EG, McGeer PL (1976) Duplication of biochemical changes of Huntington’s chorea by instrastriatal injections of glutamic and kainic acids. Nature 263: 517-519.
- Schwarcz R, Coyle JT (1977) Striatal lesions with kainic acid: neurochemical characteristics. Brain Res 127: 235-249.
- Campochiaro P, Coyle JT (1978) Ontogenetic development of kainate neurotoxicity: Correlates with glutamatergic innervation. Proc Natl Acad Sci USA 75: 2025-2029.
- Britt MD, Wise RA (1981) Kainic acid spares fibers of the dorsal noradrenergic bundle. Brain Res Bull 7: 437-440.
- Garthwaite J, Garthwaite G (1983) The mechanism of kainic acid neurotoxicity. Nature 305: 138-140.
- Bird SJ, Gulley RL, Wenthold RJ (1978) Kainic acid injections result in degeneration of cochlear nucleus cells innervated by the auditory nerve. Science 202: 1087-1089.
- Masterton RB, Glendenning KK, Hutson KA (1979) Preservation of trapezoid body fibers after biochemical ablation of superior olives with kainic acid. Brain Res 173: 156-159.
- Van Adel BA, Kelly JB (1998) Kainic acid lesions of the superior olivary complex: effects on sound localization by the albino rat. Behav Neurosci 112: 432-446.
- Kraus KS, Illing R-B (2004) Superior olivary contributions to auditory system plasticity: medial but not lateral olivocochlear neurons are the source of cochleotomy-induced GAP-43 expression in the ventral cochlear nucleus. J Comp Neurol 475: 374-390.
- DeVenecia RK, Liberman MC, Guinan JJJr, Brown MC (2005) Medial olivocochlear reflex interneurons are located in the posteroventral cochlear nucleus: a kainic acid lesion study in guinea pigs. J Comp Neurol 487: 345-360.
- Helfert RH, Snead CR, Altschuler RA (1991) The ascending auditory pathways. In: RA Altschuler, RP Bobbin, BM Clopton, DW Hoffman (eds.) Neurobiology of Hearing: The Central Auditory System. Raven Press, New York, USA, pp 1-25.
- Tsuchitani C, Johnson DH (1991) Binaural cues and signal processing in the superior olivary complex. In: RA Altschuler, RP Bobbin, BM Clopton, DW Hoffman (eds.) Neurobiology of Hearing: The Central Auditory System. Raven Press, New York, USA, pp 163-193.
- Thompson AM, Schofield BR (2000) Afferent projections of the superior olivary complex. Microsc Res Tech 51: 330-354.
- Osen KK, Mugnaini E, Dahl A-L, Christiansen AH (1984) Histochemical localization of acetylcholinesterase in the cochlear and superior olivary nuclei. A reappraisal with emphasis on the cochlear granule cell system. Archiv Ital Biol 122: 169-212.
- Godfrey DA, Park JL, Ross CD (1984) Choline acetyltransferase and acetylcholinesterase in centrifugal labyrinthine bundles of rats. Hear Res 14: 93-106.
- Godfrey DA, Park-Hellendall JL, Dunn JD, Ross CD (1987) Effects of trapezoid body and superior olive lesions on choline acetyltransferase activity in the rat cochlear nucleus. Hear Res 28: 253-270.
- Warr WB, Guinan JJJr, White JS (1986) Organization of the efferent fibers: the lateral and medial olivocochlear systems. In: RA Altschuler, DW Hoffman, RP Bobbin (eds.) Neurobiology of Hearing: The Cochlea. Raven Press, New York, USA, pp 333-348.
- Spangler KM, Warr WB (1991) The descending auditory system. In: RA Altschuler, RP Bobbin, BM Clopton, DW Hoffman (eds.) Neurobiology of Hearing: The Central Auditory System. Raven Press, New York, USA, pp 27-45.
- Sherriff FE, Henderson Z (1994) Cholinergic neurons in the ventral trapezoid nucleus project to the cochlear nuclei in the rat. Neuroscience 58: 627-633.
- Warr WB, Beck JE (1996) Multiple projections from the ventral nucleus of the trapezoid body in the rat. Hear Res 93: 83-101.
- Mellott JG, Motts SD, Schofield BR (2011) Multiple origins of cholinergic innervation of the cochlear nucleus. Neuroscience 180: 138-147.
- Godfrey DA, Park JL, Dunn JD, Ross CD (1985) Cholinergic neurotransmission in the cochlear nucleus. In: DG Drescher (ed.) Auditory Biochemistry. Charles C Thomas, Springfield, IL, USA, pp 163-183.
- Lehninger AL (1975) Biochemistry. (2nd edn), Worth Publishers, New York, USA.
- Godfrey DA, Park JL, Dunn JD, Ross CD (1983) Effects of kainic acid on the superior olivary complex of the rat. Soc Neurosci Abstr 9: 211.
- Meidinger MA, Hildebrandt-Schoenfeld H, Illing R-B (2006) Cochlear damage induces GAP-43 expression in cholinergic synapses of the cochlear nucleus in the adult rat: a light and electron microscopic study. Eur J Neurosci 23: 3187-3199.
- Linker LA, Carlson L, Godfrey DA, Parli JA, Ross CD (2018) Quantitative distribution of choline acetyltransferase activity in rat trapezoid body. Hear Res 370: 264-271.
- Paxinos G, Watson C (1982) The Rat Brain in Stereotaxic Coordinates. Academic Press, New York, USA.
- Godfrey DA, Matschinsky FM (1976) Approach to three-dimensional mapping of quantitative histochemical measurements applied to studies of the cochlear nucleus. J Histochem Cytochem 24: 697-712.
- Godfrey DA, Ross CD (1985) Enzymes of acetylcholine metabolism in the rat cochlea. Ann Otol Rhinol Laryngol 94: 409-414.
- Godfrey DA, Park JL, Rabe JR, Dunn JD, Ross CD (1983) Effects of large brain stem lesions on the cholinergic system in the rat cochlear nucleus. Hear Res 11: 133-156.
- Karnovsky MJ, Roots L (1964) A ‘direct coloring’ thiocholine method for cholinesterases. J Histochem Cytochem 12: 219-221.
- El-Badawi A, Schenk EA (1967) Histochemical methods for separate, consecutive and simultaneous demonstration of acetylcholinesterase and norepinephrine in cryostat sections. J Histochem Cytochem 15: 580-588.
- Lowry OH, Passonneau JV (1972) A Flexible System of Enzymatic Analysis. Academic Press, New York, USA.
- Harrison JM, Warr WB (1962) A study of the cochlear nuclei and ascending auditory pathways of the medulla. J Comp Neurol 119: 341-380.
- Warr WB (1975) Olivocochlear and vestibular efferent neurons of the feline brain stem: their location, morphology and number determined by retrograde axonal transport and acetylcholinesterase histochemistry. J Comp Neurol 161: 159-181.
- Fonnum F (1969) Radiochemical micro assays for the determination of choline acetyltransferase and acetylcholinesterase activities. Biochem J 115: 465-472.
- Yao W, Godfrey DA (1998) Immunohistochemical evaluation of cholinergic neurons in the rat superior olivary complex. Microsc Res Tech 41: 270-283.
- Illing R-B, Kraus KS, Meidinger MA (2005) Reconnecting neuronal networks in the auditory brainstem following unilateral deafening. Hear Res 206: 185-199.
- Friedle NM, Kelly PH, Moore KE (1978) Regional brain atrophy and reductions in glutamate release and uptake after intrastriatal kainic acid. Br J Pharmac 63: 151-158.
- Wuerthele SM, Lovell KL, Jones MZ, Moore KE (1978) A histological study of kainic acid-induced lesions in the rat brain. Brain Res 149: 489-497.
- White JS, Warr WB (1983) The dual origins of the olivocochlear bundle in the albino rat. J Comp Neurol 219: 203-214.
- Godfrey DA, Parli JA, Dunn JD, Ross CD (1988) Neurotransmitter microchemistry of the cochlear nucleus and superior olivary complex. In: J Syka, RB Masterton (eds.) Auditory Pathway: Structure and Function. Plenum Publishing Corporation, New York, USA, pp 107-121.
- Caspary DM, Faingold CL (1989) Non-N-methyl-d-aspartate receptors may mediate ipsilateral excitation at lateral superior olivary synapses. Brain Res 503: 83-90.
- Thompson AM, Thompson GC (1995) Light microscopic evidence of serotoninergic projections to olivocochlear neurons in the bush baby (Otolemur garnettii). Brain Res 695: 263-266.
- Woods CI, Azeredo WJ (1999) Noradrenergic and serotonergic projections to the superior olive: potential for modulation of olivocochlear neurons. Brain Res 836: 9-18.
- Sterenborg JC, Pilati N, Sheridan CJ, Uchitel OD, Forsythe ID, et al. (2010) Lateral olivocochlear (LOC) neurons of the mouse LSO receive excitatory and inhibitory synaptic inputs with slower kinetics than LSO principal neurons. Hear Res 270: 119-126.
- Thompson AM, Thompson GC (1991) Posteroventral cochlear nucleus projections to olivocochlear neurons. J Comp Neurol 303: 267-285.
- Ye Y, Machado DG, Kim DO (2000) Projection of the marginal shell of the anteroventral cochlear nucleus to olivocochlear neurons in the cat. J Comp Neurol 420: 127-138.
- White JS (1983) Fine structure of the lateral superior olivary nucleus in the albino rat. Soc Neurosci Abstr 9: 765.
- Herndon RM, Coyle JT (1977) Selective destruction of neurons by a transmitter agonist. Science 198: 71-72.
- Robertson D, Winter IM (1988) Cochlear nucleus inputs to olivocochlear neurons revealed by combined anterograde and retrograde labelling in the guinea pig. Brain Res 462: 47-55.
- Benson TE, Brown MC (2006) Ultrastructure of synaptic input to medial olivocochlear neurons. J Comp Neurol 499: 244-257.
- Mason ST, Fibiger HC (1979) On the specificity of kainic acid. Science 204: 1339-1341.
- Jin YM, Godfrey DA, Sun Y (2005) Effects of cochlear ablation on choline acetyltransferase activity in the rat cochlear nucleus and superior olive. J Neurosci Res 81: 91-101.
- Jin YM, Godfrey DA (2006) Effects of cochlear ablation on muscarinic acetylcholine receptor binding in the rat cochlear nucleus. J Neurosci Res 83: 157-166.
- Jin YM, Godfrey DA, Wang J, Kaltenbach JA (2006) Effects of intense tone exposure on choline acetyltransferase activity in the hamster cochlear nucleus. Hear Res 216-217: 168-175.
- Godfrey DA, Kaltenbach JA, Chen K, Ilyas O (2013) Choline acetyltransferase activity in the hamster central auditory system and long-term effects of intense tone exposure. J Neurosci Res 91: 987-996.
- Stefanescu RA, Shore SE (2017) Muscarinic acetylcholine receptors control baseline activity and Hebbian stimulus timing-dependent plasticity in fusiform cells of the dorsal cochlear nucleus. J Neurophysiol 117: 1229-1238.
Citation: Godfrey DA, Park JL, Dunn JD, Ross CD (2020) Chemical Effects of Kainic Acid Injection into the Rat Superior Olivary Region. J Otolaryng Head Neck Surg 6: 45
Copyright: © 2020 Donald A Godfrey, et al. This is an open-access article distributed under the terms of the Creative Commons Attribution License, which permits unrestricted use, distribution, and reproduction in any medium, provided the original author and source are credited.