Comparative GC-MS, Phyto- chemical Analysis and Free Radical Scavenging activities of South Indian Rice Varieties
*Corresponding Author(s):
Bhagavathy SAssistant Professor, Department Of Biomedical Sciences, Faculty Of Biomedical Sciences And Technology, Sri Ramachandra Institute Of Higher Education And Research, Porur, Chennai, India
Tel:9445283050 / 8838510705,
Email:drbhagavathy@sriramachandra.edu.in
Abstract
Rice is major food source for most of the Asians and Africans which leads to high blood sugar level in most of the people. There are different varieties of rice categories were cultivated for the purpose of food production in India, most of the south Indian people consumes large amounts of rice-based foods in their daily diet directly or indirectly. Most of these rice varieties were rich in carbohydrate content, but nowadays some rice categories were preferred by many of the people to reduce the high carbohydrate intake and to improve other health benefits. Agricultural research works were focused on to identify the phytochemicals of these rice varieties and their mode of action on health issues. Karuppu Kavuni (KK), Mappillai Samba (MS) and Seeraga Samba (SS) are an important traditional rice variety of south India. Phytochemical screening of KK, MS and SS shows the presence of carbohydrates, alkaloids, flavonoids, terpenoids, glycoside, phenolics, phytosterols and protein. Methanolic extract of GC-MS analysis of KK, MS and SS shows the presence of important bioactive compounds such as flavones, n-hexadecanoic, elaidic acid;isopropyl ester. Out of the three tested rice samples KK showed less carbohydrate content, good free radical scavenging activity and better in antioxidant status further concluded as a better choice for daily consumption.
Keywords
Antioxidant; Free Radical; GC-MS; Karuppu Kavuni; Mapillai Samba; Seeraga Samba
Introduction
Rice is an important stable food of Asians and globally half of the human population consumes whole grain of rice in cooked form [1]. Rice occupies world’s second largest position next to corn in production. Though maize crops have been extensively cultivated and used for purpose other than human consumption, rice forms an important position contributing to human nutrition. Globally one-fifth of the calories consumed by the humans are provided by rice [2]. White rice is milled rice that had its husk, bran, and germ removed. This alters the flavour, texture and appearance of the rice and helps prevent spoilage, extend its storage life, and makes it easier to digest. After milling the rice is polished resulting in a seed with a bright, white, shiny appearance. The milling and polishing process both removes nutrients. An unbalanced diet based on unenriched white rice leaves many people vulnerable to the neurological disease beriberi, due to deficiency of thiamine. White rice is often enriched with some of the nutrients stripped from it during the process. All-natural foods, the precise nutritional composition of rice varies slightly depending on the variety, soil condition, environmental conditions, and type of fertilizers [3].
Brown rice and white rice have similar amounts of calories and carbohydrates, brown rice is a far richer source of all nutrients when compared to unenriched white rice. Brown rice is whole rice from which only the husk (outer most layer) is removed. To produce white rice, the bran layer and the germ are removed, leaving mostly the starchy endosperm. This process causes the reduction or complete depletion of several vitamins and dietary minerals. Missing nutrients such as vitamin B1, B3 and iron are sometimes added back into the white rice a process called enrichment. Even with the reduction of nutrients, unenriched white rice is still a good source of manganese and contains moderate amount of other nutrients such as pantothenic acid and selenium. Brown rice is whole grain rice with the inedible outer hull removed. White rice is the same grain without the hull, the bran layer, and the cereal germ. Red rice, gold rice, and black rice (also called purple rice) are whole rice with differently pigmented outer layers [4]. Its dark purple colour is primarily due to its anthocyanin content which is higher by weight than that of other colour grains. Black rice is a good source of protein, fibers, calcium, iron, sodium, vitamin C and A, carbohydrate, magnesium, copper, zinc, potassium, vitamin B3 and B2, flavonoids, anthocyanin and other phenolic compounds [5].
Experimental studies conducted in vivo with supplementation of coloured rice have reported reduction in oxidative stress and concurrently increased antioxidant capacity in vivo and in vitro [6]. The presence of bioactive compounds like phenolic compounds, tocopherols and oryzanols in rice related to the prevention of non-communicable diseases [7].
Methodology
Collection of O.sativa
The fresh seed samples of different varieties of Oryza sativa (O.sativa) including Karuppu Kavuni (KK), Mappillai Samba (MS), and Seeraga Samba (SS) were randomly collected from nearby organic shop. The collected seeds were cleaned with running water dried in sunlight to remove any dust particles and pulverized. The coarse powder stored in air tight container. The seed samples were pulverised into a fine powder and kept in plastic container to avoid any contaminations.
Extraction of O.sativa
The pulverised powder was soaked in solvents - Acetone, Butanol, Chloroform, Diethyl ether, Ethanol, Methanol, and Water (10g of dried powder in 100ml) and extracted for 24h at room temperature with continuous shaking. The mixture was centrifuged at 10,000rpm for 15minutes. The supernatant was stored and used for further experiments. Filtrates of the extracts were dried at 40°C. The crude extracts thus obtained was stored in an air-tight container and used for further analysis. This was subjected to the qualitative and quantitative analysis for identification of phyto constituents. 5gm of finely dried and ground seed materials were extracted using 200ml of methanol in Soxhlet apparatus. The extraction was repeated for eight cycles. The extract was filtered through Whatmann No:1 filter paper, concentrated and dried in room temperature. This extract was further used for the GC-MS analysis [8].
Qualitative phytochemical analysis
The extracts prepared were subjected to qualitative phytochemical screening [9-11] Quantitative phytochemical analysis.
Estimation of total phenolic content (TPC): The total phenolic content (TPC) of the methanol extracts of seed was determined using the method of Singleton and groups [12] with slight modifications. To 0.5ml of test sample, 1.5ml (1:10 v/v diluted with distilled water) Folin-Ciocalteau reagent was added and allowed to stand for 5min at 22ºC. After 5min, 2.0ml of 7.5% of sodium carbonate was added. These mixtures were incubated for 90min in the dark with intermittent shaking. After incubation the development of blue colour was observed. Finally, absorbance of blue colour in different samples were measured at 725nm using a UV-Visible spectrophotometer. The phenolic content was calculated as gallic acid equivalents GAE/g on the basis of standard curve of gallic acid. [6].
Estimation of total flavonoid content (TFC): The total flavonoid content (TFC) of seed extract of O.sativa was determined using the aluminium chloride assay through colorimetry [13]. An aliquot (0.5ml) of extracts were taken in different test tubes then 2ml of distilled water was added followed by the addition of 0.15ml of sodium nitrite (5% NaNO2, w/v) and allowed to stand for 6min. Later 0.15ml of aluminium trichloride (10% AlCl3) was added and incubated for 6min, followed by the addition of 2ml of sodium hydroxide (NaOH, 4% w/v) and volume was made up to 5ml with distilled water. After 15 min of incubation the mixture turns to pink, the absorbance was measured at 510nm using a colorimeter. Distilled water was used as blank. The TFC was expressed in mg of catechins equivalents per gram of extract. All the determinations were carried out three times [14].
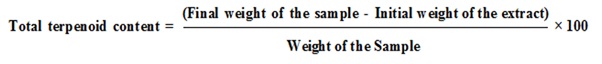
Estimation of total terpenoid content (TTC): Total terpenoid content (TTC) in the methanolic seed extracts of O.sativa were determined by the method as described by Ferguson, (1956). 1g of seed powder was taken in a conical flask and soaked in ethyl alcohol for one day. Then it was filtered, and the filtrate was extracted with petroleum ether. The ether extract was taken as the measure of total terpenoid [15].
Estimation of total protein content (TP): The total protein present in seed extract were estimated using Folin - Ciocalteau and alkaline copper reagent. The extract (0.1ml) was made up to 1ml using distilled water. It was added with 5ml of alkaline copper sulphate reagent. The solution was allowed to stand for 10 minutes after thorough mixing. Then 0.5ml of Folin - Ciocalteau reagent was added, mixed well and incubated in the dark for 30 minutes. The blue coloured solution was measured for its absorbance at 660nm [16].
Estimation of total carbohydrate content (TC): Total carbohydrate was estimated using anthrone reagent. 0.1ml of the seed extract was made up to1ml using distilled water with 4ml of anthrone reagent and heated for 8 minutes in a boiling water bath. The heated mixture was cooled rapidly. The greenish solution was measured colorimetrically at 630nm [16].
Free radical scavenging assay
DPPH assay: 0.5ml of the DPPH (2,2-diphenyl-1-picryl-hydrazyl-hydrate) radical solution was added to 2ml of the seed extract and is considered as ‘test’. 0.5ml of the DPPH radical solution was added to 2ml of ethanol and is considered as ‘control’. 2.5ml of ethanol alone serves as ‘blank’. They were vortexed and allowed to stand in a room temperature for 30 minutes. The absorbance was spectrophotometrically recorded at 517nm. The percentages of DPPH radical scavenging activity of the extracts were calculated. The results were expressed as quercetin equivalents (QE)/g of the plant material [17].
FRAP assay: Ferric Reducing Antioxidant Power Assay (FRAP) was assessed with 0.1ml of the seed extract in methanol was added to 0.9ml of 96% ethanol, 5ml of distilled water, 1.5ml of 1M hydrochloric acid, 1.5ml of 1% potassium ferricyanide, 0.5ml of 1% SDS and 0.2% ferric chloride mixture and is considered as ‘test’. The same contents were added to ‘control’ and instead of extract, 0.1ml of ethanol was added. 10ml of distilled water alone serves as ‘blank’. The content was mixed well and treated in water bath at 50oC for 20 minutes. The tubes were cooled and the increase in absorbance was read at 750nm to measure the reducing power of the extract. The results were expressed as quercetin equivalents (QE)/g of the plant material [18].
Antioxidant activity
Catalase: Catalase catalyses hydrogen peroxide to water and oxygen; the catalase activity was assessed by the reaction with dichromate in acetic acid is reduced to chromic acetate when heated in the presence of hydrogen peroxide with the formation of perchloric acid as an unstable intermediate. The chromic acetate produced was measured colorimetrically.
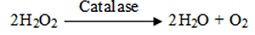
The reaction mixture contained 1.0ml of 0.01M phosphate buffer (pH 7.0), 0.1ml 1:10 diluted seed extract and 0.5ml of 2M hydrogen peroxide. The reaction was stopped by the addition of 2.0ml of dichromate acetic acid reagent (5% potassium dichromate and glacial acetic acid were mixed in 1:3 ratio). The tubes were heated in a boiling water bath for 10 minutes. After cooling the contents, the optical density was measured at 590nm. The activity was expressed as units/mg protein. One unit of enzyme activity was defined as the amount of enzyme required to decrease the absorbance by 0.5 units at 590nm [19,20].
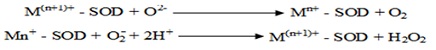
Superoxide dismutase :The SOD is a metallo protein catalysed dismutation of superoxide which may be written with the following half-reactions by lowering steady state level of O2
 where,
M = Cu (n=1); Mn (n=2); Fe (n=2); Ni (n=2).
Superoxide dismutase uses the photochemical reduction of riboflavin as oxygen generating system and catalyses the inhibition of nitro blue tetrazolium (NBT) reduction and the extent can be assayed spectrophotometrically. The SOD activity was set up with an incubation medium in a final volume 3.0ml, containing equal volume of 50mM potassium phosphate buffer pH 7.8, 45µM methionine, 5.3mM riboflavin, 84µM NBT and 20µM potassium cyanide and 0.5ml of speed extract. The tubes were placed in an aluminium foil lined box maintained at 25°C and equipped with 15W fluorescent lamp and the reduced NBT was measured spectrophotometrically at 600nm after 10 minutes exposure to light. The maximum reduction was evaluated in the absence of enzyme. The activity was expressed in units/mg protein. One unit of enzyme activity was defined as the amount of enzyme that gives 50 percent inhibition of the extent of NBT reduction [21,22].
Glutathione peroxidase: The assay method was based on the reaction of leftover glutathione after catalyzing the hydrogen peroxide conversion being allowed to react with Dithio nitrobenzoic acid (DTNB) to form a coloured complex which absorbs maximally at 412nm.
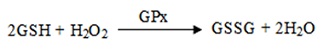
Glutathione peroxidase activity was carried out with a reaction mixture containing 0.4ml of sodium phosphate buffer (0.4M, pH 7.0); 0.1ml of 10mM sodium azide, 0.2ml of 4mM reduced glutathione, 0.5ml of speed extract, 0.5ml of 2.5mM hydrogen peroxide and the final volume was made up to 2.0ml. The tubes were incubated at 37°C for 3 minutes. The reaction was terminated by the addition of 0.5ml of 10% trichloro acetic acid. To determine the residual glutathione the supernatant was removed by centrifugation. To this 3.0ml of 0.3M disodium hydrogen phosphate and 1.0ml of Dithio nitro benzoic acid (DTNB) were added. The colour developed was read at 412nm. The GPx activity was calculated and expressed as units/mg protein. One unit of GPx activity was defined as the µg of glutathione utilized/mg protein [20,22].
GC-MS Analysis
Gas chromatography mass spectroscopy (GC-MS), a hyphenated system which is a very compatible technique and the most commonly used technique for the identification and quantification purpose. The unknown organic compounds in the complex mixture can be determined by interpretation and also by matching the spectra with reference spectra. GC-MS analysis of the methanolic seed extract of O.sativa was performed using a Perkin Elmer GC Claurus 500 system and Gas Chromatograph interfaced to a Mass Spectrometer equipped with a Elite 5MS fused silica capillary column (30 × 0.25 mm ID. ×1 Mm df, composed of 5% Diphenyl/ 95% Dimethyl poly siloxane). For GC-MS detection, an electron ionization system with ionization energy of 70 eV was used. Helium gas (99.999%) was used as the carrier gas at a constant flow rate of 1 ml/min and an injection volume of 3 Ml was employed (split ratio of 10:1). Injector temperature 250ºC; Ion-source temperature 280ºC. The oven temperature was programmed from 110°C (isothermal for 2 min) with an increase of 10 ºC/min to 200°C, then 5ºC/min to 280ºC ending with a 9 min isothermal at 280°C. Mass spectra were taken at 70 eV, a scan interval of 0.5 seconds and fragments from 45 to 450 Da. The relative percentage amount of each component was calculated by comparing its average peak area to the total areas. Software adopted to handle mass spectra and chromatograms was a Turbo Mass Ver 5.2.0. Interpretation on mass-spectrum GC-MS was conducted using the database of National Institute Standard and Technology (NIST) having more 62,000 patterns. The spectrum of the unknown components was compared with the spectrum of known components stored in the NIST library and the molecular weight and structure of the components of the test materials were ascertained [23].
Statistical analysis
The results were expressed as Mean ± SD and difference among the mean was analyzed using One-way ANOVA. The difference in values at P < 0.05 was considered statistically significant.
Results And Discussion
Qualitative phytochemical analysis
The qualitative phytochemical analysis of KK in methanol, ethanol, butanol, chloroform, acetone, diethyl ether and aqueous extract indicates the presence of various secondary metabolites such as carbohydrates, terpenoids, flavonoids, polyphenols, alkaloids, phytosterols and protein. The qualitative analysis of KK and MS in methanol, ethanol, butanol, chloroform, acetone, diethyl ether and aqueous extract confirms the presence of bioactive compounds carbohydrates, terpenoids, flavonoids, polyphenol, alkaloids, phytosteroids and cardiac glycoside. The various organic extracts and aqueous extract of SS proves the presence of phytochemicals carbohydrates, polyphenol, terpenoids, flavonoids, phytosteroids, cardiac glycoside and alkaloids. Tannins and saponins were absent in all the organic and aqueous extracts of KK, MS and SS (Table 1). The previous studies with methanolic extract of black rice indicates the presence of flavonoids, tannins, protein and polyphenols [24]. The ethanolic extract of black rice indicates the presence of carbohydrates, flavonoids, polyphenols and glycosides [25]. The aqueous extract of white rice indicates the presence of phenol, protein, flavonoids, tannin, quinones, anthraquinones, glycoside moderately [24].
|
Phytochemicals |
Acetone |
Butanol |
Chloroform |
Diethyl Ether |
Ethanol |
Methanol |
Aqueous |
||||||||||||||
|
KK |
MS |
SS |
KK |
MS |
SS |
KK |
MS |
SS |
KK |
MS |
SS |
KK |
MS |
SS |
KK |
MS |
SS |
KK |
MS |
SS |
|
|
Carbohydrate |
++ |
++ |
++ |
++ |
++ |
++ |
++ |
++ |
++ |
++ |
++ |
++ |
++ |
++ |
++ |
++ |
++ |
++ |
++ |
++ |
++ |
|
Alkaloids |
- |
- |
- |
++ |
++ |
+ |
+ |
+ |
+ |
- |
- |
- |
+ |
+ |
+ |
+ |
+ |
+ |
- |
- |
- |
|
Flavonoids |
++ |
++ |
+ |
++ |
++ |
+ |
++ |
++ |
+ |
+ |
+ |
- |
++ |
+ |
- |
++ |
+ |
+ |
+ |
+ |
- |
|
Tannin |
- |
- |
- |
- |
- |
- |
- |
- |
- |
- |
- |
- |
- |
- |
- |
- |
- |
- |
- |
- |
- |
|
Saponin |
- |
- |
- |
- |
- |
- |
- |
- |
- |
- |
- |
- |
- |
- |
- |
- |
- |
- |
- |
- |
- |
|
Terpenoids |
++ |
++ |
- |
++ |
++ |
+ |
++ |
++ |
- |
+ |
+ |
+ |
++ |
++ |
+ |
++ |
++ |
+ |
- |
- |
- |
|
Glycosides |
++ |
++ |
- |
- |
- |
- |
+ |
+ |
- |
+ |
+ |
- |
- |
- |
- |
- |
- |
- |
- |
- |
- |
|
Protein |
- |
- |
- |
- |
- |
- |
- |
- |
- |
- |
- |
- |
- |
- |
- |
- |
- |
- |
++ |
++ |
+ |
|
Phytosterols |
++ |
++ |
++ |
++ |
- |
- |
++ |
++ |
+ |
- |
- |
- |
++ |
+ |
- |
- |
- |
- |
- |
- |
- |
|
Phenols |
++ |
++ |
++ |
++ |
++ |
++ |
++ |
++ |
++ |
+ |
+ |
- |
++ |
++ |
++ |
++ |
++ |
++ |
++ |
++ |
++ |
Table 1: Qualitative Phytochemical analysis of different varieties of O. sativa.
- Negative, + Slightly Positive, ++ Strongly Positive ;
KK - Karuppu Kavuni , MS - Mappillai Samba, SS - Seeraga Samba
Quantitative phytochemical analysis
In the present study, the total phenol, flavonoid and terpenoid contents of O.sativa varieties were determined and the quantity was given in Figure 1. The total phenolic content and total flavonoid content of methanolic extract of rice varieties – KK, MS and SS were found to be significantly higher compared with standard gallic acid. Phenols and flavonoids of biogenetic origin have proven as excellent antioxidants as well as boost the activity of antioxidant enzymes and protects against oxidative stress. Hence the extract might possess anti-inflammatory, anti-allergic, anti-tumour, antibacterial, anti-fungal, and anti-thrombotic activity. The presence of terpenoids ensures that the extract might boost up the pharmacokinetic properties and also enhance the activity of phenols and flavonoids. Comparatively all the three bioactive compounds were found to be high in KK and MS than SS, which indicates the consumption of KK and MS may give better regulatory activity than SS. Protein amounts detected in raw rice samples were comparable with each other were reported on the Figure 1. Normally the O.sativa is the good choice for the nutritional carbohydrates than protein, because of their high carbohydrate content. This was observed in the present result, the total carbohydrate content was found high in SS rice sample than in KK and MS rice samples. Inversely, while comparing the protein content, the high total protein content was observed in KK and MS than SS. This finding indicates daily consumption of KK and MS may have the nutritional importance in controlling the hyperglycemic condition and further act as a good protein dietary source.
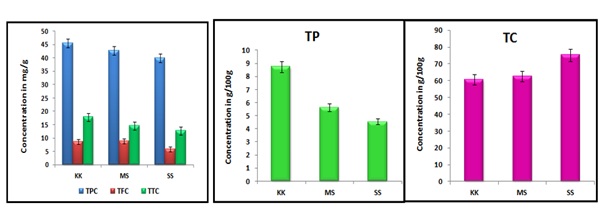 Figure 1: Quantitative Phytochemical analysis of different varieties of O. Sativa.
Values are Mean ± SD of triplicates
A study on phytonutrients in 10 popular traditional Indian rice landraces stated that total phenolic content of maaappillai samba have highest total phenol content compared to seeraga samba. A previous study conducted with various rice varieties shown that the brown rice shown high amount of total flavonoid content than white rice [12]. Another study conducted in various varieties of total flavonoid content shown that black rice and white rice results in 18mg/g [26,27]. Total protein content of black rice resulted as 9g and white rice resulted as 7g [28]. Research conducted in protein content of different java varieties of rice shown that white rice have 10g of protein, red rice have 7g of protein, black rice have 9g of protein [24]. Another study shown that white rice (polished) results in 5g, brown rice results in 8.6g, china red rice results in 9g. Parboiled rice results in 7g [29].
Free radical scavenging activity
The result of free radical scavenging activity of the tested rice varieties of O.sativa was depicted in the Figure 2. The results showed that the bioactive compounds present in the rice extract scavenge more DPPH radicals formed and induce the decolourisation of resultant mixture. The ability of rice extract to reduce more ferric to ferrous ion showed the antioxidant potential of bioactive compounds in the extract. The presence of phytochemicals especially phenols, flavonoids and terpenoids of estimated amount in the O.sativa is evident the radical scavenging potential and ensures the ability to fight against disease and might possess varying health benefits. While comparing the results of radical scavenging activities the order of scavenging effects can be indicated as KK > MS > SS. The percentage inhibition was in the order KK-81%, MS-79% and SS-72% of O.sativa at a concentration of 120μg/ml. The scavenging effect was increased with increasing concentration. This result provides a direct comparison of the antioxidant activity of quercetin standards. The effect of antioxidants on DPPH radical scavenging was thought to be due to their hydrogen donating ability. Radicals formed in the in the presence of oxygen (ROO., OH., RO., O2.-) are highly reactive species greatly differing in their lifetimes and chemical properties. Hence their direct detection is difficult. Stable radical species such as DPPH are often used for the general radical scavenging abilities of antioxidants. The difference in their scavenging capacity may be due to the existence of the bioactive compounds. Hence it is necessary to screen and isolate the biologically active pharmakon for more pharmacological benefits. Rice extracts of O.sativa displayed stronger scavenging efficiency. It can be noticed that the extracts at high concentrations showed significant decrease in the absorption of DPPH radicals when compared with reference standard. From these results this was evident that the ethanol extracts contain bioactive phytochemicals that having hydrogen donating ability and therefore the ethanol extract could serve as free radical scavengers, acting possibly as primary antioxidants. Generally, it is well known that plant phenolics are highly effective free radical scavengers and antioxidants. The reported research findings prove that the phenolics compounds and its derivatives such as phenolic acids and terpenoids were strongly correlated with antioxidants. In the present study also the significant scavenging activity of the extracts may be attributed to the presence of phenolic and flavonoid content. The results indicated that the methanolic extracts of O.sativa have significant free radical scavenging activity and thus exhibited the significant antioxidant potential.
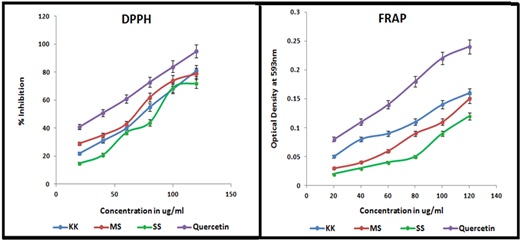 Figure 2: Free radical scavenging activity of different varieties of O. sativa.
Values are Mean ± SD of triplicates
DPPH free radical activity of three Indian medicinal rice varieties is analysed and it resulted that njavara yellow have highest DPPH free radical activity compared to other two rice njavara black and hraswa [30]. Another study based on the extract of different colour rice bran was analysed and it results that black rice bran have highest DPPH activity compared to brown and red rice bran [31,32].
Antioxidant status
The result of antioxidant status of the tested rice samples of O.sativa was given in Figure 3. From the results, it is evident that the antioxidant activity was effectively shown by all the three variant rice samples. The tested activity of Catalase, SOD and GPx showed increased activity by increased concentration (20-120μg/ml). Karuppu Kavuni and MS showed almost similar antioxidant activity comparing with SS.
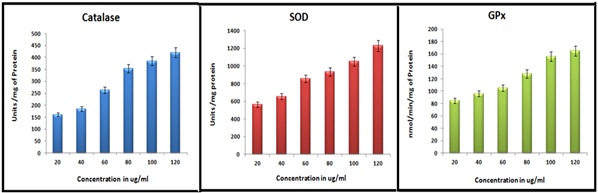 Figure 3: Antioxidant status of Methanolic Extract of Karuppu Kavuni rice.
Values are Mean±SD of triplicates
Chiang and groups [33] reported the catalytic activity of black rice and white rice extract results that black rice had stronger catalase activity followed by white rice extract. The catalase activity of raw black and white rice, pressure cooked black rice and white rice and conventionally cooked black and white rice was assayed it results that raw black rice have higher value of catalase activity followed by raw white rice. Superoxide dismutase activity of different varieties of rice was assayed and it results that KHO and MR rice have higher SOD activity and IR64 have lower SOD activity [33]. The glutathione peroxidase activity of raw black and white rice, pressure cooked black rice and white rice and conventionally cooked black and white rice was assayed it results that raw black rice have higher value of GPx activity followed by raw white rice. Pressure cooked and conventionally cooked white and black rice have less value of glutathione peroxidase activity compared to raw rice [34].
GC-MS analysis
The GC-MS chromatogram of methanol extract of KK shows 11 compounds detected was shown in Table 2 and Figure 4. The methanolic extract of KK showed the presence of major peaks and the components corresponding to the peaks were determined as follows. The results revealed that peak 1 – 1-Pentanol at the retention time 12.77, peak 2 – Nonanal at the retention time 15.05, peak 3 – Z-2-Tridecen – i-ol at the retention time 15.78 , peak 4 – Flavone at the retention time 17.03 , peak 5 – Do decenoic acid 11 oxo methyl ester at the retention time 17.27, peak 6 – 5 Hexanoic acid at the retention time 17.87, peak 7 – 2 Hepta decanol at the retention time 19, peak 8 – 3 Eicosene the retention time 19.8, peak 9 – 10, 12 Octadecadienoic acid 9 oxo at the retention time 20.58, peak 10 – Diethyl tetra decane dioate at the retention time 21.6, peak 11 – 6 methyl z 6 docosene at the retention time 23.43. The identified compounds nonanal, pentanol and flavones possess biomedical importance possess antimicrobial activity, having antioxidant properties and anti-inflammatory properties. The studies carried out by Zhang and groups [35] confirm the anti-fungal activity of nonanal. 1-pentanol possesses antioxidant role and having pharmaceutical uses. The flavones have anti-inflammatory, anti-allergic, antioxidant, antimicrobial, and anti osteoporatic activity.
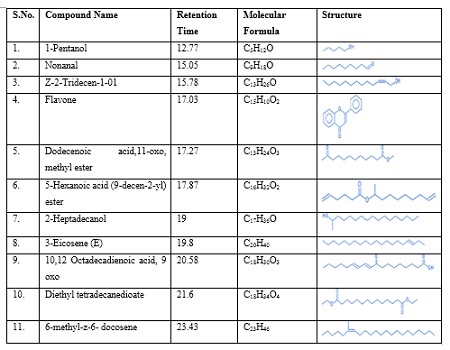 Table 2: GC – MS Analysis of Methanolic extract of Karuppu Kavuni rice.
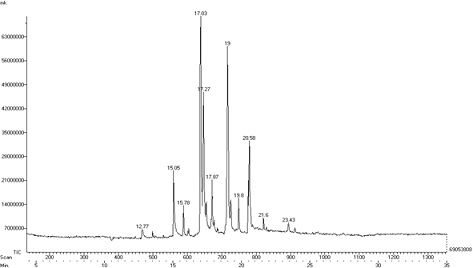 Figure 4: GC – MS Analysis of Methanolic extract of Karuppu Kavuni rice.
GC – MS Analysis of Methanolic extract of Karuppu Kavuni rice.
The GC-MS chromatogram of methanol extract of MS shows the existence of 8 compounds in the chromatogram. The results indicates that peak 1 – Heptane, 2 methyl at the retention time 12.73, peak 2 – 1,3-pentadiene,2,4 di-t-butyl at the retention time 13.28, peak 3 – Bicyclo(7.7.0) hexadec-1(9)-ene at the retention time 16.33, peak 4 - Flavone at the retention time 17.12 , peak 5 – n -hexadeconoic acid at the retention time 17.28, peak 6 – Pentadecanoic acid, 3-oxo, methyl ester at the retention time 19.0 , peak 7 – Diethyltetradecanedioate at the retention time 22.33, peak 8 – 1-Tetradecene 2 decyl at the retention time 23.43 , peak 8 – at the retention time (Table 3 and Figure 5) . The previous studies supports our present findings which indicates that the presence of the bioactive phytochemicals such as flavones, possess anti-inflammatory, anti- allergic, antioxidant, antimicrobial and anti-osteoporatic [36] and n-Hexadecanoic acid act as a good Nematicide, anti-androgenic, antioxidant, pesticide, and 5 alpha reductase inhibitor [23].
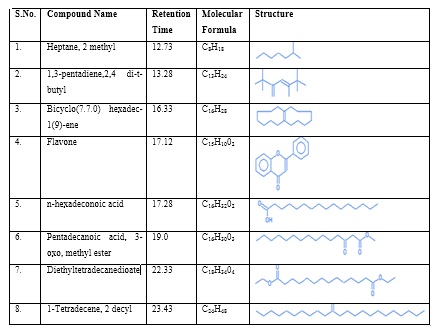 Table 3: GC – MS Analysis of Methanolic extract of Mapillai Samba rice.
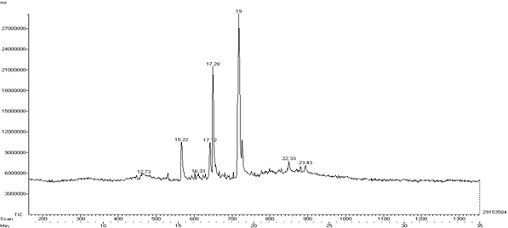 Figure 5: GC – MS Analysis of Methanolic extract of Mapillai Samba rice.
The GC-MS chromatogram of methanol extract of SS shows the existence of 12 different compounds in the chromatogram. The results indicate that peak 1- 21(H) napthalenone. Octahydro-4,4 a-dimethyl at the retention time 12.6, peak 2 - 6- Dodecenol at the retention time 13.28, peak 3 - 4- Ethylbenzonoic acid, allyl ester at the retention time 14.62, peak 4 - Flavone at the retention time 15.53, peak 5 - Dodecanoic acid, 10-methyl; methyl ester at the retention time 16.77, peak 6 - n-Hexadeconoic acid at the retention time 17.45, peak 7 - Heptadeconoic acid,9 methyl, methyl ester at the retention time 18.45, peak 8 - Oleic acid at the retention time 18.88, peak 9 - Octa decanoic acid 3 oxo methyl ester at the retention time 20.78, peak 10 - Elaidic acid;isopropyl ester at the retention time 23.76, peak 11 - 1-Tetradecene,2decyl at the retention time 25.78, peak 12 - Dodecanoic acid, undecyl ester at the retention time 31.67 (Table 4 and Figure 6) .
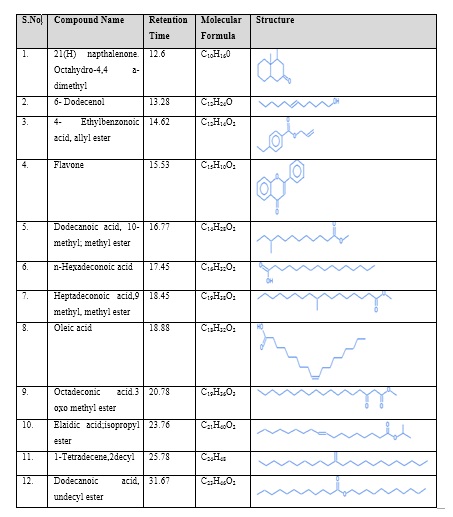 Table 4: GC – MS Analysis of Methanolic extract of Seeraga Samba rice.
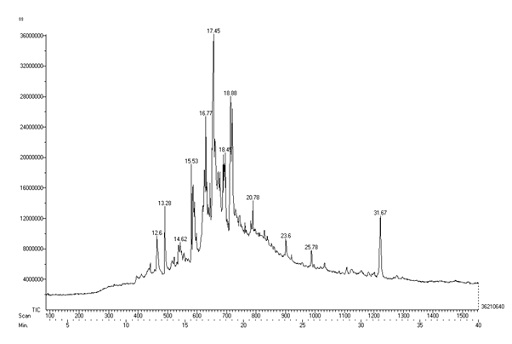 Figure 6: GC – MS Analysis of Methanolic extract of Seeraga Samba rice.
The GC-MS results of methanolic extract of SS indicates the presence of bioactive compounds Elaidic acid, isopropyl ester, Dodecanoic acid, undeyl Ester, Flavones, N-Hexadecanoic acid, all these identified compounds are considered as a bioactive compounds through various research findings - anti-inflammatory, hepta preventive, antieczemic, insecticidal activity [37], antimicrobial Activity [38], anti-inflammatory, antiallergic, antioxidant, antimicrobial, anti osteoporatic [36], Nematicide, antandrogenic, antioxidant, pesticide and 5 Alpha Reductase Inhibitor [23].
Phytochemicals are plant derived chemicals, beneficial to human health and having the capability of disease prevention. Secondary metabolites from plants are an important source of drugs since ancient times and now almost 50% of the practical drugs used are derived from natural sources. Secondary metabolites of plants like alkaloids, tannins, flavonoids, saponins, anthraquinones, cardiac glycosides and cyanogenic glycosides etc are of pivotal importance.
Conclusion
To conclude, the present work was aimed to know the beneficial effect of different rice varieties of south India in controlling the carbohydrate metabolism and the related with the existence of the phytochemicals and radical scavenging power and antioxidant capacity, to minimize the effectiveness of the disease based on the food intake. Comparison analysis was done to explore the available biomedical important compounds in the selected rice varieties. The result of the present study proves that the rice sample KK and MS are considered as a good choice in for the daily consumption possess good free radical scavenging activity and antioxidant role. Thus, consuming a diet rich in antioxidant foods will provide health protective effects application in nutritional / pharmaceutical fields, in the prevention of free radical mediated diseases like diabetes mellitus
References
- Prabha RC, Tamrakar N, Singh L, Tendon A, Sharma D (2018) Rice nutritional and medicinal properties: A review article. Journal of Pharmacology and Phytochemistry 7: 150-156.
- Gopika CM, Ravindra U (2020) Phytochemical and antioxidant capacity of traditional rice varieties of Karnataka, India. International Journal of Current Microbiology and Applied Science 9: 67-75.
- Ahmed SM, Wang P, wang N, Yang L, Xiao Z (2019) Brown rice vs White rice: Nutritional quality, potential health benefits, development of food product and preservation technologies. Comprehensive reviews in food science and food safety 18: 1070-1096.
- Upadhyay A, Karn SK (2018) Brown rice nutritional composition and health benefits. Journal Food Science Technol Nepal 10: 48-54.
- Kumar N, Murali RS (2020) Black rice, A Novel Ingredient in food processing. Journal of Nutrition and Food Science 10: 771.
- Rajendran V, Marichamy I, Sundarrajan S, Ramalingam SK (2018) Phytonutrients analysis in 10 popular traditional Indian rice landraces (Oryza Sativa L.). Article in Journal of Food Measurement and Characterization 12: 2598-2606.
- Wongsa P (2020) Phenolic compound and potential health benefits of pigmeted rice, Intech Open. Recent Advances in Rice Research 2020 11: 1-20.
- Adnaik RS, Pai PT, Mule SN, Naikwade NS, Magdum CS (2008) Luxative activity of Vitex negundolinn leaves. Asian Journal of Experimental Science 22: 159-160.
- Harbone, Jeffery B (1998) Phytochemical methods: A guide to modern techniques of plant analysis(textbook) Publisher: London: chapman and hall, New York.
- Safowora A (1993) Medicinal plants and traditional medicinal in Africa. Nigeria, spectrum books ltd 150-156.
- Trease GE, Evans WC (2010) The text book of pharmacognosy. London saunders publishers.
- Singleton VL, Orthofer R, Lamuela- Raventos RM (1974) Analysis of total phenols and other oxidation substrayed and antioxidant by means of folin-ciocalteau reagent. Am J Enol vitic 25: 119.
- Mervat MM, El Far, Hanan A, Taie A, Far Mervat MM El, et al. (2009) Antioxidant activities, total anthrocynins, phenolics and flavonoids contents of some sweet potato genotypes under stress of different concentrations of sucrose and sorbitol. Australian Journal of Basic Applied Science 3: 3609-3616.
- Zhao H, Fan W, Dong J, Lu J, Chen J, et al. (2008) Evaluation of antioxidant activities and total phenolic contents of typical malting barley varieties. Food Chemistry 107: 296-304.
- Zeeni SK, Ahmed M, Khan F (2017) Qualitative and Quantitative estimation of terpenoid content in some important plants of Punjab, Pakistan. Pakistan Journal of Science 69: 2.
- Issac R, Aparna N, Chavali M, Varghese E (2012) Phytochemical, antioxidant and nutrient analysis of medicinal rice varieties found in South India. Journal of Computational and Theoretical Nanoscience Advanced Science Letters 5: 1-5.
- Shimada K, Fujikawa K, Yahara K, Nakamura T (1992) Antioxidative properties of xanthone on the auto oxidation of soybean in cylcodextrin emulsion. Journal of Agriculture and Food Chemistry 40: 945-948.
- Iris FF, Benzie JJ (1996) Strain. The ferric reducing ability of plasma (FRAP) as a measure of antioxidant power. The frap assay Analytical Biochemistry 239: 70-76.
- Sinha AK (1972) Calorimetric assay of catalase. Analytical biochemistry 47: 389-394.
- Lowry OH, Rosebrough NJ, Farr NJ, Randall RJ (1951) Protein measurement with Folin phenol reagent. J Bio Chem 193: 265-275.
- Misra HP, Fridovich I (1972) The role of superoxide anion in the autooxidation of epinephrine and a simple assay for superoxide dismutase. J Bio chem 247: 3170-3175.
- Rotruck JT, Ganther HE, Swansin AB, Hafeman DG, Hoekstra WG, et al. (1980) Selenium: Biochemical role as a component of glutathione peroxidase. Nutritional Reviews 38: 280-283.
- Gavamukulya Y (2015) GC-MS Analysis of bioactive phytochemicals present in ethanolic extracts of leaves of Annona muricata: Further evidence for its medicinal diversity. Pharmacognosy Journal 7: 300-304.
- Fatchiyah F, Tirto sari DW, Safitri A, Cairns RKJ (2010) Phytochemical compound and nutritional value in black rice from Java Island, Indonesia. Systematic Review in Pharmacy 11: 414-421.
- Umamaheswari S, Hemamalini S, Lavanya R, Umamaheswara Reddy C (2018) Exploring the therapeutic potential and nutritional properties of karuppu kavuni varieties of Tamil Nadu. International Journal of Pharma and Bio Science 9: 88-96.
- Rahaju R, Pancoro A, Sumardi D (2019) Total flavonoids and anthocyanin content of pigmented rice. Drug Invention Today 12: 369-373.
- Battacharrya S, Roy S (2018) Qualitative and Quantitative assessment of bioactive phytochemicals in gobindhog and black rice cultivated in West Bengal, India. International Journal of Pharmaceutical Science and Research 9: 3845-3851.
- Sridevi J (2014) Nutraceutical potential of black rice and its hypoglycaemic activity in streptozotocin induced diabetic rats. Food Science and Technology Research 22: 825-836.
- Priya RTS, Nelson ARLE, Ravichandran K, Antony U (2019) Nutritional and functional properties of coloured rice varieties of South India, a review. Journal of Ethnic Foods 6: 1-11.
- Reshmi R, Nandhini PV (2018) Antioxidant activity of Indian medicinal rice c.v Njavara. International journal of Advanced Engineering Management and Science 4: 141-148.
- Ghasemzadeh A, Rahmat A, Karbalaei M (2018) Phytochemical constituents, antioxidant and antiproliferative properties of black, red, and brown rice bran. Chem Central J 17: 1-13.
- Mudoi T, Das P (2019) study on phytochemical, and mineral content of indigenous red rice of Assam, India. Int J of Current Microbiol App Sci 8: 1-12.
- An -Na C, Hua-lin W, Hung-I Y, Chi-Shuen C, Hui-Chiao L, et al. (2006) Antioxidant effects of black rice extract through the induction of superoxide dismutase and catalase activities. Lipids 41: 797-803.
- Herath S, Entila FD, Ella ES, Baltazar AM, Johnson AE (2017) Physiological response and antioxidant activity of rice and grass weed to flooding during germinatiom. Annals of Sri Lanka Dep of Agri 19: 321-338.
- Zhang, JH, Sun HL, Chen SY, Zeng L, Wang TT (2017) Anti-Fungal Activity, Mechanism Studies on α-Phellandrene and Nonanal against Penicillium cyclopium. Botanical Studies 58: 13.
- Alok Kumar V, Prathap R (2010) The biological potential of flavones. Article in Natural Product Report 27: 1571-1593.
- Elaiyaraja A, Chandramohan G (2016) Comparative phytochemical profile of Indoneesiella echioides nees leaves using GC-MS. J of Pharmacognosy and Phytochemistry 5: 158-171.
- Siva Reddy G, Srinivasalu K, Mahendran G, Srinivasa Reddy R (2018) Biochemical characterization and anti-microbial activity and purification of glycolipids produced by dodecanoic acid, undecyl ester. Res J of Pharmacy and Technol 11: 4066-4073.
Citation: Chandra Sekar G, Bhagavathy S (2023) Comparative GC-MS, Phyto- chemical Analysis and Free Radical Scavenging activities of South Indian Rice Varieties. J Plant Sci Curr Res 7: 024.
Copyright: © 2023 Chandra Sekar G, et al. This is an open-access article distributed under the terms of the Creative Commons Attribution License, which permits unrestricted use, distribution, and reproduction in any medium, provided the original author and source are credited.