Comparison of Nutrition Parameters and MNA and SGA Scores of Geriatric and Non-Geriatric Chronic Liver Parenchymal Patients
*Corresponding Author(s):
Nese KarakasDepartment Of Health Care Services, Vocational School Of Health Services, Inonu University, Malatya, Turkey
Tel:04223410051,
Email:nese.karakas@inonu.edu.tr
Abstract
Aim:The aim of this study was to compare the use fulness of the Mini Nutritional Assessment Test (MNA) and Subjective Global Assessment (SGA) as a screening test to evaluate the nutritional status of geriatric and non-geriatric chronic liver parenchymal patients.
Materials and methods: The sample of the analytical and cross-sectional study is composed of 67 chronic liver parenchymal patients without any transplantation, no additional disease and no active infection. Data were collected using MNA, SGA, current laboratory findings, CHILD and MELD scores. Mann-Whitney U test and Chi-Square test were used for the analysis of there search data. Chi-square test was used to evaluate categorical data. p<0.05 was considered as statistically significant.
Results: Chronic liver parenchymal patients within the scope of their search were categorized as geriatric and non-geriatric patients. There was no significant difference in albumin, total protein, CHILD and MELD scores, calcium, glucose, INR, sodium, potassium, hemoglobin platelet, acid and encephalopathy levels between the two groups (p?0,05). No significant difference was observed between MNA and SGA scores (p?0,05). According to the MNA scores, a significant difference betweent healbum in values of the patients was observed, taking normal patients, patients with malnutrition, and those having a risk of malnutrition in to account (p<0.05). No significant difference was found between the two age groups according to SGA score (p?0,05). When patients were classified based on their SGA score as well-nourished, moderate malnutrition, severe malnutrition groups, a significant difference between the albumin values of the groups was observed (p<0.05). Those, who have low MNA scores, had high CHILD score in both patient groups (p<0.05).
Conclusion: It was observed that both of the evaluation tests could be used to detect malnutrition in geriatric and non-geriatric chronic liver parenchymal patients.
Keywords
Chronic liver, Malnutrition, MNA, SGA
INTRODUCTION
Cirrhosis is a progressive disease, which emerges due to the deterioration of the liver structure commonly as a result of nodular formation, regeneration, necrosis and fibrosis [1]. Cirrhosis mostly develops because of Hepatitis B in the world and in Turkey. In developed countries, the most important reason of cirrhosis is alcoholism [2]. From an epidemiological point, cirrhosis poses a great burden economically and socially in the whole World. It is reported that in the USA, the most frequently observed reason of deaths other than cancer is cirrhosis among hepatobiliary and digestive system diseases [3,4].
The structural deficiencies resulting from the inadequate intake of nutrients, which cells, tissues and organs need and the occurrence of dysfunction in the organs is called Malnutrition. It is known that malnutrition is often seen among patients with cirrhosis disease and increases complications and mortality resulting from cirrhosis in this group of patients [5-7]. With regard to preventing complications resulting from malnutrition in cirrhosis patients, it is crucial that the nutritional status of this group of patients is evaluated and the necessary diet modifications are applied in the short term. However, because nutritional parameters in the blood are synthesized in the liver with patients who have chronic liver disease and anthropometric measurements such as body mass index and body weight are affected due to acid, oedema and fluid retention, it is hard to evaluate the nutritional state. In addition to this, the handgrip test, which is frequently preferred in nutritional evaluations, loses its diagnostic value with patients who have hepatic encephalopathy. In the literature, it is stated that SGA (Subjective Global Assessment) is more reliable when compared to other nutritional assessment tests in chronic liver diseases [8].
Even though chronic parenchymal liver disease can be seen at every age, differences may occur in prognosis, due to additional diseases in geriatric age group and the high ratio of malnutrition. Other than this, since the recent onset symptoms of malnutrition in geriatric age group are not specific and can be mistaken for signs of aging, it is hard to diagnose [9]. While MNA does not serve as a golden standard, it is recognized as the most efficient nutritional screening tool among the old [10,11].
Among patients with chronic parenchymal liver disease, the malnutrition stemming from multifactorial reasons accelerates the progression of the disease and prolongs hospitalization and the duration of hospitalization. Among patients with chronical parenchymal liver disease, the early diagnosis and effective treatment of malnutrition may affect the prognosis of the patient positively.
In this study, we aimed to compare the utility of MNA and SGA assessment tests, which are frequently used in nutritional status scanning with patients who have geriatric and non-geriatric chronic parenchymal liver disease.
MATERIALS AND METHODS
Before the research was initiated, the ethics committee approval was received from ?nönü University Non-Invasive Researches Ethics Committee. For the research to be conducted in ?nönü University Turgut Özal Medical Center, written permission was taken from ?nönü University Turgut Özal Medical Center Head Physician. The target population of the study consists of 98 patients with chronic paranchymal liver disease, who applied to ?nönü University Turgut Özal Medical Center Hepatology Outpatient Clinic, Gastroenterology Service and Intensive Care, Organ Transplantation Service and Intensive Care, who were not transplanted and did not have active infection, chronic renal failure and severe neurological problem and were being monitored for at least 6 months during the dates when the research was conducted.
No sampling method was used in the research. 37 patients below the age of 65 and 30 patients above the age of 65 who accepted to participate in the research were included in the study. The data of the research, which was planned in analytical and cross-sectional type, the MNA, SGA, updated laboratory findings were gathered through CHILD-Turcotte-Pugh (CTP) and Model for End Stage Liver Disease (MELD) classification.
CTP and MELD scores are the two important scores, which determine prognosis with patients who have chronic parenchymal liver disease (28). The patients were classified according to CHILD score, those who have 5-6 points being classified as CHILD A; 7-9 CHILD B and 10-15 CHILD C. The increase in scores indicates worsening of prognosis.
The score developed by Malinchoc et al., is used to estimate the transplantation priority of cirrhosis patients and mortality (33). It has more objective parameters when compared to CHILD score. MELD score is calculated considering the INR, total bilirubin and creatine levels and the following formula is used:
MELD=3.78x log(Bilirubin mg/dl)+11.2 x loge(INR)+ 9.57 x loge(Creatinine mg/dl)+6.4
In line with the aim of the study, MNA and SGA scores were used in the assessment of the nutritional states of patients. In the MNA test, those whose points were lower than 17 were considered to have malnutrition, between 17-23.5 to be under the risk of malnutrition and between 24-30 as being in a normal nutritional state. In the SGA test, A was considered to eat well, B to have moderate malnutrition and C serious malnutrition.
The patients updated numbers of bilirubin, albumin, total protein, sodium, potassium, calcium, glucose, BUN, creatine haemoglobin, WBC and platelet were taken as data during the period when they did not have active infections, applied to the hospital because of the chronic parenchymal liver disease and its complications and surveys were conducted. The acid evaluations of patients were made through visualization methods; the encephalopathy degree of patients was reported after taking their clinical evaluation results. The favourability of the data regarding normal distribution was evaluated via the Kolmogorov Smirov Test. The Mann-Whitney U and Chi-Square tests were performed for the analysis of the data, which did not comply with normal distribution. Chi-square test was used for qualitative data. The significance level was accepted as p<0.05.
FINDINGS
30 patients over the age of 65 and 37 patients below the age of 65, who had chronic parenchymal liver disease, were included in our study. Within the scope of the research, the age average of patients over the age of 65 was 68,0 years and the age average of patients below the age of 65 was 45,0. In our study, a significant difference was monitored between the CHILD groups of patients over the below the age of 65. 50% of the patients over the age of 65 and 45% of the patients below the age of 65 were in the CHILD A group and a significant difference was monitored between the groups (p=0.046). A significant difference was also observed between the CHILD B groups of patients over and below the age of 65 (p=0.032). No difference was monitored between the CHILD C groups of the two groups of patients (p=0.751) (Table 1).
|
Child |
Over the age of 65 n (%) |
Below the age of 65 n (%) |
|
A(5-6) |
15 (50) |
17 (%45) |
|
B(7-9) |
8 (26) |
13 (%36) |
|
C(10-15) |
7 (24) |
7 (%19) |
|
Total |
30 (100) |
37 (100) |
Table 1: Patient Groups and CHILD Scores.
No significant difference was monitored between the MNA test scores of the two groups over and below the age of 65, which we included in our study. The average MNA score of patients over the age of 65 was measured as 20.15 (13-27) and the average MNA score of patients below the age of 65 was measured as 20.66 (13-27) (p=0.774). In our study, no significant difference was monitored between the albumin values of the two groups of patients (p=0.0565). While the average total protein of patients over the age of 65 was 7.046 gr/dl (4.5-8.4), the average total protein value of patients below the age of 65 was 6.97 gr/dl (4.1-8.7) and no significant difference was monitored between the two groups (p=0.651).
While no difference was monitored between the albumin values of the groups whose SGA test below the age of 65 was A, B, C, a difference was monitored between the albumin values of SGA A,B,C groups over the age of 65. While average albumin values of the well-nourished group whose SGA test over the age of 65 is A were 3.2 gr/dl (2-4.2), the average albumin values of the moderate malnutrition group whose SGA test was B were 2.7 gr/dl (1.7-3.9) and a significant difference was monitored between the two groups (p<0.013). A difference was found between the albumin values of the well-nourished group whose SGA test over the age of 65 was A and the heavy malnutrition group whose SGA test was C (p=0.028).
The SGA groups of patients with malnutrition whose MNA score over the age of 65 were below 17 were determined as 12.5% A, 75% B and 12.5% C group. Among the patients whose MNA score above the age of 65 were between 17-23.5, the SGA group of 50% was determined as A and 5% as B. The SGA group of all the patients whose MNA score over the age of 65 was between 24-30 was determined as A (Figure 1).
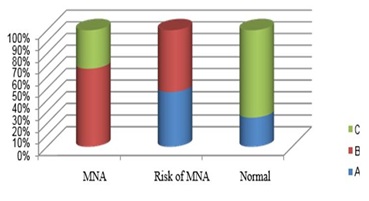 Figure 1: Comparison of MNA and SGA scores of patients under 65.
Among the patients below the age of 65 whose MNS score was below 17, the SGA group of 67% was determined as B, and 33% was determined as C. Among the patients whose MNA score was between 17-23.5, the SGA group of 47% was determined as A and 53% as B. It was found that the SGA group of all patients whose MNA score was between 24-30 was A. A significant difference was found between the SGA test analysis results of the groups whose MNA scores over and below the age of 65 was 17 (p=0.012) (Figure 2).
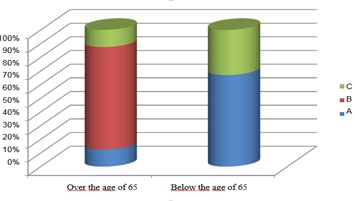 Figure 2: Comparison of SGA scores of patients older than 65 years and younger.
DISCUSSION
Even though chronic parenchymal liver disease can be seen at any age, differences are seen in prognosis due to the additional diseases in geriatric age group and malnutrition. In this study, we researched the efficiencies of MNA and SGA evaluation tests in predicting malnutrition with chronic parenchymal liver disease patients over and below the age of 65 and the patient’s relation with laboratory parameters. In the study conducted on 77 cirrhosis patients, Kenichiro et al. found that the MNA and SGA scores of patients did not correlate with their anthropometric measurements and nutritional parameters [12]. In this study, the results of MNA, widely used with old patients were compared with other nutritional parameters and it was shown that the nutritional status in patients with liver cirrhosis was related to nutritional parameters. MNA was determined as an evaluation method, which can be used as a nutritional screening tool in patient groups with cirrhosis [13]. In a study conducted by Tsai et al., on 300 hepatocellular cancer cases, it was shown that there was a relation between serum albumin levels and MNA scores. It was concluded that MNA is a beneficial nutritional screening tool for patients with liver cirrhosis and that scores were related to anthropometric parameters regarding representational nutrition and the data of serum biochemistry [14]. In our study, while the average MNA score of patients over the age of 65 was 20.15 (13-27), the average MNA score of patients below the age of 65 was 20.66 (14-27) and no relation was found between age and MNA score. An examination of the literature reveals that there are no studies researching the relation between age and MNA score in patients with chronic liver disease. There is need for more studies on this topic. In our study, the average albumin value of the group with malnutrition over the age of 65 whose MNA score was below 17 was 2,1 gr/dl; the average albumin value of the group whose MNA score was between 17-23.5 was 3.06 gr/dl; and the average albumin value of the group with normal malnutrition, whose MNA score was between 24-30 was 3.62 gr/dl and a significant difference was found between the groups (p<0.05). In consequence of this study, it was concluded that albumin and MNA test are correlated in predicting malnutrition over the age of 65. Likewise, the group with malnutrition, whose MNA score over the age of 65 was below 17, had an average albumin value of 2.38 gr/dl; the group under the risk of malnutrition whose MNA score was between 17-23.5 had an average albumin value of 2.4 gr/dl; the group with normal malnutrition whose MNA score was between 24-30 had an albumin value of 3.55 gr/dl and a significant difference was monitored between the groups (p<0.05).With chronic liver patients below the age of 65, not only albumin but also MNA score can be used to predict the malnutrition state of the patient.
In our study, we compared and analysed the CHILD scores of the patient group over the age of 65 according to their MNA scores. The group with malnutrition whose MNA score was below 17 had an average CHILD value of 9 points; the patients under the risk of malnutrition whose scores were between 17-23.5 had an average CHILD point of 7.3; and the patients with a normal state of malnutrition, whose scores were between 24-30 had an average CHILD score of 5.6 and a significant difference was monitored between the groups (p<0.05). Likewise, the patients, who are younger than 65, whose MNA score was below 17, and who had a CHILD average of 9.17-23.5, had an average CHILD point of 7.5; those whose MNA scores were between 24-30 had an average CHILD point of 6.6. A significant difference was detected between the groups (p<0.05). With chronic liver patients both over and below the age of 65, those with low MNA scores were found to have higher CHILD scores. It was found that the CHILD score, which is a prognostic score in patients with chronic liver disease and MNA score correlated and that MNA score can be a prognostic determinant. In a study conducted by Gonçalo et al. on 130 patients with liver cirrhosis, a relation was found between SGA scores and the severity of the liver disease. It was seen that those with a worse functional state, whose CHILD stage was C had a higher SGA score. The protein energy malnutrition was observed to be more severe with patients who were described by SGA to be nourished badly in a more serious way [15,16]. In our study, according to the SGA results of patients over the age of 65, 47% were included in Group A, 50% Group B and 3% Group C. The average albumin values of those in group A was 3.2 gr/dl, group B 2.7 gr/dl and group C 2.7 gr/dl and a significant difference was found between the groups (p<0.05). Likewise, the average albumin value of those in group A below the age of 65 was 3.3 gr/dl, group B 2.6 gr/dl and group C 1.1 gr/dl. A significant difference was found between the groups (p<0.05). A significant difference was found between the albumin values of those whose SGA scores were A and B (p<0.05). There was also a significant difference between groups A and C (p<0.05). However, no difference was found between groups B and C (p?0.05).
CONCLUSION/SUGGESTIONS
In consequence of the study, which we conducted, it was seen that both MNA and SGA could be significant in predicting malnutrition with both geriatric and non-geriatric patients who have chronic parenchymal liver disease. More studies need to be conducted on this topic.
REFERENCES
- Rockey DC, Friedman SL (2012) Hepatic Fibrosis and Cirrhosis (6thedn). In: Boyer TD, Manns MP, Sanyal AJ (eds.). Zakim and Boyer’s Hepatology. Elsevier 64-85.
- Figueiredo F, Dickson ER, Pasha T, Kasparova P, Therneau T, et al. (2000) Impact of nutritional status on outcomes after liver trasnplantation. Transplantation 70: 1347-1352.
- Dam Fialla A, Schaffalitzky de Muckadell OB, Touborg Lassen A (2012) Incidence, etiology and mortality of cirrhosis: a population-based cohort study. Scand J Gastroenterol 47: 702-709.
- Blachier M, Leleu H, Peck-Radosavljevic M, Valla DC, Roudot-Thoraval F (2013) The burden of liver disease in Europe: a review of available epidemiological data. J Hepatol 58: 593-608.
- O'brien A, Williams R (2008) Nutrition in end-stage liver disease: principles and practice. Gastroenterology 134: 1729-1740.
- Fialla AD, Israelsen M, Hamberg O, Krag A, Gluud LL (2015) Nutritional therapy in cirrhosis or alcoholic hepatitis: a systematic review and meta-analysis. Liver Int 35: 2072-2078.
- Cheung K, Lee SS, Raman M (2012) Prevalence and mechanisms of malnutrition in patients with advanced liver disease, and nutrition management strategies. Clin Gastroenterol Hepatol 10: 117-125.
- Henkel AS, Buchman AL (2006) Nutritional Support In Chronic Liver Disease. Nat Clin Pract Gastroenterol Hepatol 3: 202-209.
- Pulat H (2005) Nütrisyonel Durum De?erlendirme Yöntemlerinin Etkinli?inin Ara?t?r?lmas?. Zonguldak Karaelmas Üniversitesi Sa?l?k Bilimleri Enstitüsü Genel Cerrahi Anabilim Dal?. Yüksek lisans Tezi, Zonguldak.
- Bauer JM, Kaiser MJ, Anthony P, Guigoz Y, Sieber CC (2008) The Mini Nutritional Assessment--its history, today's practice, and future perspectives. Nutr Clin Pract 23: 388-396.
- Montejano Lozoya R, Martínez-Alzamora N, Clemente Marín G, Guirao-Goris SJA, Ferrer-Diego RM (2017) Predictive ability of the Mini Nutritional Assessment Short Form (MNA-SF) in a free-living elderly population: a cross-sectional study. PeerJ 5: 3345.
- Vieira PM, De-Souza DA,Oliveira LC (2013) Nutritional assessment in hepatic cirrhosis; clinical, anthropometric, biochemical and hematological parameters. Nutr Hosp 28: 1615-1621.
- Terakura Y, Shiraki M, Nishimura K, Iwasa J, Nagaki M, et al. (2010) Ind?rect calorimetry and antropometry to estimate energy metabolism in patients with livercirrhosis. J Nutr Sci Vitaminol 56: 372-379.
- Hsu WC, Tsai AC, Chan SC, Wang PM, Chung NN (2012) Mini-nutritional assessment predicts functional status and quality of life of patients with hepatocellular carcinoma in Taiwan. Nutr Cancer 4: 543-549.
- Figueiredo F, Dickson ER, Pasha T, Kasparova P, TherneauT, et al. (2000) Impact of nutritional status on outcomes after liver trasnplantation. Transplantation 70: 1347-1352.
- Reijnierse EM, Trappenburg MC, Leter MJ, Blauw GJ, Schueren MA, et al. (2015) The Association between Parameters of Malnutrition and Diagnostic Measures of Sarcopenia in Geriatric Outpatients. PLoS One 10: 0135933.
Citation: Bodakci E, Bentli R, Karakas N (2019) Comparison of Nutrition Parameters and MNA and SGA Scores of Geriatric and Non-Geriatric Chronic Liver Parenchymal Patients. J Community Med Public Health Care 6: 057.
Copyright: © 2019 Emin Bodakci, et al. This is an open-access article distributed under the terms of the Creative Commons Attribution License, which permits unrestricted use, distribution, and reproduction in any medium, provided the original author and source are credited.