Confirmatory Factor Analysis of Sleep Quality among Grandparents Raising Grandchildren
*Corresponding Author(s):
Clark KCCollege Of Allied Health And School Of Nursing, Southern University College Of Nursing And Allied Health, Baton Rouge, LA, United States
Tel:+1 2257715903,
Email:karen.clark@sus.edu
Abstract
This study examined the factor structure of the Pittsburgh Sleep Quality Index (PSQI) and the sleep quality of custodial grandparents during the Coronavirus pandemic (COVID-19). A convenience sample of custodial grandparents (N=102) between the ages of 31 and 78 completed the Pittsburgh Sleep Quality Index (PSQI) tool. Descriptive statistics, inferential tests and Confirmatory Factor Analysis (CFA) were performed on the items to investigate the scale structure of this population. Results showed a significant positive relationship between sleep quality and daytime dysfunction for custodial grandparents. Fit indices showed a good model of fit; the best model is the one-factor model. Findings suggest grandparents with poor sleep quality are more likely to experience daytime dysfunction and have more sleep disturbances in the COVID-19 environment. Furthermore, the examination of sleep quality emphasizes the potential role of poor sleep quality as a barrier to successful health-promoting and life-style interventions.
Keywords
Confirmatory factor analysis; COVID-19; Custodial grandparents; Health promotion; PSQI; Sleep quality
Introduction
- Grandparents as caregivers
Sleep is essential to a healthy brain and mental and physical functioning health [1,2] however, sleep issues are prevalent for caregivers [3]. In the United States, US, over 7.1 million grandchildren live with their grandparents with 13.4% of those grandchildren without parents in the home, making grandparents the primary caregivers [4]. Factors to grandparents becoming head of household to their grandchildren occur for various reasons, including parent substance abuse [5], parental death, or parental incarceration [6], makes them vulnerable to poor sleep outcomes. Research shows that poor sleep quality is associated with higher rates of disability [7], grandparenting stress [8], depressive symptoms [9], and childhood maltreatment [10]. With the growing number of grandparents becoming primary caregivers, it is increasingly important to understand the sleep quality of custodial grandparents.
During Coronavirus pandemic COVID-19, Custodial grandparents were at risk for COVID-19, and the loss of lives has impacted many families worldwide [11]. Households have been disrupted, leaving parents and caregivers to make significant adjustments to their family routines. As the pandemic continued, families dealt with many uncertainties about the care of their children, such as the inability to work, attend school, and provide food in some cases [12] found that many caregivers experienced an increase in financial instability leaving them at an increased risk for stress.
- Sleep and age
Sleep is associated with healthy living and overall health. Lack of sleep has been found to be responsible for individual's physical and psychological well-being [13]. No matter your age, sleep quality is essential for daily function. As adults increase in age, sleep is harder to initiate and maintain. Sleep disorders do not occur because a person is aging, but as individuals age, so may their problems with sleep [14]. Many studies have found sleep to be a problem in older adults ages 65 or older but are finding that sleep is a problem in all ages. Kovacava and Stebelova [15] found a difference in sleep quality at different ages, with those over 60 reporting worse sleep quality. Individuals are subject to many common sleep complaints and disorders, including poor sleep quality, daytime sleepiness, circadian rhythm sleep disorders, and insomnia [16]. The Pittsburgh Sleep Quality Index (PSQI) is one such instrument to measure sleep quality in custodial grandparents. Confirmatory Factor Analysis (CFA) is important to measure when using an instrument to assess multiple factors ultimately contributing to sleep quality. Because of the dimensionality of the PSQI, the literature shows numerous factor structures [16]. However, custodial grandparents caregivers were not part of the populations.
Custodial grandparents are already considered a vulnerable population, making them more susceptible to poor outcomes such as depression, anxiety, and other mental health problems [17]. Having to isolate themselves left with even fewer resources. Grandparent caregivers are disadvantaged with limited resources and often have decreased access to transportation and social support. During Covid-19, research shows many populations have displaced physical responses related to Covid. Alodhayani et al., [18] found 65% of their participants experiencing poor sleep quality also had sleep problems at the start of Covid. Hajek & König [19] found that increased loneliness was associated with worsening sleep quality among women and men. As the number of custodial grandparents increases and become head of household, it's essential to understand their sleep quality. Thus, this study aimed to identify the sleep quality of custodial grandparents to gain insight into their sleep quality during Covid-19, and to test the factor structure of the PSQI to measure sleep quality and its sub components.
Methods
- Sample
The sample was comprised 102 grandmothers who were between the ages of 31 and 78 (m=56.97, standard deviation= 9.28). Participants were African American (35.3%), White (53.9), other (10.8%), and self-identified as Hispanic (2.9%). Marital status included 23% single, 23.0%, 7.8% divorced, 10.8 widowed, 48.4% married and other 10.8%. The number of adults who live in the home was 2.9%, number of children was 1.4%. Approximately 52.9% were employed, retired 16.7% retired, 10.8% disabled, and 19.6% other, with 62.7% earning a college or attended, and 17.6% earning a high school diploma or equivalent. Table 1 summarizes the demographic characteristics of the custodial grandparents and their households.
|
|
M (SD) |
Range |
|
Age |
||
|
Age (years) |
56.97 (9.28) |
31-78 |
|
Household |
||
|
Number of Children |
1.44 (0.67) |
1-4 |
|
|
% |
|
|
Race |
|
|
|
Black |
35.29% |
|
|
White |
53.90% |
|
|
Other |
10.81% |
|
|
Ethnicity |
|
|
|
Hispanic |
2.94% |
|
|
Marital Status |
|
|
|
Single |
22.55% |
|
|
Married |
48.04% |
|
|
Divorced |
7.84% |
|
|
Widowed |
10.78% |
|
|
Other |
10.79% |
|
|
Employment Status |
|
|
|
Employed Full-Time |
28.43% |
|
|
Employed Part-Time |
24.51% |
|
|
Retired |
16.67% |
|
|
Disabled |
10.78% |
|
|
Other |
19.61% |
|
|
Education |
|
|
|
Less than High School |
19.61% |
|
|
High School and GED |
17.64% |
|
|
Some College |
38.24% |
|
|
College Graduate |
24.51% |
|
Table 1: Descriptive statistics (n=102).
- Data collection
The Institutional Review Board approved all study measures and procedures of the affiliated researchers. Interested participants were recruited in fall 2020 and spring 2021 during the COVID-19 pandemic through the (hidden) AAA (Area Agency on Aging). The Area Agency on Aging (AAA) are local support agencies for older adults under the (hidden) Department of Human Services Department of Aging Services. Division of Aging Services (DAS) Kinship Coordinators informed members of the kinship group of the survey through a flyer placed online and dispensed in person. Participants were also recruited online via social media. To be eligible for the study, they had to be a custodial grandparent of at least one grandchild living in the home, provide an email or physical address for incentive, and complete the survey in 900 seconds or more. Grandparents are residents of (hidden) with no more than two participants living at the same address. Locations were verified by their address. A tier system based on the number of completed responses was used to include participants. Custodial grandparents were compensated with an online $20 gift card for their participation.
Measures
- Demographics: Sleep quality
Custodial grandparents reported their age, race/ethnicity, marital status, number of adults and children in the household and education level. Custodial grandparents complete The Pittsburgh Sleep Quality Index (PSQI), a self-assessment of perceived sleep quality [20] online via Qualtrics. Composed of 24 items, the assessment evaluates sleep quality over the previous one-month period. A total global score and seven components are obtained from the scale. The components include sleep quality, sleep latency, sleep duration, sleep efficacy, sleep disturbance, use of sleep medications, daytime dysfunction and the overall global sleep quality. Each component is scored from 0 to 3, with the total score ranging from 0 to 21. Higher scores indicate worse sleep quality. Other questions include "How long has it usually taken you to fall asleep each night?" The measure has well-established psychometric properties [21,22].
Component 1: Subjective Sleep Quality is measured via a single indicator, "During the past month, how would you rate your sleep quality overall?" with response options ranging from 0 to 3: (0) Very Good, (1) Fairly Good, (2) Fairly Bad, and (3) Very Bad. Thus, higher scores on Component 1 indicate poorer subjective sleep quality.
Component 2: Sleep latency is measured via the combination of two indicators. The first indicator, "During the past month, how long (in minutes) has it usually taken you to fall asleep each night?" ranges from 0 to 3: (0) ≤ 15 minutes, (1) 16-30 minutes, (2) 31-60 minutes, and (3) > 60 minutes. The second indicator, "During the past month, how often have you had trouble sleeping because you cannot get to sleep within 30 minutes?" ranges from 0 to 3: (0) Not during the past month, (1) Less than once a week, (2) Once or twice a week, and (3) Three or more times a week. Responses for each indicator were summated and then collapsed into the following categories 0 to 0, 1-2 to 1, 3-4 to 2, and 5-6 to 3. Thus, higher scores indicate a longer sleep latency or time to fall asleep.
Component 3: Sleep duration is measured via a single indicator, "During the past month, how many hours of actual sleep did you get at night? (This might be different than the number of hours you spent in bed.") where >7 hours coded as 0, 6-7 hours was coded as 1, 5 hours was coded as 2, and < 5 hours was coded as 3. Thus, a higher score on sleep duration means fewer hours of sleep.
Component 4: Sleep efficiency is measured via a combination of three indicators: "During the past month, what time have you usually gone to bed at night?", "During the past month, what time have you usually gotten up in the morning?", and "During the past month, how many hours of actual sleep did you get at night? (This may be different than the number of hours you spent in bed"). "Sleep efficiency was calculated as the hours slept divided by the hours in bed, which was then multiplied by 100. Respondents with a sleep efficiency score of >85% were coded as a 0, 75-84% as a 1, 65-74% as a 2, and < 65% as a 3. Thus, a higher score on sleep efficiency indicates worse sleep efficiency.
Component 5: Sleep disturbance is measured via a summation of 9 indicators which have the same root, "During the past month, how often have you had trouble sleeping because you..." and response options of (0) Not during the past month, (1) Less than once a week, (2) Once or twice a week, and (3) Three or more times a week: "Wake up in the middle of the night or early morning", "Have to get up to use the bathroom", “Cannot breathe comfortably”, “Cough or snore loudly”, “Feel too cold”, “Have bad dreams”, “Have pain”, and “Other reason(s), please describe:”. Summation scores were generated and then collapsed into 0 to 0, 1-9 to 1, 10-18 to 2, and 19-27 to 3. Thus, a higher score indicates more sleep disturbances.
Component 6: Use of sleep medication is measured via a since indicator “During the past month, how often have you taken medicine to help you sleep (prescribed or “over the counter”)?” with response options of (0) Not during the past month, (1) Less than once a week, (2) Once or twice a week, and (3) Three or more times a week. Thus, higher scores indicate more use of sleep medication.
Component 7: Daytime dysfunction is measured via a summation of two indicators which have the same response options of (0) Not during the past month, (1) Less than once a week, (2) Once or twice a week, and (3) Three or more times a week: “During the past month, how often have you had trouble staying awake while driving, eating meals, or engaging in social activity?” and “ During the past month, how much of a problem has it been for you to keep up enough enthusiasm to get things done?” The response options were summated and then collapsed into 0 to 0, 1-2 as 1, 3-4 as 2, and 5-6 as 3. Higher scores indicate more daytime dysfunction.
The global PSQI Score is the overall sleep score. The overall sleep score is generated via the summation of components 1 through 7 outlined above. Scores can range from 0 to 28. Higher scores indicate poorer sleep quality.
- Analytics
We conducted all analyses using STATA 16 software. We conducted Gamma tests and T-test to examine the relationship between the sleep components (i.e. subjective sleep quality, sleep latency, sleep duration, sleep efficiency, sleep disturbance, sleep medication, and daytime dysfunction). Descriptive statistics were used to summarize baseline characteristics. Pairwise deletion was used due to the small sample size and to preserve statistical power. Confirmatory factor analysis was used to determine the latent structure of the sleep subcomponents in Southern custodial grandparents.
Results
Table 1 contains descriptive statistics on all study participants, the overall sleep quality score and sleep subcomponents. Overall sleep quality ranges from 1 to 18 with an average score of 8.14 (SD=3.742), with higher scores indicating poorer sleep quality. Additionally, each of the sleep subcomponents is reported where higher scores indicate poorer sleep quality with the poorest sleep components being sleep latency (M=1.75, SD=0.956) followed by sleep disturbance (M=1.42, SD=0.594), subjective sleep quality (M= 1.21, SD= 0.762), daytime dysfunction (M=1.15, SD=0.679), sleep duration (M=1.02, SD=0.728), use of sleep medication (M=0.94, SD=1.028), and sleep efficiency (M=0.70, SD=1.097).
Overall sleep quality ranges from 1 to 18 with an average score of 8.14 (SD=3.742), with higher scores indicating poorer sleep quality. Additionally, each of the sleep subcomponents is reported where higher scores indicate poorer sleep quality with the poorest sleep components being sleep latency (M=1.75, SD=0.956) followed by sleep disturbance (M=1.42, SD=0.594), subjective sleep quality (M= 1.21, SD= 0.762), daytime dysfunction (M=1.15, SD=0.679), sleep duration (M=1.02, SD=0.728), use of sleep medication (M=0.94, SD=1.028), and sleep efficiency (M=0.70, SD=1.097).
- Confirmatory factory analysis
Confirmatory factor analysis was conducted to examine how the subcomponents of sleep statistically come together for custodial grandparents. As shown in figure 1, all three standard measures fall within ideal parameters: RMSEA is less than 0.05 at 0.046, CFI over 0.9 at 0.979, and TLI over 0.9 at 0.969. Additionally, each sleep sub-measure has a significant and positive association with the overall latent variable of sleep quality with the highest association for sleep latency (0.77, p < 0.001) followed by subjective sleep quality (0.71, p < 0.001), sleep disturbances (0.62, p < 0.001), sleep duration (0.59, p < 0.01), daytime drowsiness (0.59, p < 0.001), use of sleep medication (0.48, p < 0.001), and lastly sleep efficiency (0.28, p < 0.01). While the parameters are met for the confirmatory factor analysis, given the large variability in associations, additional analysis was conducted to compare each subcomponent for sleep.
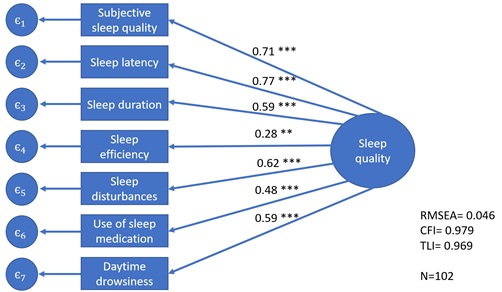 Figure 1: Factor structure of sleep characteristics assessed with the Pittsburgh Sleep Quality Index. The large circle represents the latent variable. Rectangles represent observed subcomponents of sleep quality.
In addition to the confirmatory factor analysis examining the latent structure of the PSQI components, additional analysis was conducted to determine the relationship between the individual sleep sub factors with each other respectively. In table 2, each sleep subcomponent is analyzed against all other sleep subcomponents using a gamma (Γ) test with associated chi-squared (Χ2) significance values. Subcomponents of sleep quality are reported in no specific order as there is no ranking for these subcomponents.
|
|
N |
Min |
Max |
M |
SD |
|
Sleep Components |
|||||
|
Subjective Sleep Quality |
102 |
0 |
3 |
1.21 |
0.762 |
|
Sleep Latency |
95 |
0 |
3 |
1.75 |
0.956 |
|
Sleep Duration |
99 |
0 |
3 |
1.02 |
0.728 |
|
Sleep Efficiency |
102 |
0 |
3 |
0.70 |
1.097 |
|
Sleep Disturbance |
95 |
0 |
3 |
1.42 |
0.594 |
|
Use of Sleeping Medication |
101 |
0 |
3 |
0.94 |
1.028 |
|
Daytime Dysfunction |
98 |
0 |
3 |
1.15 |
0.679 |
|
Overall Sleep Quality |
85 |
1 |
18 |
8.14 |
3.742 |
Table 2: Sleep components of grandparents.
- Subjective sleep quality
Subjective sleep quality is statistically significantly associated with each subsleep component; however, the strength and magnitude of these relationships vary notably. Subjective sleep quality is most closely associated with sleep latency with a Γ of 0.727 (p < 0.001). In descending order of strength association with subjective sleep quality following sleep latency, is sleep duration at gamma equals 0.652 (p < 0.001), sleep disturbance (Γ=0.641, p < 0.001), daytime dysfunction Γ equals 0.553 (p < 0.001), sleep efficiency (Γ=0.306, p=0.036), and lastly the use of sleep medication (Γ=0.123, p=0.002). Thus, there is a strong positive association between subjective sleep quality with sleep latency, sleep duration, and sleep disturbance with a moderate positive association with daytime dysfunction and sleep efficiency and a weak association with the use of sleeping medication.
- Sleep latency
Sleep latency is statistically significantly associated with each of the subcomponents. Additionally, all relationships are moderate or strong associations. The strongest association with sleep latency is with subjective sleep quality (Γ=0.727, p < 0.001), followed by sleep disturbance (Γ=0.613, p < 0.001), daytime dysfunction (Γ=0.610, p < 0.001), sleep duration (Γ=0.508, p < 0.001), use of sleeping medication (Γ=0.419, p=0.001) and has the smallest association with sleep efficiency (Γ=0.396, p=0.004).
- Sleep duration
Sleep duration is statistically significantly associated with each of the sleep subcomponents, and each relationship has moderate or strong associations. The strongest association with sleep duration is with sleep disturbance (Γ=0.673, p < 0.001), followed by subjective sleep quality (Γ=0.652, p < 0.001), sleep latency (Γ=0.508, p=0.004), sleep efficiency (Γ=0.467, p < 0.001) and use of sleeping medication (Γ=0.337, p= 0.009). Thus, there is a strong positive association between sleep duration with sleep disturbance and subjective sleep quality and a moderate relationship with sleep latency, daytime dysfunction, sleep efficiency, and use of sleeping medication.
- Sleep efficiency
Sleep efficiency is only statistically significantly associated with three other of the six subcomponent measures of sleep. There's not a statistically significant relationship between sleep efficiency with sleep disturbance (p=0.100), the use of sleeping medication (p=0.573), or daytime dysfunction (p=0.199). Sleep efficiency, however, is significantly associated with subjective sleep quality (Γ=0.306, p=0.036), sleep latency (Γ=0.396, p=0.004) and sleep duration (Γ=0.467, p < 0.001). Thus, sleep efficiency is not associated with sleep disturbance, use of sleeping medication, or daytime dysfunction. However, there is a moderate positive relationship between sleep efficiency and subjective sleep quality, sleep latency, and sleep duration.
- Sleep disturbance
Sleep disturbance is significantly associated with five of the six sleep subcomponents. Of these significant relationships that do exist, all are either strong or moderate, with the strongest being between sleep disturbance and sleep duration (Γ=0.673, p < 0.001), followed by subjective sleep quality (Γ=0.641, p < 0.001), sleep latency (Γ=0.613, p < 0.001), use of sleeping medication (Γ=0.575, p < 0.001) and weakest with daytime dysfunction (Γ=0.543, p < 0.001).
- Use of sleeping medication
The use of sleeping medication is significantly associated with five of the six sleep components as there is not a statistically significant relationship between use of sleep medication and sleep efficiency (p=0.573). Of the relationships that do exist with sleep medication, the strongest is with daytime dysfunction (Γ=0.592, p < 0.001) followed by sleep disturbance (Γ=0.575, p < 0.001), sleep latency (Γ=0.419, p= 0.001), subjective sleep quality (Γ=0.417, p=0.002) and sleep duration (Γ=0.337, p=0.009). To that end, use of sleeping medication has a significant positive association with each sleep subcomponent except for sleep efficiency.
- Daytime dysfunction
Daytime dysfunction is associated with a statistically significant relationship with all sleep subcomponents except for sleep efficiency (p=0.199). Daytime dysfunction has the strongest association with sleep latency (Γ=0.610, p < 0.001), followed by use of sleeping medication (Γ=0.592, p < 0.001), subjective sleep quality (Γ=0.553, p < 0.001), sleep disturbance (Γ=0.543, p < 0.001) and weakest with sleep duration (Γ=0.045, p=0.006). Thus, daytime dysfunction positively correlates with each of these sleep components except for sleep efficiency. While the confirmatory factor analysis indicates that the seven sleep subcomponents of the PSQI are a single factor, additional analysis of those sleep subcomponents against each other suggests that not all sleep subcomponents are significantly associated with each of the different sleep subcomponents. More specifically, subjective sleep quality, sleep latency, and sleep duration are all significantly associated with the other six sleep components, respectively. Three subcomponents are significantly associated with all but one other subcomponent: sleep disturbance with sleep efficiency, use of sleeping medication with sleep efficiency, and daytime dysfunction with sleep efficiency (Table 3).
|
Analysis |
Analysis |
|||||||||
|
|
N |
Γ |
p |
sig |
|
N |
Γ |
p |
sig |
|
|
Subjective Sleep Quality |
Sleep Disturbance |
|||||||||
|
Sleep Latency |
95 |
0.727 |
< 0.001 |
*** |
Subjective Sleep Quality |
95 |
0.641 |
< 0.001 |
*** |
|
|
Sleep Duration |
99 |
0.652 |
< 0.001 |
*** |
Sleep Latency |
89 |
0.613 |
< 0.001 |
*** |
|
|
Sleep Efficiency |
102 |
0.306 |
0.036 |
* |
Sleep Duration |
93 |
0.673 |
< 0.001 |
*** |
|
|
Sleep Disturbance |
95 |
0.641 |
< 0.001 |
*** |
Sleep Efficiency |
95 |
0.28 |
0.1 |
||
|
Use Sleeping Medication |
101 |
0.123 |
0.002 |
** |
Use Sleeping Medication |
94 |
0.575 |
< 0.001 |
*** |
|
|
Daytime Dysfunction |
98 |
0.553 |
< 0.001 |
*** |
Daytime Dysfunction |
92 |
0.543 |
< 0.001 |
*** |
|
|
Sleep Latency |
Use Sleeping Medication
|
|||||||||
|
Subjective Sleep Quality |
95 |
0.727 |
< 0.001 |
*** |
Subjective Sleep Quality |
101 |
0.417 |
0.002 |
** |
|
|
Sleep Duration |
94 |
0.508 |
< 0.001 |
*** |
Sleep Latency |
94 |
0.419 |
0.001 |
** |
|
|
Sleep Efficiency |
95 |
0.396 |
0.004 |
** |
Sleep Duration |
98 |
0.337 |
0.009 |
** |
|
|
Sleep Disturbance |
89 |
0.613 |
< 0.001 |
*** |
Sleep Efficiency |
101 |
0.079 |
0.573 |
||
|
Use Sleeping Medication |
94 |
0.419 |
0.001 |
** |
Sleep Disturbance |
94 |
0.575 |
< 0.001 |
*** |
|
|
Daytime Dysfunction |
93 |
0.61 |
< 0.001 |
*** |
Daytime Dysfunction |
97 |
0.592 |
< 0.001 |
*** |
|
|
Sleep Duration
|
Daytime Dysfunction
|
|||||||||
|
Subjective Sleep Quality |
99 |
0.652 |
< 0.001 |
*** |
Subjective Sleep Quality |
98 |
0.553 |
< 0.001 |
*** |
|
|
Sleep Latency |
94 |
0.508 |
< 0.001 |
*** |
Sleep Latency |
93 |
0.61 |
< 0.001 |
*** |
|
|
Sleep Efficiency |
99 |
0.467 |
< 0.001 |
*** |
Sleep Duration |
96 |
0.405 |
0.006 |
** |
|
|
Sleep Disturbance |
93 |
0.673 |
< 0.001 |
*** |
Sleep Efficiency |
98 |
0.196 |
0.199 |
||
|
Use Sleeping Medication |
98 |
0.337 |
0.009 |
** |
Sleep Disturbance |
92 |
0.543 |
< 0.001 |
*** |
|
|
Daytime Dysfunction |
96 |
0.405 |
0.006 |
** |
Use of Sleeping Medication |
97 |
0.592 |
< 0.001 |
*** |
|
|
Sleep Efficiency |
||||||||||
|
Subjective Sleep Quality |
102 |
0.306 |
0.036 |
* |
|
|||||
|
Sleep Latency |
95 |
0.396 |
0.004 |
** |
||||||
|
Sleep Duration |
99 |
0.467 |
< 0.001 |
*** |
||||||
|
Sleep Disturbance |
95 |
0.28 |
0.1 |
|||||||
|
Use Sleeping Medication |
101 |
0.079 |
0.573 |
|||||||
|
Daytime Dysfunction |
98 |
0.196 |
0.199 |
|||||||
Table 3: PSQI components.
Discussion
Sleep is essential and when inadequate increases the risk of diseases and negative health outcomes which impacts caregivers' health and their ability to provide adequate care. Accurate measurement of sleep quality is particularly clinically significant as studies have shown the impact poor sleep has on mental health and physical health [1,2] for some older adults, can impact depressive symptoms of custodial grandparents providing full-time care for their grandchildren [21]. The purpose of this research is to report sleep quality averages and to evaluate the factor structure of the PSQI, the association of each of the components with each other; all within a population of custodial grandparents. Key findings are that sleep disturbance, sleep latency, and subjective sleep quality are the only subcomponents that are significantly associated with each of the sleep component. Additionally, the closest associations are: between both subjective sleep and sleep latency; sleep duration most with sleep disturbance. The greatest variance of subcomponents with from subjective sleep quality.
A large study of Chinese adults aged 45 and older found that a two-factor model, with sleep-efficiency and sleep quality derived from the PSQI, is a better model fit than the one-factor or three factor model. Their one factor model reported a low Comparative Index Fit (CFI) (0.805) and high Root Mean Square Error of Approximation (RMSEA) (0.161) value, indicating poor model fit [23]. In contrast, our one-factor model indicated good fit for RMSEA (0.046), CFI (0.979) and TLI (0.969).
A three-factor model of the PSQI for studies of older adults shows better fit than a two or single-factor model. Cole et al., [24], achieved a perfect fit with the three-factor model consisting of sleep efficiency, perceived sleep quality and daily disturbances. The same latent variables of perceived sleep quality, sleep efficiency and daily disturbances were the factor loading for the three-factor model. However, Becker and de Neves Jesus [25] excluded sleep medications in order to achieve the three-factor model fit. It is important to note that the RMSEA and CFI values, 0.046 and 0.986 respectively, for the three-factor model excluding the sleep medication were similar to our one-factor model that include sleep medication and reported similar RMSEA and CFI values (0.046 and 0.979 respectively).
The discussion section will further examine studies evaluating the factor structure of the PSQI and three sleep subcomponents that were most significantly associated with the other sleep components. Sleep duration, actual hours of sleep per night, is an integral component of sleep quality and a myriad of health outcomes; particularly for older adults who age with concomitant multimorbidity, polypharmacy, and psychosocial factors that impact sleep [26,27]. Measuring sleep duration with the PSQI, a large study of older adults living in nursing homes, found that participants with very long sleep duration of more than 9 hours were significantly more likely to report being adequately physically active [28]. This is counterintuitive, because we usually associate long sleep with poorer health outcomes. Umbrella review of meta-analyses found that both sleep disturbance and sleep quality are associated with mortality and nutritional diseases [29]. It could be that disturbed sleep and the time it takes to get to sleep, sleep latency, impact diet and contributes to nutritional diseases [30].
- Study limitations
This study included a convenience sample due to the limitations of COVID-19. We collected our data during this time, but the focus was not on dealing with the effects; therefore, we did not ask whether anyone in the household currently had COVID-19 or had it in the past. Custodial grandparents with an active case of COVID-19 may have experienced additional challenges and could have provided different sleep quality results. Additionally, other changes during caregiving could have impacted the custodial grandparent household: stressors of managing households alongside the pandemic; changes to children losing their primary and/or secondary caregiver because of the pandemic. All may have impacted participant sleep quality. A strength of our study is that grandparents are typically considered older adults, but our study found that more of them may be younger. Our sample found grandparents may be younger than traditional thought, perhaps providing different sleep data with different generations.
Conclusion
The study have provided more insight into custodial grandparents sleep quality. Overall well-being is directly related to sleep. Our findings on the sleep quality of custodial grandparents during COVID-19 expands on previous studies by examining the relationship of sleep quality and custodial grandparents, and the factor loading for the PSQI sleep quality components examined in older adult populations. Future research should focus on sleep quality between younger and older grandparents.
References
- Reid KJ, Martinovich Z, Finkel S, Statsinger J, Golden R, et al. (2006) Sleep: A marker of physical and mental health in the elderly. Am J Geriatr Psychiatry 14: 860-866.
- Atkinson G, Davenne D (2007) Relationships between sleep, physical activity and human health. Physiol Behav 90: 229-235.
- Lee MH, Min A, Park C, Kim I (2023) How do sleep disturbances relate to daytime functions, care-related quality of life, and parenting interactions in mothers of children with autism spectrum disorder? J Autism Dev Disord 53: 2764-2772.
- United States Census Bureau (2019) National Grandparents Day: September 10, 2023. United States Census Bureau, Maryland, USA.
- Baker LA, Mutchler JE (2010) Poverty and Material Hardship in Grandparent-Headed Households. J Marriage Fam 72: 947-962.
- Smith GC, Hayslip Jr B, Webster BA (2019) Psychological difficulties among custodial grandchildren. Children and Youth Services Review 104: 104390.
- Chien MY, Chen HC (2015) Poor sleep quality is independently associated with physical disability in older adults. J Clin Sleep Med 11: 225-232.
- Li S, Xu H, Li Y (2023) Influence of grandparenting stress, sleep quality, and grandparenting type on depressive symptoms among Chinese older adults who care for their grandchildren: A moderated-mediation study. Current Psychology 42: 4630-4640.
- Becker NB, Jesus SN, João KADR, Viseu JN, Martins RIS (2017) Depression and sleep quality in older adults: A meta-analysis. Psychol Health Med 22: 889-895.
- Mishra AA, Friedman EM, Mihalec-Adkins BP, Evich CD, Christ SL, et al. (2020) Childhood maltreatment exposure and physical functional limitations in late adulthood: Examining subjective sleep quality in midlife as a mediator. Psychol Health 35: 573-592.
- Henig RM (2022) The devastating loss of grandparents among one million COVID dead. Scientific American Mind 33: 36-38.
- Xu Y. Wu Q, Levkoff SE, Jedwab M (2020) Material hardship and parenting stress among grandparent kinship providers during the COVID-19 pandemic: The mediating role of grandparents’ mental health. Child Abuse Negl 110: 104700.
- Gupta P, Srivastava N, Gupta V, Tiwari S, Banerjee M (2022) Association of sleep duration and sleep quality with body mass index among young adults. J Family Med Prim Care 11: 3251-3256.
- Jaqua EE, Hanna M, Labib W, Moore C, Matossian V (2023) Common sleep disorders affecting older adults. Perm J 27: 122-132.
- Kovácová K, Stebelová K (2021) Sleep characteristics according to gender and age measured by wrist actigraphy. Int J Environ Res Public Health 18: 13213.
- Manzar MD, BaHammam AS, Hameed UA, Spence DW, Pandi-Perumal SR, et al. (2018) Dimensionality of the Pittsburgh sleep quality index: A systematic review. Health Qual Life Outcomes 16: 89.
- Holmes EA, O'Connor RC, Perry VH, Tracey I, Wessely S, et al. (2020) Multidisciplinary research priorities for the COVID-19 pandemic: A call for action for mental health science. Lancet Psychiatry 7: 547-560.
- Alodhayani AA, Almutairi KM, Altasan Z, AlKhaldi G, Aljasser A (2023) Impact of quarantine on sleep quality and psychological status in COVID-19 suspected cases in Riyadh, Saudi Arabia. J King Saud Univ Sci 35: 102529.
- Hajek A, König HH (2022) Loneliness, perceived isolation and sleep quality in later life. Longitudinal evidence from a population-based German study. Arch Gerontol Geriatr 103: 104795.
- Buysse DJ, Reynolds CF 3rd, Monk TH, Berman SR, Kupfer DJ (1989) The Pittsburgh Sleep Quality Index: A new instrument for psychiatric practice and research. Psychiatry Res 28: 193-213.
- Stearns MA, Nadorff DK (2020) The Moderation of Raising One's Grandchildren on the Relation Between Sleep and Depressive Symptoms. Nat Sci Sleep 12: 615-626.
- Zitser J, Allen IE, Falgàs N, Le MM, Neylan TC, et al. (2022) Pittsburgh Sleep Quality Index (PSQI) responses are modulated by total sleep time and wake after sleep onset in healthy older adults. PLoS One 17: 0270095.
- Chong AM, Cheung C (2012) Factor structure of a Cantonese-version Pittsburgh sleep quality index. Sleep and Biological Rhythms 10: 118-125.
- Cole JC, Motivala SJ, Buysse DJ, Oxman MN, Levin MJ, et al. (2006) Validation of a 3-factor scoring model for the Pittsburgh sleep quality index in older adults. Sleep 29: 112-116.
- Becker NB, de Neves Jesus S (2017) Adaptation of a 3-factor model for the Pittsburgh Sleep Quality Index in Portuguese older adults. Psychiatry Res 251: 298-303.
- Zaidel C, Musich S, Karl J, Kraemer S, Yeh CS (2021) Psychosocial factors associated with sleep quality and duration among older adults with chronic pain. Popul Health Manag 24: 101-109.
- Hamza SA, Saber HG, Hassan N (2019) Relationship between sleep disturbance and polypharmacy among hospitalized elderly. EJGG 6: 34-37.
- Štefan L, Vrgoc G, Rupcic T, Sporiš G, Sekulic D (2018) Sleep duration and sleep quality are associated with physical activity in elderly people living in nursing homes. Int J Environ Res Public Health 15: 2512.
- Gao C, Guo J, Gong TT, Lv JL, Li XY, et al. (2022) Sleep duration/quality with health outcomes: An umbrella review of meta-analyses of prospective studies. Front Med (Lausanne) 8: 813943.
- Frank S, Gonzalez K, Lee-Ang L, Young MC, Tamez M, et al. (2017) Diet and sleep physiology: public health and clinical implications. Front Neurol 8: 393.
Citation: Clark KC, Mayfield KE, Anderson RK (2024) Confirmatory Factor Analysis of Sleep Quality among Grandparents Raising Grandchildren. J Gerontol Geriatr Med 10: 200.
Copyright: © 2024 Clark KC, et al. This is an open-access article distributed under the terms of the Creative Commons Attribution License, which permits unrestricted use, distribution, and reproduction in any medium, provided the original author and source are credited.