Continuous Glucose Monitoring Sensor Postprandial Plasma Glucose Waveform Study of Breakfasts at McDonald’s using the GH-Method: Math-Physical Medicine
*Corresponding Author(s):
Gerald C. HsuEclaire Md Foundation, United States
Tel:+1-510-331-5000,
Email:j.kwan@eclairemd.com
Abstract
The author was inspired to research his own meals by reading a recent news of the sugar content in Irish Subway’s bread (see Method section). Could his personal dining data at another popular chain restaurant, McDonald’s, be applied under an amplified examination? International franchise restaurants usually operate under universal management guidance issued by its headquarters regarding the business style, standard operating procedures (SOP), and some selected food material supplies from the central kitchen. He is quite sure that some local franchisees may attempt to make changes to meet their local business, operation, or environmental needs. However, if they change the food ingredients or certain nutritional amounts, similar to the incident with the Subway franchises in Ireland, then the impact on their customer’s health conditions can be identified and traced.
After reading that specific news, the author decided to review his collected 4,050 meals data from 5/5/2018 to 1/18/2020 (1,350 days). First, he sorted them into four different national groups: the US, UK/Canada, Japan, and Taiwan. Then, he investigated their continuous glucose monitor (CGM) sensor postprandial plasma glucose (PPG) waveforms and data.
The author finally proved the linkage between McDonald’s carbs/sugar amount and his sensor PPG wave characteristics via a comparison study of Japan vs. US and Taiwan vs. US as listed below. A similar finding also existed between Japan vs. UK/Canada and Taiwan vs. UK/Canada.
Japan vs. US
carbs 87%, glucose 93%-96%
Taiwan vs. US
carbs 79%, glucose 90%-92%
Japan vs. UK/Canada
carbs 76%, glucose 93%-97%
Taiwan vs. UK/Canada
carbs 69%, glucose 91%-97%
The reduction of 13% to 31% on carbs/sugar amount in the McDonald’s muffin has resulted in a <10% glucose reduction on three PPG levels, average, peak, and maximum. In fact, this finding is not as severe as the impact when adding more than 8% sugar into bread to attract more customers in the Irish Subway case. The author can definitely calculate how much PPG increase amount for diabetes patients in Ireland will be from this extra 8% of sugar added into Subway’s bread in Ireland.
The author speculates the additional value of this study in regard to his ready acquired diabetes knowledge. However, it has indeed reinforced his prior findings concerning the high correlation existed between his carbs/sugar intake amount and his measured PPG value. Nevertheless, it is still a remarkably interesting side-track research project for him. The article addresses the business decision-making and operational practice versus the price paid to influence customers, using the entry point of glucose variance. In addition, he has learned more about the glucose waveform characteristics by using various tools from his developed GH-Method: math-physical medicine.
Keywords
GH-Method; Franchise; Postprandial; Subway; Waveform
Introduction
The author was inspired to research his own meals by reading a recent news of the sugar content in Irish Subway’s bread (see Method section). Could his personal dining data at another popular chain restaurant, McDonald’s, be applied under an amplified examination? International franchise restaurants usually operate under universal management guidance issued by its headquarters regarding the business style, standard operating procedures (SOP), and some selected food material supplies from the central kitchen. The author is quite sure that some local franchisees may attempt to make changes to meet their local business, operation, or environmental needs. However, if they change the food ingredients or certain nutritional amounts, similar to the incident with the Subway franchises in Ireland, then the impact on their customer’s health conditions can be identified and traced.
After reading that specific news, the author decided to review his collected 4,050 meals data from 5/5/2018 to 1/18/2020 (1,350 days). First, he sorted them into four different national groups: the US, UK/Canada, Japan, and Taiwan. Then, he investigated their continuous glucose monitor (CGM) sensor postprandial plasma glucose (PPG) waveforms and data.
Methods
Inspiration
The author recently read a news article, “Ireland’s Supreme Court rules Subway sandwiches have too much sugar to meet legal definition of bread,” in Market Watch, published on October 1, 2020, and written by Quentin Fottrell.
Here is the excerpt:
“Ireland's Supreme Court ruled this week that Subway sandwiches are more pastry than bread.
The nation’s highest court ruled on Tuesday that bread in the franchise’s sandwiches do not meet the legal definition of bread and are, therefore, subject to a value added tax of 13.5%. Ireland’s VAT Act of 1972 states that ingredients in bread such as sugar and fat should not exceed 2% of the weight of flour in the dough, the five-judge bench said. In Subway sandwiches, that weight hovers at 10%. Irish Subway franchisee Book finders Ltd. appealed a decision by a lower court. The Supreme Court’s decision ends a 14-year-long court battle.”
To the author, this news is not only a legal or business story, but rather an interesting medical subject regarding nutritional ingredients in franchise restaurant food and their direct linkage or impact to diabetes patient’s glucose level.
Methodology Background
To learn more about his developed GH-Method: math-physical medicine (MPM) research methodology, readers can review his articles, Biomedical research methodology based on GH-Method: math-physical medicine (No. 54 and No. 310) [1].
Diabetes history
The author has suffered from type 2 diabetes (T2D) since 1995. In 2010, his average glucose reached 280 mg/dL with HbA1C of 10%. At that time, he began his self-study and a decade-long research on endocrinology, diabetes, and food nutrition. Along the way, he developed a sophisticated mathematical model of metabolism, plus four prediction models of weight, PPG, fasting plasma glucose (FPG), and A1C from 2014 to 2017. He also applied food nutrition, optical physics, and artificial intelligence (AI) techniques to develop a PPG prediction model utilizing a meal or food photo which is stored on the iPhone and a cloud server. These AI predicted PPG values reached an extremely high accuracy level of 98.8% based on ~6,000 consumed meals. He then simplified his glucose research work into a simple linear equation to predict the PPG level based on FPG value, carbs/sugar intake amount, and post-meal walking steps as follows:
Predicted PPG
= 0.97 * FPG + (carbs/sugar grams * 1.8) - (post-meal walking steps in thousand * 5) + ((weather temperature - 77)/5)*0.3
Procedures in this study
Through his data mining effort, he discovered 265 meals (6.5%) data from eating at McDonalds’ restaurants from his total 4,050 meals from 5/5/2018 to 1/18/2020. On 5/5/2018, he started to collect 13 glucoses each meal and 80 glucoses each day via a CGM sensor glucose monitoring device (Sensor PPG) on his arm. He stopped dinning out since 1/19/2020 when he started his COVID-19 self-quarantined life. He did not order any cooked food or pre-made meals from restaurants or supermarkets over the past ~10 months.
He separated his collected data into four national groups: USA, UK & Canada, Japan, and Taiwan. He then calculated the number of meals in each group, their respective average PPG via finger-piercing method (Finger PPG), average carbs/sugar amount in grams, average post-meal walking exercise in each 100 steps for the purpose of graphing and easier data comparison. He quickly realized from his collected Finger PPG data that they are almost “useless” for this particular investigation. Finger PPG values are measured at two-hours after the first bite of meal which usually matches with the “lowest” point on the 3-hour long PPG curve (or waveform). The subtle waveform differences of PPG cannot be observed via a single datapoint of the Finger PPG [2]. He must utilize the entire glucose waveform (or glucose curve) to identify some subtle but significant glucose differences.
He then compared the average sensor PPG data, waveform’s peak PPG data (usually occurring approximately 60-minutes after the first-bite), and maximum of PPG data of any single day or a period via candlestick K-line model [3]. This is an existing and popular financial analysis tool from Wall Street which was originated from a rice trading market of Osaka, Japan. The K-line or Candlestick model can show five vital glucose data on one candlestick symbol: open, close, maximum, minimum, and average glucoses, which is similar to the different price points on a daily stock trading.
Results
(Figure 1) shows the background data table of PPG from 0-minute to 180-minutes, at each 15-minute intervals, for the four groups.
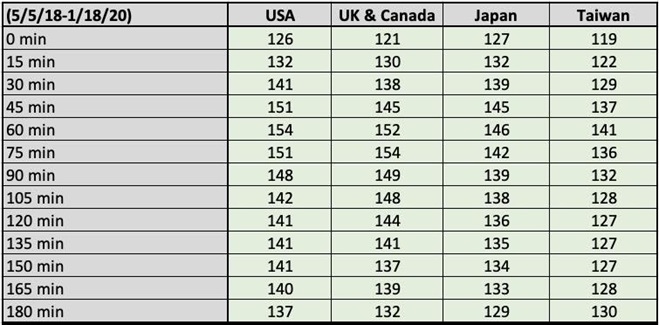 Figure 1: Background data table of glucoses.
In (Figure 2) it places the PPG curves of these four national groups on one diagram. First, these four curves are similar in shape and moving trend, with the PPG climbing to a peak around 60-minutes (except for the UK/Canada peak at 75-minutes), and then winding down (except for Taiwan which trends up a bit at the end). Secondly, the US and UK/Canada are quite similar to each other in terms of fluctuations (glucose waveforms with a correlation of 94%) and with an equal height of amplitudes (with both peak glucose levels are at 154 mg/dL). Thirdly, the Taiwan curve has the lowest PPG peak at 141 mg/dL, while the Japan curve is located in the middle between US/UK-Canada and Taiwan with a median PPG peak at 146 mg/dL [4].
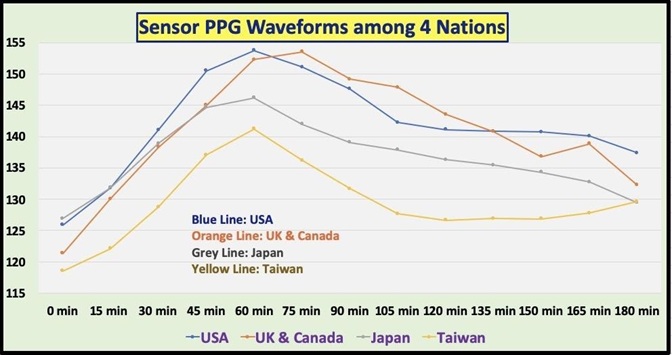 Figure 2: PPG waveform comparison of 4 national group.
(Figure 3) illustrates the background data of the number of meals, carbs/sugar intake amount in grams, post-meal walking exercise in 100-steps, for the four national groups.
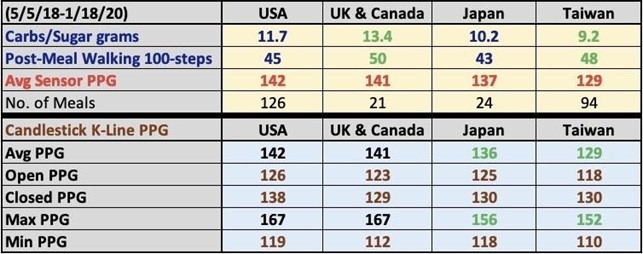 Figure 3: Background data table of vital data and Candlestick data.
In (Figure 4) the bars reflect the carbs/sugar intake amount in grams, post-meal walking exercise in 100-steps, and average sensor PPG for four national groups.
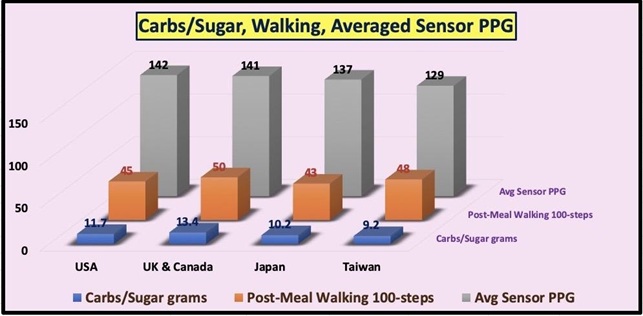 Figure 4: Comparison of carbs/sugar, post-meal walking steps, and averaged sensor PPG.
(Figure 5) depicts the bars of five vital PPG K-Line candlestick values: open glucose, close glucose, maximum glucose, minimum glucose, and average glucose for the four national groups.
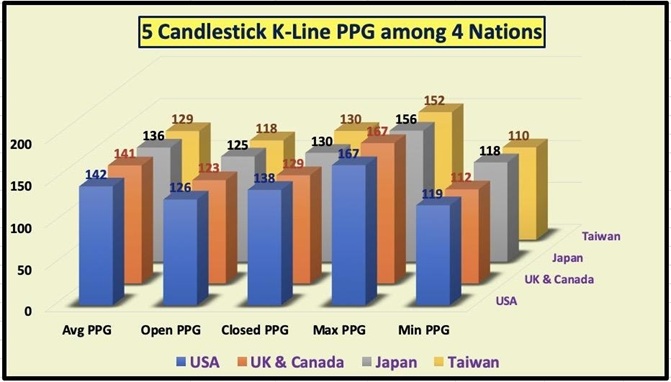 Figure 5: Comparison of 5 K-Line Candlestick vital data.
The six listed statistical correlation coefficients, or R, consisting of six pairs of the PPG waveforms are shown in (Figure 6).
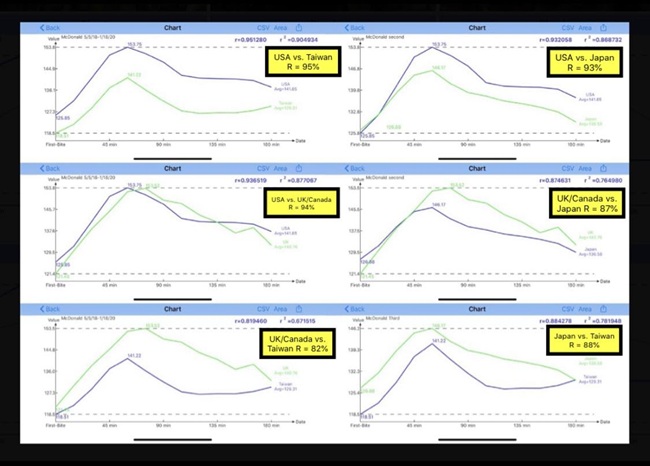 Figure 6: Correlation coefficients of 6 pairs of PPG.
Listed below are the R values:
- USA vs. Taiwan: R = 95%
- USA vs. UK/Canada: R = 94%
- UK/Canada vs. Taiwan: R = 82%
- USA vs. Japan: R = 93%
- UK/Canada vs. Japan: R = 87%
- Japan vs. Taiwan: R = 88%
In summary, these six-correlation coefficients are greater than 80%, between 82% and 95%, which are extremely high correlation values. This means that all of these four PPG waveforms from these groups are similar to each other with the shapes and moving trends. The differences are shown in other parameters, such as the peak glucose values and Candlestick characteristics.
(Figure 7) reveals all of the four candlestick characteristics of the four groups. The candlestick chart will show the extremity values, such as maximum and minimum PPG values, different from the time-series diagram only show the average PPG values which would hide the extremities from showing like the time-series graphic diagram Figure 2.
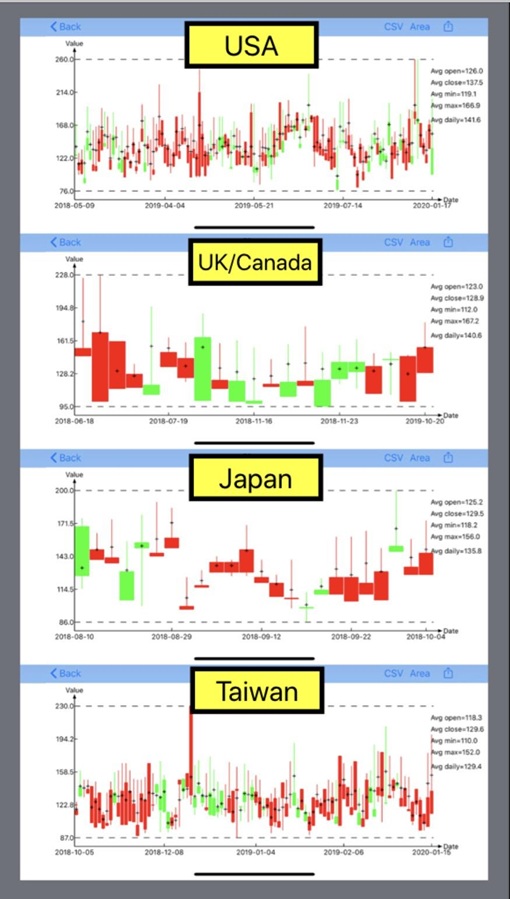 Figure 7: 5 K-Line Candlestick vital data of 4 national groups.
The author has consumed 265 meals (6.5%) at McDonald’s from the total 4,050 meals over this period of 1,350 days. This is quite a large amount of eating at one particular franchise restaurant. Some of his friends questioned him about his decision or reasons. He conducted research on food nutrition and diabetes for over 10 years and learned that all food has both positive and negative impacts on the body. For T2D patients, it is not only eating the “right” food (actually, there is no 100% right food), but sometimes the portion size of food is more important than the food type for their glucose control. Meals in the McDonald’s restaurants may contain some “bad” ingredients for diabetes, but due to its economic concerns for low price via low cost, it usually offers a smaller portion as compared to other restaurants, particularly the McDonald’s breakfast meal. At McDonald’s, the author only eats one muffin, one egg, a piece of ham or sausage, and a cup of decaf-coffee. In order to control his carbs/sugar intake amount, since the egg, ham, sausage, and decaf-coffee have almost no influences on glucose, he decided to eat only half of the muffin. That is why his carbs/sugar intake amounts are between 9.2 grams to 13.4 grams.
As cited above regarding the Subway’s bread with the sugar content of 10% in Ireland, the carbs and sugar amount are concentrated in the muffin only, for the McDonald’s breakfast meal.
Let us re-examine the key data as follows, with a ranked order of the US / UK-Canada / Japan / Taiwan:
Carbs/sugar (grams)
11.7/ 13.4 / 10.2 / 9.2
Average PPG (mg/dL)
142 / 141 / 137 / 129
Peak on PPG waveform (mg/dL)
154 / 154 / 146 / 141
Maximum PPG candlestick (mg/dL)
167 / 167 / 156 / 152
It is obvious that these four data follow almost the same trending order from high value to low value, starting from the highest in Western countries (US, UK, Canada) down to the middle in Japan, and then the lowest in Taiwan. When he puts the averaged PPG, peak PPG, and Maximum PPG together into a group of “Glucose”, he sees the direct linkage between Carbs/Sugar amounts and Glucose values. Since the author utilized the same AI technique to estimate his carbs/sugar intake amount from his meal/food photos, all of his post-meal walking steps are within the range of 4,300 to 5,000, which is more than 4,000 steps. Therefore, the deciding factor for his PPG values is the carbs/sugar intake amount, where he did not take any diabetes medication during this period.
Based on his memory, the muffin in Japan seemed a bit smaller than his Western muffin (US/UK/Canada), while in Taiwan he even felt his muffin seemed a bit fluffier (means less dough and more yeast) than the Western muffin. He reasoned that this contributed to his lower amount of carbs/sugar amount in his muffins from both Japan and Taiwan. The author was a successful businessman before entering the medical research field. Therefore, he does understand how to manage a business in regard to cost cutting, price reducing, and profit boosting, especially for a lower priced but highly competitive businesslike McDonald’s. In this study, he is a medical research scientist who is searching for the possible reasons behind his observed glucose waveform differences. He has no intention to criticize McDonald’s or its franchises in Japan and Taiwan; however, science is based on evidence, where the truth is the most important and only ingredient for scientific research.
Conclusions
The author finally proved the linkage between McDonald’s carbs/sugar amount and his sensor PPG wave characteristics via a comparison study of Japan vs. US and Taiwan vs. US as listed below. A similar finding also existed between Japan vs. UK/Canada and Taiwan vs. UK/Canada.
Japan vs. US
carbs 87%, glucose 93%-96%
Taiwan vs. US
carbs 79%, glucose 90%-92%
Japan vs. UK/Canada
carbs 76%, glucose 93%-97%
Taiwan vs. UK/Canada
carbs 69%, glucose 91%-97%
The reduction of 13% to 31% on carbs/sugar amount in the McDonald’s muffin has resulted in a <10% glucose reduction on three PPG levels, average, peak, and maximum. In fact, this finding is not as severe as the impact when adding more than 8% sugar into bread to attract more customers in the Irish Subway case. The author can definitely calculate how much PPG increase amount for diabetes patients in Ireland will be from this extra 8% of sugar added into Subway’s bread in Ireland.
The author speculates the additional value of this study in regard to his ready acquired diabetes knowledge. However, it has indeed reinforced his prior findings concerning the high correlation existed between his carbs/sugar intake amount and his measured PPG value. Nevertheless, it is still a remarkably interesting side-track research project for him. The article addresses the business decision-making and operational practice versus the price paid to influence customers, using the entry point of glucose variance. In addition, he has learned more about the glucose waveform characteristics by using various tools from his developed GH-Method: math-physical medicine.
References
- Hsu GC (2020) Biomedical research methodology based on GH-Method: math-physical medicine. J Gene Engg Bio Res 4:116-124.
- Hsu GC (2020) Postprandial Plasma Glucose Behavior based on six breakfasts by using AI Glucometer and GH-Method: math-physical medicine. J Gene Engg Bio Res 2: 27-30.
- Hsu GC (2019) Using Candlestick Charting Techniques to Investigate Glucose Behaviors via GH-Method: Math-Physical Medicine. eScientific 2: 1-3.
- Hsu GC (2020) Comparison study of PPG characteristics from candlestick model using GH-Method: Math-Physical Medicine. Hsu GC (2020) Comparison Study of PPG Characteristics from Candlestick Model Using GH-Method: Math-Physical Medicine. J Nutr Diet Prac 4: 1-6.
Citation: Hsu GC (2020) Continuous Glucose Monitoring Sensor Postprandial Plasma Glucose Waveform Study of Breakfasts at McDonald’s using the GH-Method: Math-Physical Medicine. J Community Med Public Health Care 7: 074.
Copyright: © 2020 Gerald C. Hsu, et al. This is an open-access article distributed under the terms of the Creative Commons Attribution License, which permits unrestricted use, distribution, and reproduction in any medium, provided the original author and source are credited.