Correlating Calculated Muscle Mass with other Components of Sarcopenia in Older Hospitalized Patients
*Corresponding Author(s):
Tu Ngoc NguyenWestmead Applied Research Centre, Faculty Of Medicine And Health, The University Of Sydney, Sydney, New South Wales, Australia
Tel:+61 288903125,
Email:ngoc.tu.nguyen@sydney.edu.au
Abstract
Objectives: This study aims to examine (1) the correlations between muscle mass estimated by simple anthropometric equations based on age, sex, height, and weight in older hospitalized patients, and (2) the correlations of the estimated muscle mass with other indicators of sarcopenia.
Methods: Patients aged ≥60 admitted to a hospital in Vietnam from 12/2018-6/2019 were recruited. Muscle mass was estimated using three different anthropometric equations. Correlations of the estimated muscle mass values were assessed by Intraclass Correlation Coefficient (ICC). Correlations between muscle mass with grip strength and walking speed were assessed by Spearman correlation.
Results: There were 251 participants, median age 72, 39.4% female. The average ICC was 0.93 (95%CI 0.90-0.95, p<0.001) in women, and 0.95 (95%CI 0.94-0.96, p<0.001) in men. Spearman correlation coefficients between muscle mass identified by the three equations with grip strength were 0.55-0.65 in men, 0.45-0.51 in women, and with walking speed were 0.35-0.42 in men, 0.38-0.43 in women.
Conclusion: There was a strong correlation of muscle mass values estimated by simple anthropometric equations in the studied participants. The estimated muscle mass showed a moderate correlation with grip strength. Further studies are needed to examine the validity and applicability of simple anthropometric equations in diverse populations.
Keywords
Anthropometric equations; Muscle mass; Older hospitalized patients; Sarcopenia
INTRODUCTION
Ageing and chronic health conditions can increase the risk of muscular loss and sarcopenia [1]. Sarcopenia, defined as an age-related decline in skeletal muscle mass and muscle function, can increase the risk of physical impairment, poorer quality of life, falls, disability and mortality [2]. According to current guidelines and consensus, the definition of sarcopenia required measurements of muscle mass, muscle strength (such as handgrip strength) and physical performance (such as walking speed) [2-4]. Anthropometric equations have been validated in estimating muscle mass [2,5]. Among the proposed anthropometric equations, there are several simple equations that based on routinely collected data such as age, sex, height and weight [5]. In older hospitalized patients, the risk of reduced muscle mass is high due to the combined effects of aging, altered metabolic function, reduced physical activity and nutritional changes [1]. Early detection of low muscle mass in older hospitalized patients can be a strategic step in early detection or prevention of sarcopenia. Anthropometric equations based on routinely collected data such as age, sex, height and weight could be a practical method in estimating muscle mass in older hospitalized patients, especially in resource-limited settings.
Therefore, in this study we aimed to compare different simple anthropometric equations based on age, sex, height and weight in estimating muscle mass in older hospitalized patients in Vietnam. The specific aims are to examine (1) the correlations of muscle mass values estimated by simple anthropometric equations based on age, sex, height, and weight in older hospitalized patients, and (2) the correlations of muscle mass estimated by these equations with other indicators of sarcopenia such as handgrip strength and walking speed.
METHODS
This study is a secondary analysis from a study conducted at a tertiary hospital in Vietnam, which was designed to examine the impact of sarcopenia in older hospitalized patients with cardiovascular diseases. The detailed method of that study is described in our previous publication [6]. In brief, consecutive patients aged 60 years or older admitted to the Cardiology and Interventional Cardiology Departments of Thong Nhat Hospital, Ho Chi Minh City, Vietnam were recruited from 12/2018 to 4/2019. The study was approved by the ethics committees of the University of Medicine and Pharmacy in Ho Chi Minh City and Thong Nhat Hospital, Ho Chi Minh City, Vietnam. Written informed consent was obtained from all participants.
Anthropometric equations
We focused on simple anthropometric equations based on age, sex, height and weight. In this study, we did not focus on equations that included other components such as waist circumference, upper arm circumference, thigh and calf circumferences, limb length… as these measurements are not routinely measured in hospitalised patients in Vietnam. To obtain details of simple anthropometric equations, we referred to the systematic review “Predicting muscle mass from anthropometry using magnetic resonance imaging as reference” conducted by Al-Gindan et al. [5]. From this review, we found one study that applied a simple anthropometric equation based on age, sex, height and weight, in estimating muscle mass [7]. We conducted further search on PubMed using searching terms (“anthropometric equation”) AND (“muscle mass” OR “sarcopenia”) from database inception to May 2020. With this searching strategy, we found 90 abstracts. After reading through the abstracts, full texts and relevant references, we found two more studies that originally proposed simple anthropometric equations based on age, sex, height and weight in estimating muscle mass [8,9]. A summary of these three studies is presented in table 1.
|
Authors, year |
Country |
Population |
Sample size |
Equations |
Validation method |
|
Lee et al., [7] |
China |
Aged 20-81 (mean 40) |
244 (135 men, 109 women) |
(0.244*weight) + (7.8*height) + (6.6*sex) - (0.098*age) - 4.5 Sex=0 for women, =1 for men Weight in kg, height in m, age in years |
Magnetic Resonance Imaging (MRI) |
|
Wen et al., [8] |
China |
Aged 18-69 (mean 39) |
763 (345 men, 418 women) |
(0.193*weight) + (0.107*height) + (4.157*sex) - (0.037*age) - 2.631 Sex=2 for women, =1 for men Weight in kg, height in m, age in years |
Dual Energy X-Ray Absorptiometry (DEXA) |
|
Yu et al., [9] |
Australia |
Aged ≥65 (mean 73) |
986 (611 men, 375 women)
|
10.05 + 0.35*weight – 0.62*Body Mass Index – 0.02*age (+ 5.10 if men) Weight in kg, Body Mass Index in kg/m2, age in years |
Dual Energy X-Ray Absorptiomestry (DEXA) |
Table 1: Description of the three studies that proposed simple anthropometric equations for predicting muscle mass.
Measurement
Weight: participants were measured in standing position, with minimal clothing, barefoot or shoeless, arms hanging freely at the side. A single digital scale (Tanita BC-541) was used for all participants during the study.
Height: participants were measured against a convenient flat wall, with shoulder blades, buttocks and heels in contact with the measuring wall. Participants were barefoot or shoeless and arms hanging freely at the side.
Grip strength: handgrip strength was measured with the subject sit upright, using a dynamometer (Jamar Hydraulic Hand Dynamometer). The measurement was conducted in both hands and the highest value of the two measurements was used for the analysis.
Walking speed: participants were asked to walk for 16 meters. Time spent on walking was recorded (in seconds) from the 4th meter to the 13th meter. Walking speed was calculated by the walking distance (10 meters) divided by time (m/s).
These measurements were conducted by one of the study investigators, KDT, who was a resident doctor at Thong Nhat Hospital.
Statistical analysis
Analysis of the data was performed using SPSS (version 24.0). Continuous variables were presented as mean ± standard deviation or median (range). Categorical variables were presented as frequency and percentage. The median and ranges of muscle mass estimated by the three equations are presented using GraphPad Prism 8.3.1. Correlation of muscle mass values estimated by the three equations was assessed by Intraclass Correlation Coefficient (two-way mixed models) [10]. Correlations between muscle mass calculated by these three equations with other indicators of sarcopenia (handgrip strength and walking speed) were assessed with Spearman correlation. Results are presented as correlation coefficients. Two-sided p values <0.05 were considered signi?cant. A correlation coefficient can be interpreted as follows: 0.00-0.10 (negligible correlation), 0.10-0.39 (weak correlation), 0.40-0.69 (moderate correlation), 0.70-0.89 (strong correlation) and 0.90-1.00 (very strong correlation) [11].
RESULTS
There were 251 participants, 39.4% were female, median age 72 (range 60-95). The general characteristics of participants are presented in table 2. Male participants had significantly higher values of height, weight, grip strength, walking speed and muscle mass compared to female participants. Figure 1 shows the muscle mass values estimated by the three equations in men and women. In women, the median estimated muscle mass values were similar among the three equations (12.40 kg with Lee’s equation, 12.94 kg with Wen’s equation, and 12.41 kg with Yu’s equation). In men, the muscle mass values were 21.98 kg with Lee’s equation, 20.0kg with Yu’s equation and 10.45kg with Wen’s equation.
|
|
All (N=251) |
Men (N=152) |
Women (N=99) |
P |
|
Age |
72 (60-95) |
72 (60-95) |
75 (60-94) |
0.053 |
|
Marital status |
||||
|
Being alone |
70 (27.9) |
23 (15.1) |
47 (47.5) |
<0.001 |
|
Married |
181 (72.1) |
129 (84.9) |
52 (52.5) |
|
|
Low education (primary school or under) |
84 (33.5) |
27 (17.8) |
57 (57.6) |
<0.001 |
|
Comorbidities: |
||||
|
Ischemic heart disease |
218 (86.9) |
135 (88.8) |
83 (83.8) |
0.254 |
|
Hypertension |
211 (84.1) |
129 (84.9) |
82 (82.8) |
0.666 |
|
Heart failure |
116 (46.2) |
67 (44.1) |
49 (49.5) |
0.400 |
|
Diabetes |
116 (46.2) |
68 (44.7) |
48 (48.5) |
0.561 |
|
Previous MI |
52 (20.7) |
41 (27.0) |
11 (11.1) |
0.002 |
|
CKD |
40 (15.9) |
21 (13.8) |
19 (19.2) |
0.255 |
|
COPD |
16 (6.4) |
12 (7.9) |
4 (4.0) |
0.222 |
|
Previous heart surgery |
15 (6.0) |
8 (5.3) |
7 (7.1) |
0.555 |
|
Cancer |
9 (3.6) |
4 (2.6) |
5 (5.1) |
0.314 |
|
Height (m) |
1.58 (1.32-1.76) |
1.60 (1.46-1.76) |
1.50 (1.32-1.65) |
<0.001 |
|
Weight (kg) |
56.0 (26.0-82.0) |
60.0 (37.0-82.0) |
52.0 (26.0-73) |
<0.001 |
|
Grip strength (kg) |
21.0 (3.0-47.0) |
27.0 (3.0-47.0) |
14.0 (4.0-26.0) |
<0.001 |
|
Walking speed (m/s) |
0.67 (0-1.36) |
0.79 (0.13-1.36) |
0.56 (0-1.03) |
<0.001 |
|
Muscle mass (kg) |
||||
|
Lee’s equation |
18.94 (4.98-8.51) |
21.98 (14.99-28.51) |
12.40 (4.98-20.30) |
<0.001 |
|
Wen’s equation |
11.80 (5.87-17.73) |
10.45 (5.87-15.16) |
12.94 (8.00-17.73) |
<0.001 |
|
Yu’s equation |
18.44 (7.97-24.93) |
19.99 (16.27-24.93) |
12.41 (7.97-17.78) |
<0.001 |
Table 2: General characteristics of participants.
Continuous data are presented as median (range). Categorical data are shown as n (%). MI: Myocardial Infarction. CKD: Chronic Kidney Disease. COPD: Chronic Obstructive Pulmonary Disease
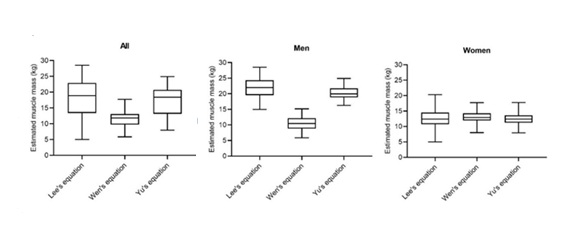 Figure 1: Muscle mass estimated by the three anthropometric equations by sex.
There was a very strong correlation among muscle mass values estimated by the three equations in the studied participants. The average intraclass correlation coefficient was 0.93 (95%CI 0.90-0.95, p<0.001) in women and 0.95 (95%CI 0.94-0.96, p<0.001) in men. The inter-item correlation matrix of muscle mass identified by these three equations is presented in table 3. Spearman correlation shows that muscle mass estimated by these equations had moderate correlation with grip strength but weak correlation with walking speed (Table 4).
|
|
Muscle mass according to Lee’s equation |
Muscle mass according to Wen’s equation |
Muscle mass according to Yu’s equation |
|
In men (N=152): |
|||
|
Muscle mass according to Lee's equation |
1.00 |
0.98 |
0.92 |
|
Muscle mass according to Wen's equation |
0.98 |
1.00 |
0.87 |
|
Muscle mass according to Yu's equation |
0.92 |
0.87 |
1.00 |
|
In women (N=99): |
|||
|
Muscle mass according to Lee's equation |
1.00 |
0.98 |
0.88 |
|
Muscle mass according to Wen's equation |
0.98 |
1.00 |
0.78 |
|
Muscle mass according to Yu's equation |
0.88 |
0.78 |
1.00 |
Table 3: Inter-item correlation matrix in men and women.
Muscle mass: in kg
|
|
Estimated muscle mass (kg) |
|||||
|
Men (n=152) |
Women (n=99) |
|||||
|
Lee’s equation |
Wen’s equation |
Yu’s equation |
Lee’s equation |
Wen’s equation |
Yu’s equation |
|
|
Grip strength (kg) |
0.65* |
0.60* |
0.55* |
0.50* |
0.45* |
0.51* |
|
Walking speed (m/s) |
0.42* |
0.37* |
0.35* |
0.43* |
0.38* |
0.43* |
Table 4: Spearman correlation coefficients between muscle mass identified by the three equations with grip strength and walking speed.
s*: p<0.001
DISCUSSION
In this study in 251 older hospitalized patients in Vietnam, we found that there was a high level of correlation among the three anthropometric equations proposed by Lee et al., Wen et al., and Yu et al., in estimating muscle mass. Muscle mass estimated by these equations had moderate correlation with grip strength. There was consistency in muscle mass values calculated from these three equations in women. However, the difference in muscle mass values was significant among the three equations in men. This finding may suggest that more studies are needed to adjust the anthropometric equations in men. Interestingly, although the anthropometric equation proposed by Yu et al., was conducted in the South Australian population [9], it showed consistency with the equations conducted by Lee and Wen in the Chinese populations in estimating muscle mass in the female participants in our study [7].
A simple anthropometric equation based on routinely collected data such as age, sex, height, and weight can be a practical method to estimate muscle mass in older patients in resource-limited settings. The quantification of muscle mass in older patients can help identify a higher risk group in whom treatment should be adjusted, and to allow interventions to prevent sarcopenia. Previous studies showed that low muscle mass was associated with increased adverse outcomes in patients with cardiovascular diseases [2,5]. In addition, quantifying muscle mass also helps facilitate research on sarcopenia and frailty in older patients in Vietnam. Bio-impedance analysis, dual energy X?ray absorptiometry or magnetic resonance imagings are not available in many hospitals in Vietnam and they are associated with high costs. This study suggests that these equations can be applied to screen for low muscle mass in older hospitalized patients in resource-limited settings in Vietnam, and further studies are needed to determine the validity of anthropometric equation prediction models in the Vietnamese population. As proposed by Yu et al., a muscle mass index (defined by muscle mass/height2) under 8.05 kg/m2 in men or under 5.35 kg/m2 in women can be considered as an indicator of low muscle mass [9]. If a patient was found to have low muscle mass, further examinations such as handgrip strength, walking test, or frailty screening can be conducted to identify sarcopenia or frailty. Sarcopenia and frailty are usually simultaneously present and are considered as two sides of the same coin [12]. Both conditions have been shown to be associated with increased adverse outcomes in older patients [3,13,14]. The early detection of these conditions may help facilitate treatment strategies that are tailored to frailty and sarcopenia, such as early mobility, prescription of physical exercise, nutritional assessment and management, and medication review to improve health outcomes for older patients [3,14,15].
STRENGTHS AND LIMITATION
To our best knowledge, this is the first study to apply and compare different simple anthropometric equations in estimating muscle mass in older hospitalized patients in Vietnam. However, it has several limitations. This study was a secondary analysis, and we did not have any standard measurement methods of muscle mass such as dual energy X?ray absorptiometry or magnetic resonance imaging to perform the validation of these anthropometric equations. Secondly, this study was conducted in older patients with cardiovascular diseases at a single hospital in Vietnam, which may not be representative for all older patients in Vietnam. Therefore, results should be cautiously interpreted and should not generalized to all older patients in Vietnam or elsewhere.
CONCLUSION
In this study, there was a high level of correlation of muscle mass values estimated by the three simple anthropometric equations in older hospitalized patients. Muscle mass estimated by these equations showed a moderate correlation with grip strength. Further studies are needed to examine the validity and applicability of simple anthropometric equations in diverse populations. Anthropometric equations based on routinely collected data can be a practical method to estimate muscle mass and facilitate sarcopenia research in resource-limited settings.
AUTHOR CONTRIBUTIONS
All authors were involved in the study concept, study design, statistical analysis and interpretation of data. Tan Van Nguyen and Tu Ngoc Nguyen drafted the manuscript. Tan Van Nguyen and Khuong Dang Tran were involved in data acquisition and take full responsibility for the integrity of the data. All authors revised, read and approved the final manuscript.
ACKNOWLEDGMENTS
We thank all the participants for their participation in this study.
FUNDING
The authors received no financial support for the research, authorship, and/or publication of this article.
CONFLICTS OF INTEREST
The authors declared no potential conflicts of interest with respect to the research, authorship, and/or publication of this article.
AVAILABILITY OF DATA AND MATERIALS
The study data is available from the corresponding author upon reasonable request.
REFERENCES
- Sisto IR, Hauck M, Plentz RDM (2018) Muscular Atrophy in Cardiovascular Disease. Adv Exp Med Biol 1088: 369-391.
- Chen LK, Liu L-K, Woo J, Assantachai P, Auyeung T-W, et al. (2014) Sarcopenia in Asia: Consensus Report of the Asian Working Group for Sarcopenia. J Am Med Dir Assoc 15: 95-101.
- Dent E, Morley JE, Cruz-Jentoft AJ, Arai H, Kritchevsky SB, et al. (2018) International Clinical Practice Guidelines for Sarcopenia (ICFSR): Screening, Diagnosis and Management. J Nutr Health Aging 22: 1148-1161.
- Cruz-Jentoft AJ, Bahat G, Bauer J, Boirie Y, Bruyère O, et al. (2019) Sarcopenia: Revised European Consensus on Definition and Diagnosis. Age Ageing 48: 16-31.
- Al-Gindan YY, Hankey CR, Leslie W, Govan L, Lean MEJ (2014) Predicting Muscle Mass From Anthropometry Using Magnetic Resonance Imaging as Reference: A Systematic Review. Nutr Rev 72: 113-126.
- Van Nguyen T, Tran KD, Bui KX, Le D, Nguyen TN (2020) A preliminary study to identify the likely risk for sarcopenia in older hospitalised patients with cardiovascular disease in Vietnam. Australas J Ageing.
- Lee RC, Wang Z, Heo M, Ross R, Janssen I, et al. (2000) Total-body Skeletal Muscle Mass: Development and Cross-Validation of Anthropometric Prediction Models. Am J Clin Nutr 72: 796-803.
- Wen X, Wang M, Jiang C-M, Zhang Y-M (2011) Anthropometric Equation for Estimation of Appendicular Skeletal Muscle Mass in Chinese Adults. Asia Pac J Clin Nutr 20: 551-556.
- Yu S, Appleton S, Chapman I, Adams R, Wittert G, et al. (2015) An Anthropometric Prediction Equation for Appendicular Skeletal Muscle Mass in Combination With a Measure of Muscle Function to Screen for Sarcopenia in Primary and Aged Care. J Am Med Dir Assoc 16: 25-30.
- Koo TK, Li MY (2016) A Guideline of Selecting and Reporting Intraclass Correlation Coefficients for Reliability Research. J Chiropr Med 15: 155-163.
- Schober P, Boer C, Schwarte LA (2018) Correlation Coefficients: Appropriate Use and Interpretation. Anesth Analg 126: 1763-1768.
- Cesari M, Landi F, Vellas B, Bernabei R, Marzetti E (2014) Sarcopenia and Physical Frailty: Two Sides of the Same Coin. Front Aging Neurosci 6: 192.
- Sipers WMWH, de Blois W, Schols JMGA, van Loon LJC, Verdijk LB (2019) Sarcopenia Is Related to Mortality in the Acutely Hospitalized Geriatric Patient. J Nutr Health Aging 23: 128-137.
- Dent E, Morley JE, Cruz-Jentoft AJ, Woodhouse L, Rodríguez-Mañas L, et al. (2019) Physical Frailty: ICFSR International Clinical Practice Guidelines for Identification and Management. J Nutr Health Aging 23: 771-787.
- Dent E, Lien C, Lim WS, Wong WC, Wong CH, et al. (2017) The Asia-Pacific Clinical Practice Guidelines for the Management of Frailty. J Am Med Dir Assoc 18: 564-575.
Citation: Nguyen TV, Tran KD, Nguyen TN (2020) Correlating Calculated Muscle Mass with other Components of Sarcopenia in Older Hospitalized Patients? J Gerontol Geriatr Med 6: 061.
Copyright: © 2020 Khuong Dang Tran, et al. This is an open-access article distributed under the terms of the Creative Commons Attribution License, which permits unrestricted use, distribution, and reproduction in any medium, provided the original author and source are credited.