Discriminatory Ability of New and Traditional Anthropometric Indices for Hypertension and Diabetes in the Elderly
*Corresponding Author(s):
Fabiane Aparecida Canaan RezendeDepartment Of Nutrition, Federal University Of Tocantins (UFT), Palmas, Tocantins, Brazil
Tel:+55 3138992899,
Fax:+55 3138992541
Email:facrezende@uft.edu.br
Abstract
Purpose
To investigate the association and discriminatory ability of new and traditional anthropometric indices for diabetes and hypertension in elderly.
Materials and methods
We conducted a cross-sectional population-based study of 62 elderly aged 60 years or more. Body Mass Index (BMI), Waist Circumference (WC), Hip Circumference (HC), Waist to Hip Ratio (WHR), Waist to Height Ratio (WHtR), Conicity Index (CI), Waist to Calf Ratio (WCR), Waist to Hip to Height Ratio (WHHR), Body Adiposity Index (BAI), A Body Shape Index (ABSI) and Body Roundness Index (BRI) were obtained. The outcomes were hypertension and diabetes. Poisson regression with robust variance estimator was used to estimate the prevalence ratios. Adjustors were age, sex, income, level educational, alcohol consumption, smoking status, physical activity and diet quality score. To assess discriminatory ability was used receiver operating characteristic curve.
Results
Most of the anthropometric indices were positively associated with both diabetes and hypertension. The prevalence of diabetes were increased more than 1.5-fold per SD increase for WCR and WHR (P <0.0001). Hip circumference showed an inverse association with diabetes. The areas under the curve were significantly greater than 0.5 (P <0.05). WCR (AUC: 0.67, 95% CI: 0.62-0.72), WHtR (AUC: 0.66, 95% CI: 0.61-0.72) and BRI (AUC: 0.66, 95% CI: 0.6z-0.72) showed discriminatory ability slightly higher for diabetes.
Conclusion
New anthropometric indices did not show stronger associations or better discriminatory ability than the traditional anthropometric indices for hypertension or diabetes in elderly individuals.
Keywords
Ability; Aging; Anthropometry; Cardiovascular risk factor; Discriminatory
INTRODUCTION
Anthropometric measurements are often used as proxies for total body fat and abdominal visceral adipose tissue in population studies [7,8]. Classically, waist circumference, waist to hip ratio and waist to height ratio are measures used to estimate the risk cardiometabolic related to central obesity [9]. Recently others indices, such as the waist to calf ratio [10], waist to hip to height ratio [11], body roundness index [12] and a body shape index [13] have been proposed as risk predictors, but these have not been studied in elderly.
The aim of this study was to investigate the association of new and classic anthropometric indices with diabetes and hypertension as well as their discriminatory ability.
MATERIAL AND METHODS
Data collection
Study population
Definition of diabetes and hypertension
Anthropometric data
|
Anthropometric indices |
Formulas |
|
A body shape index (m11/6.kg-2/3) [13] |
WC (m) ÷ (BMI (kg/m²)2/3 x Height (m)1/2) |
|
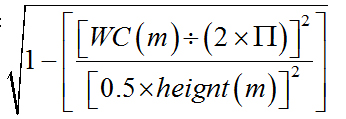
Body roundness index [12] |
364.2 - (365.5 x ε), where ε = |
|
Body adiposity index [16] (%) |
HC (cm) ÷ Height (m)1.5 - 18 |
|
Conicity index [17] |
WC (m) ÷ (0.109 x |
|
Body mass index (kg/m²) [15] |
Weight (kg) ÷ Height (m)² |
|
Waist to height ratio [18] |
WC (cm) ÷ Height (cm) |
|
Waist to calf ratio [10] |
WC (cm) ÷ CC (cm) |
|
Waist to hip ratio [15] |
WC (cm) ÷ HC (cm) |
|
Waist to hip to height ratio [11] |
WC (cm) ÷ HC (cm) ÷ Height (cm) |
Measurements of covariates
Food consumption was obtained through habitual dietary intake recall by the method of multiple passages [19]. Overall diet quality was assessed using Brazilian Healthy Eating Index Revised (BHEI-R). BHEI-R was measured from 12 components based on food groups totaling a maximum score of 100 points and a higher score represents a better dietary quality [20,21]. Physical activity was categorized in ‘yes’ or ‘no’; current smoking status in ‘smoker’, ‘ex-smoker’ or ‘never-smoker’ and alcohol consumption was dichotomized in ‘non-drinker’, ‘ex-drinker’ and ‘current drinker’.
Data analysis
In addition, we calculated the area under the Receiver Operating Characteristic (ROC) curve and 95% Confidence Intervals (CIs) to evaluate the discriminatory ability of anthropometric indices to identify elderly with diabetes and hypertension. In this study was observed that the prevalence of hypertension and diabetes was of 92.6% and 37.7% in obese elderly and 76.1% and 19.0% in non-obese elderly, respectively. Assuming ???? = 0.05, the statistical power in all analyses was >97,3% for hypertension and >98,8% for diabetes [24] (OpenEpi24: www.OpenEpi.com).
RESULTS
|
Variables |
Values |
|
Population size (n) |
537 |
|
Age (mean ± SD) |
69.7 ± 7.38 |
|
Female (%) |
50.1 |
|
Income (US$) (median, IQR) |
382.50 (255.00 - 877.50) |
|
Level educational <8 years (%) |
78.2 |
|
Current smokers (%) |
11.9 |
|
Physical inactivity (%) |
67.6 |
|
Current drinkers (%) |
37.4 |
|
Diet quality (BHEI-R) (mean ± SD) |
64.2 ±11.2 |
|
Hypertension (%) |
79.9 |
|
Diabetes (%) |
23.9 |
|
BMI ≥ 30 kg/m² (%) |
22.7 |
The most anthropometric variables were positively associated with both diabetes and hypertension, while the hip circumference showed an inverse association with diabetes. The prevalence of diabetes was increased more than 1.5-fold per SD increase for WCR and WHR (Table 3).
|
Anthropometric indices (n=537) |
Prevalence ratios and 95% confidence interval |
|
|
Hypertension¹ |
Diabetes² |
|
|
Bodymass Index (BMI) |
1.09 (1.05 - 1.13) |
1.31 (1.16 - 1.47) |
|
Waist Circumference (WC) |
1.09 (1.04 - 1.13) |
1.38 (1.22 - 1.56) |
|
Hip Circumference (HC)3 |
0.96 (0.89 - 1.03) |
0.64 (0.50 - 0.84) |
|
Waist to Hip Ratio (WHR) |
1.08 (1.03 - 1.13) |
1.55 (1.32 - 1.82) |
|
Waist to Height Ratio (WHtR) |
1.09 (1.05 - 1.14) |
1.41 (1.24 - 1.60) |
|
Waist to Calf Ratio (WCR) |
1.07 (1.03 - 1.11) |
1.52 (1.33 - 1.75) |
|
Waist to Hip To Height Ratio (WHHR) |
1.07 (1.02 - 1.11) |
1.46 (1.26 - 1.68) |
|
Conicity Index (CI) |
1.07 (1.03 - 1.12) |
1.39 (1.22 - 1.59) |
|
Body Adiposity Index (BAI) |
1.08 (1.04 - 1.12) |
1.23 (1.07 - 1.40) |
|
A Body Shape Index (ABSI) |
1.03 (0.98 - 1.07) |
1.22 (1.06 - 1.40) |
|
Body Roundness Index (BRI) |
1.08 (1.05 – 1.13) |
1.34 (1.20 - 1.50) |
§Standard Deviation (SD): BMI: 5.09 kg/m²; WC: 12.39 cm; HC: 10.04 cm; WHR: 0.07; WHtR: 0.08; WCR: 0.24; WHHR: 0.05; CI: 0.07; BAI: 6.7%; ABSI: 0.004 m11/6.kg-2/3 and BRI: 1.89.
1Model 1: Adjusted for age, sex, median income, level educational (<8 or ≥8 years), drinking status, smoking status, physical activity and diet quality score.
2Model 2: First model additionally for hypertension.
3Model 1 and 2: Additionally adjusted for waist circumference.
The Areas Under the Curve (AUCs) for each anthropometric measure were significantly greater than 0.5, but the discriminatory ability was lower for hypertension compared with diabetes. The indices that show discriminatory ability slightly higher were the WCR, WHtR and BRI for diabetes (Table 4).
|
Anthropometric indices (n=537) |
AUC (95% CI) |
|
|
Hypertension |
Diabetes |
|
|
Bodymass index |
0.61 (0.56 - 0.68) |
0.63 (0.57 - 0.70) |
|
Waist circumference |
0.62 (0.56 - 0.68) |
0.64 (0.58 - 0.69) |
|
Waist to hip ratio |
0.58 (0.51 - 0.64) |
0.60 (0.55 - 0.66) |
|
Waist to height ratio |
0.64 (0.59 - 0.70) |
0.66 (0.61 - 0.72) |
|
Waist to calf ratio |
0.61 (0.55 - 0.67) |
0.67 (0.61 - 0.72) |
|
Waist to hip to height ratio |
0.62 (0.56 - 0.68) |
0.65 (0.59 - 0.70) |
|
Conicity index |
0.61 (0.55 - 0.67) |
0.63 (0.58 - 0.68) |
|
Body adiposity index |
0.62 (0.56 - 0.67) |
0.61 (0.55 - 0.67) |
|
A body shape index |
0.55 (0.49 - 0.61) |
0.57 (0.51 - 0.62) |
|
Body roundness index |
0.64 (0.59 - 0.70) |
0.66 (0.61 - 0.72) |
DISCUSSION
The combination of excess body fat, mainly abdominal, with reduced muscle mass may produce more negative health outcomes and the sarcopenia phenotype or sarcopenic obesity are common in the older population [29]. In view of this, WCR could predict sarcopenic obesity since it is an index that assesses the disproportion between abdominal fat and leg muscle mass [10], but further studies are needed to verify this. In our study, hip circumference was inversely associated with diabetes. This is also supported in other studies with adults [30,31] and elderly [32]. There is evidence that a visceral and gluteofemoral adipose tissue has distinct intrinsic characteristics. Thigh and hip fat deposits have been positively linked with increased lipoprotein lipase, serum leptin and adiponectin activities, and negatively with the proinflammatory cytokines. As possible mechanisms to explain the ‘protective effect’ of gluteofemoral fat is a more passive metabolic activity that leads to visceral fat and fatty acids being stored for long time spans revealed by a lower concentration in the circulation [33].
The comparability of our results with those found in other studies is limited, because in our literature review, we did not find any study that compared the discriminatory ability of new and traditional anthropometric indices in the elderly population. Only a few studies [34-37] had investigated the association and discriminatory ability of BMI, WC, WHR and/or WHtR for cardiometabolic risk factors in the elderly population and the results were inconsistent. Corroborating findings from other studies [36,38,39], anthropometric indicators showed low discriminant power to diabetes and hypertension in the elderly.
There are a few limitations to our study. Firstly, the study has a cross-sectional design, so it limits to establish temporality between the predictors and the outcome. Secondly, the prevalence of diabetes and hypertension in the population might be underestimated in this study because the majority of study participants were of low education level. However, to minimize bias additionally medication records were considered to define chronic diseases. This study demonstrated that the recently proposed anthropometric indices showed no higher discriminatory ability than the indices traditionally used in population studies and in clinical practice. WCR seems to be a promising index in the evaluation of the elderly, but more studies are needed.
ACKNOWLEDGMENT
CONFLICT OF INTEREST
AUTHORS CONTRIBUTION
ETHICAL STANDARDS DISCLOSURE
REFERENCES
- Guariguata L, Whiting DR, Hambleton I, Beagley J, Linnenkamp U, et al. (2014) Global estimates of diabetes prevalence for 2013 and projections for 2035. Diabetes Res Clin Pract 103: 137-149.
- Lloyd-Sherlock P, Beard J, Minicuci N, Ebrahim S, Chatterji S (2014) Hypertension among older adults in low- and middle-income countries: Prevalence, awareness and control. Int J Epidemiol 43: 116-128.
- Hirani V (2011) Generalised and abdominal adiposity are important risk factors for chronic disease in older people: Results from a nationally representative survey. J Nutr Health Aging 15: 469-478.
- Zamboni M, Rossi AP, Fantin F, Zamboni G, Chirumbolo S, et al. (2014) Adipose tissue, diet and aging. Mech Ageing Dev 136-137: 129-137.
- Lee CM, Huxley RR, Wildman RP, Woodward M (2008) Indices of abdominal obesity are better discriminators of cardiovascular risk factors than BMI: A meta-analysis. J Clin Epidemiol 61: 646-653.
- Ashwell M, Gunn P, Gibson S (2012) Waist-to-height ratio is a better screening tool than waist circumference and BMI for adult cardiometabolic risk factors: Systematic review and meta-analysis. Obes Rev 13: 275-286.
- Fan H, Li X, Zheng L, Chen X, Lan Q, et al. (2016) Abdominal obesity is strongly associated with Cardiovascular Disease and its Risk Factors in Elderly and very Elderly Community-dwelling Chinese. Sci Rep 6: 21521.
- Fauziana R, Jeyagurunathan A, Abdin E, Vaingankar J, Sagayadevan V, et al. (2016) Body mass index, waist-hip ratio and risk of chronic medical condition in the elderly population: Results from the Well-being of the Singapore Elderly (WiSE) Study. BMC Geriatr 16: 125.
- Lam BC, Koh GC, Chen C, Wong MT, Fallows SJ (2015) Comparison of Body Mass Index (BMI), Body Adiposity Index (BAI), Waist Circumference (WC), Waist-To-Hip Ratio (WHR) and Waist-To-Height Ratio (WHtR) as predictors of cardiovascular disease risk factors in an adult population in Singapore. PLoS ONE 10: 0122985.
- Kim SK, Choi YJ, Huh BW, Kim CS, Park SW, et al. (2011) Ratio of waist-to-calf circumference and carotid atherosclerosis in Korean patients with type 2 diabetes. Diabetes Care 34: 2067-2071.
- Carlsson AC, Risérus U, Engström G, Ärnlöv J, Melander O, et al. (2013) Novel and established anthropometric measures and the prediction of incident cardiovascular disease: A cohort study. Int J Obes (Lond) 37: 1579-1585.
- Thomas DM, Bredlau C, Bosy-Westphal A, Mueller M, Shen W, et al. (2013) Relationships between body roundness with body fat and visceral adipose tissue emerging from a new geometrical model. Obesity (Silver Spring) 21: 2264-2271.
- Krakauer NY, Krakauer JC (2012) A new body shape index predicts mortality hazard independently of body mass index. PLoS One 7: 39504.
- World Health Organization (2013) Collaborating Centre for Drug Statistics Methodology, Guidelines for ATC classification and DDD assignment 2015. Oslo, 2014. WHO, Geneva, Switzerland.
- World Health Organization (1995) Physical status: the use and interpretation of anthropometry. WHO, Geneva, Switzerland.
- Bergman RN, Stefanovski D, Buchanan TA, Sumner AE, Reynolds JC, et al. (2011) A better index of body adiposity. Obesity (Silver Spring) 19: 1083-1089.
- Valdez R, Seidell JC, Ahn YI, Weiss KM (1993) A new index of abdominal adiposity as an indicator of risk for cardiovascular disease. A cross-population study. Int J Obes Relat Metab Disord 17: 77-82.
- Hsieh SD, Yoshinaga H (1995) Abdominal fat distribution and coronary heart disease risk factors in men-waist/height ratio as a simple and useful predictor. Int J Obes Relat Metab Disord 19: 585-589.
- Johnson RK, Soultanakis RP, Matthews DE (1998) Literacy and body fatness are associated with underreporting of energy intake in US low-income women using the multiple-pass 24-hour recall: A doubly labeled water study. J Am Diet Assoc 98: 1136-1140.
- Previdelli AN, de Andrade SC, Pires MM, Ferreira SRG, Fisberg RM, et al. (2011) Índice de Qualidade da Dieta Revisado para população Revista de Saúde Pública 45: 794-798.
- de Andrade SC, Previdelli AN, Marchioni DML, Fisberg RM (2013) Avaliação da confiabilidade e validade do Índice de Qualidade da Dieta Revisado. Revista de Saúde Pública 47: 675-683.
- Stata Corporation (2013) Stata Statistical Software: Release 13. College Station, TX: StataCorp LP, Texas, USA.
- Greenland S, Pearl J, Robins JM (1999) Causal diagrams for epidemiologic research. Epidemiology 10: 37-48.
- Sullivan KM, Dean A, Soe MM (2009) OpenEpi: A web-based epidemiologic and statistical calculator for public health. Public Health Rep 124: 471-474.
- Fujita M, Sato Y, Nagashima K, Takahashi S, Hata A (2015) Predictive power of a body shape index for development of diabetes, hypertension, and dyslipidemia in Japanese adults: A retrospective cohort study. PLoS One 10: 0128972.
- Chang Y, Guo X, Chen Y, Guo L, Li Z, et al. (2015) A body shape index and body roundness index: two new body indices to identify diabetes mellitus among rural populations in northeast China. BMC Public Health 15: 794.
- Haghighatdoost F, Sarrafzadegan N, Mohammadifard N, Asgary S, Boshtam M (2014) Assessing body shape index as a risk predictor for cardiovascular diseases and metabolic syndrome among Iranian adults. Nutrition 30: 636-644.
- Maessen MF, Eijsvogels TM, Verheggen RJ, Hopman MT, Verbeek AL, et al. (2014) Entering a new era of body indices: The feasibility of a body shape index and body roundness index to identify cardiovascular health status. PLoS ONE 9: 107212.
- Cruz-Jentoft AJ, Baeyens JP, Bauer JM, Boirie Y, Cederholm T, et al. (2010) Sarcopenia: European consensus on definition and diagnosis: Report of the European Working Group on Sarcopenia in Older People. Age Ageing 39: 412-423.
- Conway B, Xiang YB, Villegas R, Zhang X, Li H, et al. (2011) Hip circumference and the risk of type 2 diabetes in middle-aged and elderly men and women: The Shanghai women and Shanghai men's health studies. Ann Epidemiol 21: 358-366.
- Esmaillzadeh A, Mirmiran P, Azadbakht L, Amiri P, Azizi F (2006) Independent and inverse association of hip circumference with metabolic risk factors in Tehranian adult men. Prev Med 42: 354-357.
- Snijder MB, Dekker JM, Visser M, Bouter LM, Stehouwer CD, et al. (2003) Associations of hip and thigh circumferences independent of waist circumference with the incidence of type 2 diabetes: The Hoorn Study. Am J Clin Nutr 77: 1192-1197.
- Manolopoulos KN, Karpe F, Frayn KN (2010)Gluteofemoral body fat as a determinant of metabolic health. Int J Obes (Lond) 34: 949-959.
- Barbosa AR, Munaretti DB, Da Silva Coqueiro R, Borgatto AF (2011) Anthropometric indexes of obesity and hypertension in elderly from Cuba and Barbados. J Nutr Health Aging 15: 17-21.
- Wannamethee SG, Papacosta O, Whincup PH, Carson C, Thomas MC, et al. (2010) Assessing prediction of diabetes in older adults using different adiposity measures: A 7 year prospective study in 6,923 older men and women. Diabetologia 53: 890-898.
- Neto JSL, Coqueiro RS, Freitas RS, Fernandes MH, Oliveira DS, et al. (2013) Anthropometric indicators of obesity as screening tools for high blood pressure in the elderly. Int J Nurs Pract 19: 360-367.
- Gharipour M, Sadeghi M, Dianatkhah M, Bidmeshgi S, Ahmadi A, et al. (2014) The Cut-Off Values of Anthropometric Indices for Identifying Subjects at Risk for Metabolic Syndrome in Iranian Elderly Men. J Obes 2014: 907149.
- Barbosa LS, Scala LCN, Ferreira MG (2009) Associação entre marcadores antropométricos de adiposidade corporal e hipertensão arterial na população adulta de Cuiabá, Mato Grosso. Revista Brasileira de Epidemiologia 12: 237-247.
- Martins MV, Ribeiro AQ, Martinho KO, Franco FS, Danésio de Souza J, et al. (2015) Anthropometric indicators of obesity as predictors of cardiovascular risk in the elderly. Nutr Hosp 31: 2583-2589.
Citation: Rezende FAC, Ribeiro AQ, Pereira PF, Priore SE, Marins JCB, et al. (2019) Discriminatory Ability of New and Traditional Anthropometric Indices for Hypertension and Diabetes in the Elderly. J Gerontol Geriatr Med 5: 029.
Copyright: © 2019 Fabiane Aparecida Canaan Rezende, et al. This is an open-access article distributed under the terms of the Creative Commons Attribution License, which permits unrestricted use, distribution, and reproduction in any medium, provided the original author and source are credited.