Effects of Korean Red Ginseng on the Pharmacokinetics and Pharmacodynamics of Metformin in Healthy Subjects
*Corresponding Author(s):
Young-Ran YoonDepartment Of Molecular Medicine And Clinical Trial Center, Kyungpook National University School Of Medicine And Hospital, Daegu, Republic Of Korea
Tel:+82 534204950,
Fax:+82 534205218
Email:yry@knu.ac.kr
Sook Jin Seong
Clinical Omics Institute And Clinical Trial Center, Kyungpook National University School Of Medicine And Hospital, Daegu, Republic Of Korea
Tel:+82 532006351,
Fax:+82 534205218
Email:wintersj@knu.ac.kr
Abstract
Characterizing potential interactions between red ginseng, an herb with desirable health effects, and metformin, a commonly used drug for the treatment of type 2 diabetes mellitus, is of high clinical importance. In this study, we evaluate the effects of Korean red ginseng on the pharmacokinetic and pharmacodynamic properties of metformin in healthy subjects. The study was conducted in an open-label, two-period and single-sequence design. A total of 11 subjects received multiple doses of metformin in the first study period followed by multiple doses of metformin and red ginseng in the second study period. The Geometric Mean Ratio (GMR) (90% Confidence Interval (CI)) between the groups for area under the plasma drug concentration-time curve within a dosing interval (tau) at steady state (AUCtau,ss) of metformin was out of the range of bioequivalence, indicating that the systemic exposure of metformin when combined with red ginseng was reduced compared with administration of metformin alone. However, the pharmacodynamic analysis showed that the GMR (90% CI) between the groups for area under the blood glucose values–time curve from time zero to the time of the last measurable value (AUClast) and maximum blood glucose value (Gmax) were within the range of bioequivalence. We concluded that the observed reduction in the systemic exposure of metformin when administered with red ginseng is clinically insignificant. This study demonstrated that Korean red ginseng did not have clinically significant pharmacokinetic or pharmacodynamic herb–drug interactions with metformin in healthy subjects.
Keywords
Metformin; Potential interactions; Red ginseng
INTRODUCTION
Ginseng, a commonly used herbal medicinal food, has been used for long time for its various effects on health. Fresh ginseng is unprocessed form of ginseng, while red ginseng is made by steaming and drying the fresh ginseng [1].The saponins contained in ginseng, which are called ginsenosides, constitute the main active ingredients of ginseng. In red ginseng, the naturally occurring ginsenosides which are present in fresh ginseng are transformed by heat during the manufacturing process, resulting in comparatively large amounts of converted ginsenosides. These transformed ginsenosides typically include ginsenosides Rg2, Rg6, F4, 20(E)-F4, Rh1, Rh4, Rk3, Rg3, Rg5, Rz1, Rk1, Rg9 and Rg10; these are generated through the transformation of ginsenosides Rb1, Rb2, Rc, Rd, Rg1 and Re [2]. Orally-administered ginseng is usually metabolized into specific ginsenoside metabolites by microorganisms living in the gut [3]. Rb1 and Rd are metabolized to compound K, and Rg3 and Rg5 are transformed to Rh2 and Rh3, respectively [3,4]. The ginsenoside metabolites have better absorption rates compared with the naturally occurring ginsenosides [3,5].
Health functional foods are manufactured using ingredients that are beneficial to the human body. However, manufacturing processes may alter these ingredients into unknown molecules, leading to potentially undesirable interactions. In particular, red ginseng is commonly used due to various pharmacological effects [6]. Therefore, the safety of using red ginseng for its medicinal applications should be investigated and its potential herb-drug interactions with commonly used medications should be characterized. The potential interactions of fresh ginseng preparation have been investigated by many studies [7-11]. However, ginsenoside metabolites rather than naturally occurring ginsenosides are the major derivatives that interact with human Cytochrome P450 (CYP) enzymes and transporters. Studies have shown that Rh2, a ginsenoside metabolite of Rg3, affects the activity of the CYP enzymes [2,3,5,12,13]. Also, it has been reported that ginsenoside metabolites have the potential to inhibit P-glycoprotein (P-gp), and PPD, Rh2 and PPT have been shown to inhibit Breast Cancer Resistance Protein (BCRP) based on results from in vitro and in vivo studies [14-17]. However, some clinical studies on red ginseng have shown that it doesn’t affect the function of P-gp and Organic Anion-Transporting Polypeptide (OATP) 1B1 [5,18]. Red ginseng contains relatively large amount of converted ginsenosides, which are metabolized to diverse ginsenoside metabolites that may affect the CYP enzymes or transporters. Therefore, it is likely that the herb-drug interactions of red ginseng are more common than those associated with fresh ginseng. Thus, additional clinical studies are needed to examine the effects of red ginseng on various drugs and to characterize its potential herb-drug interactions. However, to date, there are only a few clinical studies that have investigated the potential herb-drug interactions of red ginseng [1,5,18].
Diabetes Mellitus (DM) is among the most common chronic diseases globally. Type 2 DM accounts for ~90% of all cases of diabetes [19]. Metformin, a commonly prescribed antidiabetic drug, is widely used as a first-line treatment for type 2 DM. It is typically used as either a monotherapy or in combination with other drugs [20]. Therefore, the evaluation of pharmacokinetic and pharmacodynamic interactions that may affect metformin treatment in patients with type 2 DM is of high clinical importance. Metformin is not metabolized in the liver and is eliminated mainly through renal tubular secretion, excreted unchanged in the urine. Metformin is typically distributed throughout the body by transporters such as Plasma Membrane Monoamine Transporter (PMAT), Organic Cation Transporter (OCT) and Multidrug And Toxin Extrusion (MATE). The intestinal absorption of metformin is mainly mediated by PMAT [21] and OCT1 and OCT3 are also involved [22].
Although several in vitro and in vivo animal studies have investigated the effects of red ginseng on metformin transporters [23,24], there are no clinical study that investigated the effects of red ginseng on both the pharmacokinetics and pharmacodynamics of metformin. Hence, we sought to evaluate the effects of Korean red ginseng on the pharmacokinetics and pharmacodynamics of metformin in healthy subjects.
MATERIALS AND METHODS
Study design and procedure
This study (Clinical Research Information Service (CRIS, https://cris.nih.go.kr) registry number: KCT0003035) was performed according to a protocol that was approved by the Institutional Review Board of Kyungpook National University Hospital and the Korea Ministry of Food and Drug Safety. The protocol was developed based on the ethical principles of the Declaration of Helsinki, the International Conference on Harmonization Good Clinical Practice Guideline, and local laws and regulation. All subjects provided a written informed consent to be included in the study.
The volunteers who met the inclusion criteria were enrolled in the study. Key inclusion criteria included healthy Korean adult male ≥19 years of age and with body mass index of more or equal to 18.5kg/m2 and ≤27.0 kg/m2. Exclusion criteria included a history of hypersensitivity reactions to any component of the study drugs and medical conditions that could affect the absorption, distribution, metabolism and excretion of the study drugs. Additional exclusion criteria included a history of DM diagnosis; use of any prescription drug or herbal medicines within two weeks of the study.
This study was conducted according to an open-label, two-period, and a single-sequence design. During the first period, metformin was repeatedly administered to the subject on an empty stomach for 5 days. In the second period, red ginseng was repeatedly administered alone for 10 days, and then metformin and red ginseng were co administered for the last 5 days (Figure 1). The study drugs were Hong Samjung all day® (Korean red ginseng concentrate 10 mL, total 12 mg of Rb1, Rg1 and Rg3; Punggi Ginseng Cooperative Association, Republic of Korea) and Diabex tablet 1000 mg® (metformin hydrochloride 1000 mg; Daewoong Pharmaceutical Co., Ltd., Republic of Korea) [25]. Because the maximum daily intake of red ginseng should not exceed 80 mg of ginsenosides [26], the dose and duration of red ginseng administration were set to 36 mg/day over 15 days. In order to evaluate the interactions at the maximum exposure of metformin, the approved maximum dose was allowed to be administered [27]. This study was conducted with metformin 1000 mg by referring to literature that studied the interaction of metformin [28,29]. The metformin was repeatedly administered for 5 days and the washout period was set to 7 days, based on the previous results [29].
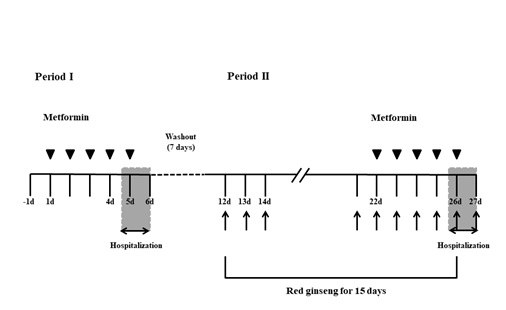 Figure 1: The design of study. Multiple doses of metformin were administered alone during 5 days of the first study period. In the second study period, multiple doses of red ginseng were administered alone for 10 days followed by a combination of metformin and red ginseng for the last 5 days. The washout period between the first and second periods of the study was 7 days.
Pharmacokinetic assessment
The pharmacokinetic blood sampling was performed before the last repeated dose at 0 h and at 0.5, 1, 1.5, 2, 3, 4, 6, 8, 10, 12 and 24 h after dosing each period. The collected blood was centrifuged for 10 min at 3000 rpm within 30 min of collection, and the supernatant plasma was collected and stored at about −70°C until further analysis. The plasma concentrations of metformin were analyzed using a validated liquid chromatography coupled with tandem Mass Spectrometry (LC-MS/MS).The pharmacokinetic parameters including the area under the plasma drug concentration–time curve within a dosing interval (tau) at steady state (AUCtau,ss), maximum plasma drug concentration at steady state (Cmax,ss), apparent total clearance of the drug from the plasma after oral administration at steady state (CLss/F), time to reach maximum plasma concentration at steady state (Tmax,ss) and terminal elimination half-life (t1/2)were calculated based on the plasma concentrations of metformin by no compartmental analysis using Phoenix™ WinNonlin® software (version 8.1, Certara, USA).
Pharmacodynamic assessment
An Oral Glucose Tolerance Test (OGTT) was performed at around 10 a.m. on the day before the first dose of the first period, on the day of the last repeated dose of the first period, and on the day of the last repeated dose of the second period. Blood glucose levels were measured in blood samples collected before administration of a 75 g glucose solution at 0 h and at 0.5, 0.75, 1, 1.5, 2, 2.5, 3 and 4 h after glucose administration. The pharmacodynamic parameters including the area under the blood glucose values–time curve from time zero to the time of the last measurable value (AUClast) and maximum blood glucose value (Gmax)) were calculated based on the measured blood glucose levels by no compartmental analysis using Phoenix™ WinNonlin®software (version 8.1, Certara, USA).
Safety assessment
The safety of all subjects who received the at least one dose of the study drugs was evaluated, and the occurrence, severity and frequency of Adverse Drug Reaction (ADR) were compared before and after administration of the drugs. Safety was evaluated by physical examination, vital sign, electrocardiogram, clinical laboratory tests and monitoring of Adverse Event (AE).
Statistical analyses
The statistical analyses were performed using SAS software (version 9.4, SAS Institute Inc., Cary, North Carolina, USA) and the SPSS program (version 18.0, SPSS Inc., Chicago, Illinois, USA). A p-value below 0.05 was used to establish statistical significance. Since the pharmacokinetic properties of metformin and the short-term safety of its highest dose have been established, the statistical analysis of the pharmacokinetic results was based on the AUC as it relates to the long-term safety and efficacy, rather than on the Cmax of short-term safety.
To determine the pharmacokinetic interaction, the AUCtau,ss of metformin was log-transformed to obtain the Geometric Mean Ratio (GMR) and 90% Confidence Interval (90% CI) between the two groups using Two One-Sided t-Tests (TOST)when metformin were administered alone and in combination with red ginseng. If the GMR (90% CI) was within the conventional range of 0.8-1.25, the pharmacokinetic properties were considered equivalent. Also, a statistical hypothesis test was performed to determine whether there is any significant difference in the AUCtau,ss of metformin between the two groups.
For the pharmacodynamic interaction, statistical hypothesis tests were performed to determine whether there was any significant difference among the groups for the AUClast and Gmax of glucose before administration, after metformin administration alone and after metformin administration in combination with red ginseng. The AUClast and Gmax of glucose were log-transformed to obtain the GMR (90% CI) between the two groups using TOST when metformin were administered alone and in combination with red ginseng. If the GMR (90% CI) was within the acceptable range of 0.8-1.25, the pharmacodynamic properties were considered equivalent [30]. Additionally, a statistical hypothesis test was performed to determine whether there is any significant difference between the two groups in terms of a change from baseline (%) of glucose AUClast and Gmax.
RESULTS
Demographic characteristics
Fifteen of the 16 volunteers were selected as the subjects and one of them was placed on the waiting list for administration. Before the beginning of the first period of the study, 5 subjects withdrew of the study, and one of the 5 subjects who withdrew consent was replaced with the one on the waiting list, leading to a total of 11 subjects to participate and complete both periods of the study. The descriptive statistics for the basic demographic information of the subjects who completed the study is presented in table 1.
|
Demographic variables (unit) |
All subjects (n = 11) |
|
Age (years) |
|
|
Arithmetic mean ± SD |
24.6 ± 4.0 |
|
Median (range) |
24.0 (19.0–31.0) |
|
Weight (kg) |
|
|
Arithmetic mean ± SD |
67.7 ± 8.4 |
|
Median (range) |
65.3 (56.8–82.0) |
|
Height (cm) |
|
|
Arithmetic mean ± SD |
172.9 ± 4.8 |
|
Median (range) |
172.3 (165.3–181.1) |
Table 1: Summary descriptive statistics for the demographic characteristics of the subjects.
All subjects who completed the study were analyzed. Data are presented as arithmetic mean ± SD (standard deviation) and median (range (minimum–maximum)) for age, weight and height.
Pharmacokinetic properties
A total of 11 subjects who completed all the scheduled blood samplings for pharmacokinetic assessments were included in the pharmacokinetic. When metformin was administered alone or in combination with red ginseng, the pharmacokinetic parameters were calculated based on the plasma concentrations of metformin for each group (Table 2). The arithmetic mean plasma concentration–time profiles of metformin are shown for each treatment group in figure 2.
|
Pharmacokinetic parameters (unit) |
Metformin |
Metformin + red ginseng |
|
AUCtau,ss (h×ng/mL) |
14,676.53 ± 4,660.11 (31.75) |
11,610.49 ± 3,385.44 (29.16) |
|
Cmax,ss (ng/mL) |
2,352.17 ± 788.15 (33.51) |
2,256.89 ± 809.48 (35.87) |
|
CLss/F (L/h) |
73.76 ± 20.79 (28.18) |
91.68 ± 21.92 (23.91) |
|
Tmax,ss (h) |
1.95 ± 1.01 (51.74) |
1.82 ± 0.72 (39.42) |
|
t1/2 (h) |
3.81 ± 1.37 (36.05) |
3.53 ± 1.04 (29.52) |
Table 2: Summary of the pharmacokinetic parameters of metformin administered alone or in combination with red ginseng in 11 healthy subjects.
Values are presented as the arithmetic mean ± standard deviation (interindividual Coefficient of Variation (%CV)). AUCtau,ss indicates area under the plasma drug concentration–time curve within a dosing interval (tau) at steady state; Cmax,ss indicates maximum plasma drug concentration at steady state; CLss/F indicates apparent total clearance of the drug from the plasma after oral administration at steady state; Tmax,ss indicates time to reach the maximum plasma concentration at steady state; t1/2 indicates terminal elimination half-life.
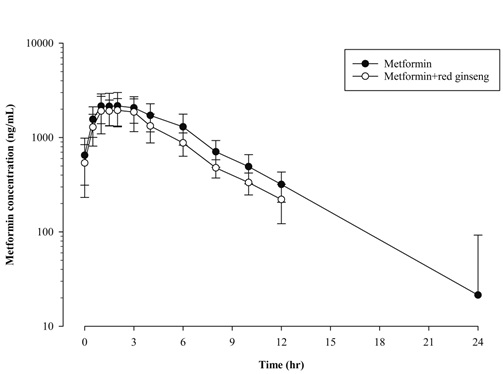
Figure 2: The arithmetic mean (+ standard deviation) plasma concentration–time profiles of metformin administered alone or in combination with red ginseng in 11 healthy subjects.
The GMR (90% CI) of the log-transformed AUCtau,ss of metformin when multiple doses of metformin were administered in combination with red ginseng versus when multiple doses of metformin were administered alone were 0.7973 (0.6734–0.9440). The systemic exposure of metformin when multiple doses of metformin were administered in combination with red ginseng was reduced by about 20% compared with that of metformin when administered alone (Table 3). The paired t-testperformed by satisfying the normality assumption showed no significant difference between the two groups for the AUCtau,ss of metformin when multiple doses of metformin were administered alone compared with combination with red ginseng (Table 3).
|
Pharmacokinetic parameter (unit) |
Geometric mean |
Geometric mean ratio† |
90% CI† |
p-value* |
|
|
Metformin
|
Metformin + red ginseng |
||||
|
AUCtau,ss (h×ng/mL) |
14,084.45 |
11,229.88 |
0.7973 |
0.6734–0.9440 |
0.0546 |
Table 3: Comparative analyses of the pharmacokinetic parameter, AUCtau,ss, of metformin administered in combination with red ginseng versus administered alone in 11 healthy subjects.
CI: Confidence Interval; AUCtau,ss: Area Under the plasma drug Concentration–time response curve within a dosing interval (tau) at steady state. Compared between the two groups by Two One-Sided t-Tests (TOST)† and paired t-test*.
Pharmacodynamic properties
The pharmacodynamic evaluation included 11 subjects who completed all scheduled blood samplings for pharmacodynamic assessments. The AUClast and Gmaxwere calculated based on the blood glucose values that were measured by an OGTT for each group before administration (baseline), after metformin administration alone and after metformin administration in combination with red ginseng (Table 4). The arithmetic mean blood value–time profiles of glucose are shown for each group in figure 3.
|
Pharmacodynamic parameters (unit) |
Baseline |
Metformin |
Metformin + red ginseng |
p-value* |
p-value** |
|
|
AUClast (h×mg/dL) |
|
415.53 ± 55.70 (13.41) |
430.92 ± 52.54 (12.19) |
458.09 ± 58.86 (12.85) |
0.3927 |
0.0132 |
|
p-value‡ |
0.2102 |
|
|
|||
|
Gmax (mg/dL) |
|
158.55 ± 15.83 (9.99) |
138.82 ± 17.57 (12.65) |
148.64 ± 18.90 (12.72) |
0.0254 |
0.1069 |
|
p-value‡ |
0.0429 |
|
|
|||
Table 4: Statistical analyses of the pharmacodynamic parameters, AUClast and Gmax, of glucose at baseline, after multiple doses of metformin administered alone, and in combination with red ginseng in 11 healthy subjects.
Values are presented as arithmetic mean ± standard deviation (interindividual Coefficient of Variation (%CV)). AUClast, Area Under the blood glucose values–time curve from time zero to the time of the last measurable value; Gmax, maximum blood glucose value. Compared between the two groups (before metformin administration (baseline) and after multiple doses of metformin administered alone) by paired t-test*; Compared between the two groups (before metformin administration (baseline) and after multiple doses of metformin administered in combination with red ginseng) by paired t-test**; Compared among the groups by Analysis of Variance (ANOVA)‡.
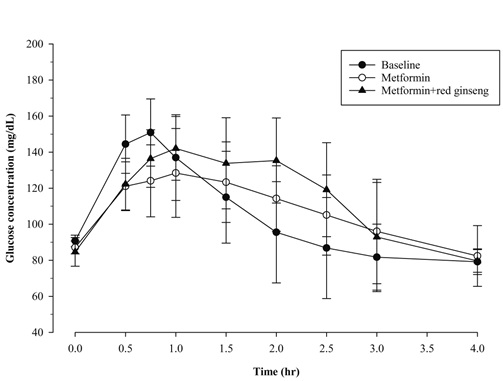 Figure 3: The arithmetic mean (+ standard deviation)blood value–time profiles of glucose at baseline, after multiple doses of metformin administered alone, and in combination with red ginseng(n = 11).
The paired t-test was performed by satisfying the normality assumption to determine whether there was any significant difference in the AUClast and Gmax of glucose between the two groups. When metformin were administered alone compared to the baseline value, there was a statistically significant difference in the Gmax of glucose, but was no significant difference in the AUClast of glucose. And, when metformin were administered in combination with red ginseng compared to the baseline value, there was a statistically significant difference in the AUClast of glucose, but was no significant difference in the Gmax of glucose (Table 4). The analysis of variance (ANOVA) performed by satisfying the assumptions of normality and homogeneity of variances to determine whether there was any significant difference among the groups for glucose AUClast and Gmaxbefore administration, after metformin administered alone and after metformin administered in combination with red ginseng showed that there was a statistically significant difference in the Gmax of glucose, but there was no significant difference in the AUClast of glucose (Table 4).
The GMR (90% CI) of the log-transformed AUClast and Gmax of glucose when metformin were administered in combination with red ginseng versus when metformin were administered alone were within the range of 0.8–1.25. The AUClast and Gmax of glucose following metformin in combination with red ginseng were found to be similar to metformin administered alone (Table 5).
|
Pharmacodynamic parameters (unit) |
Geometric mean |
Geometric mean ratio† |
90% CI† |
|
|
Metformin
|
Metformin + red ginseng |
|||
|
AUClast(h×mg/dL) |
427.88 |
454.80 |
1.0629 |
1.0060–1.1231 |
|
Gmax (mg/dL) |
137.79 |
147.55 |
1.0708 |
1.0078–1.1378 |
Table 5: Comparative analyses of the pharmacodynamic parameters, AUClast and Gmax, of glucose after multiple doses of metformin were administered in combination with red ginseng versus metformin administered alone in 11 healthy subjects.
CI: Confidence Interval; AUClast: Area Under the blood glucose values–time curve from time zero to the time of the last measurable value; Gmax: maximum blood glucose value.Compared between the two groups by Two One-Sided t-Tests (TOST) †.
The paired t-test performed by satisfying the normality assumption showed no statistically significant difference between the two groups for the change from baseline (%) of the glucose AUClast and Gmaxwhen metformin were administered alone and in combination with red ginseng (Table 6).
|
Change from baseline (%) |
Metformin |
Metformin + red ginseng |
p-value* |
|
AUClast |
−10.79 ± 10.78 |
−4.65 ± 14.04 |
0.0841 |
|
Gmax |
5.88 ± 11.13 |
11.46 ± 15.22 |
0.0986 |
Table 6: Comparative analyses of the change from baseline (%) of the pharmacodynamic parameters, AUClast and Gmax, of glucose following multiple doses of metformin administered alone and in combination with multiple doses of red ginseng in 11 healthy subjects.
Values are presented as arithmetic mean ± standard deviation. AUClast: Area Under the blood glucose values–time curve from time zero to the time of the last measurable value; Gmax: maximum blood glucose value. Compared between the two groups by the paired t-test*.
Safety
A total of three AEs including two instances of diarrhea and one instance of nausea occurred in three of the 11 subjects. All of the observed AEs were reported when multiple doses of metformin were administered alone and were determined to be ADRs probably related to metformin. The severity of the nausea case was mild and two diarrhea incidents were of moderate severity. All ADRs were self-resolved without any additional treatments.
DISCUSSION
We assessed the effects of Korean red ginseng on the pharmacokinetics and pharmacodynamics of metformin in healthy subjects.
The results of the pharmacokinetic analysis of this study demonstrated that the GMR (90% CI) of the log-transformed AUCtau,ss of metformin following administration in combination with red ginseng versus administration alone was out of the range of bioequivalence. This result indicates that the systemic exposure of metformin when combined with red ginseng was reduced compared with administration of metformin alone. However, in a study to evaluate the interactions between red ginseng and metformin in rats [24], they reported that the plasma concentration of metformin was increased due to enhanced intestinal OCT1 when metformin was orally administered to rats that had received repeated doses of red ginseng. This difference could be explained in part by the design of this clinical study which involved combined administration versus sequential administration in the nonclinical rat study. Unlike the reported in vitro and in vivo experiment which evaluated the interaction by administering metformin the next day after repeated doses of red ginseng [24], the herb–drug interactions in this study were evaluated by concurrently administering high doses of metformin and red ginseng to the subjects. Thus, it was thought that the absorption of metformin was relatively reduced due to the food effect of red ginseng when metformin was administered in combination with red ginseng, resulting in the lower systemic exposure of metformin in this study.
In the results of the pharmacodynamic analysis of this study, there was no statistically consistent difference among the groups in terms of the pharmacodynamic effects of metformin on the glucose levels. This could be caused by the study participants who were healthy volunteers. Healthy people, unlike diabetics, have normal glucose levels at baseline. Additionally, healthy individuals have effective homeostatic gluconeogenesis, so the maximal metformin effect could be masked [28].
Despite that red ginseng appears to reduce the systemic exposure of metformin, the measured GMR (90% CI) of the log-transformed AUClast and Gmax of glucose between the two groups were within the range of bioequivalence and there was no statistically significant difference between the two groups for the change from baseline (%) of the glucose AUClast and Gmax.The consistency of metformin hypoglycemic effects even when its systemic exposure is reduced could be attributed to the previous findings that remaining unabsorbed metformin in the intestinal tract, following administration of high doses of metformin, has local hypoglycemic effects [28]. In the previous report by Chung et al., [28] when high doses of metformin are administered, there is an inverse relationship between the systemic exposure of metformin and its hypoglycemic effects; this could be due to the local hypoglycemic effects of unabsorbed metformin in the intestinal tract. They explained that subjects with relatively low systemic exposure at high doses of metformin had a large amount of metformin remaining unabsorbed in the intestinal tract, which represented a local hypoglycemic effect in addition to the systemic glucose reduction effect of metformin, leading to a pharmacodynamic plateau.
This study was exploratory in nature and included a small number of healthy volunteers. In order to better understand the clinical effects of red ginseng on metformin, further studies with sufficient number of subjects, including diabetic patients, should be conducted. Also, a population pharmacokinetic and pharmacodynamic analysis would have been appropriate.
CONCLUSION
Red ginseng appears to reduce the systemic exposure of metformin compared with administration of metformin alone. However, the results of the pharmacodynamic analysis did not show any significant differences between the two groups. Therefore, we concluded that the observed reduction in the systemic exposure of metformin when administered with red ginseng is clinically insignificant. Additionally, the safety profiles of the study drugs were generally acceptable. This study demonstrated that Korean red ginseng did not have clinically significant pharmacokinetic or pharmacodynamic herb–drug interactions with metformin in healthy subjects.
AUTHOR CONTRIBUTIONS
Conceptualization, Woo Youl Kang; Methodology, Sook Jin Seong; Software, Wookjae Jung; Validation, Sook Jin Seong; Formal Analysis, Wookjae Jung; Investigation, Woo Youl Kang, Sook Jin Seong andMi-Ri Gwon; Resources, Mi-Ri Gwon and Hae Won Lee; Data Curation, Kwang-Hyeon Liu; Writing – Original Draft Preparation, Woo Youl Kang; Writing – Review & Editing, Hae Won Lee andYoung-Ran Yoon; Visualization, Sook Jin Seong; Supervision, Young-Ran Yoon; Project Administration, Young-Ran Yoon andSook Jin Seong; Funding Acquisition, Im-Sook Song.
ACKNOWLEDGMENT
The authors are grateful to all study participants and volunteer subjects. This study was supported by the grants from the Korea Health Technology R&D Project through the Korea Health Industry Development Institute funded by the Ministry of Health and Welfare, Republic of Korea (HI15C0001), as well as the Export Strategy Technology Development Project funded by the Ministry of Agriculture, Food and Rural Affairs, Republic of Korea (316017-03).
AUTHOR DISCLOSURE STATEMENT
No competing financial interests exist.
REFERENCES
- Kim MG, Kim Y, Jeon JY, Kim DS (2016) Effect of fermented red ginseng on cytochrome P450 and P-glycoprotein activity in healthy subjects, as evaluated using the cocktail approach. Br J Clin Pharmacol 82:1580-1590.
- Lee SM, Bae BS, Park HW, Ahn NG, Cho BG, et al. (2015) Characterization of Korean red ginseng (Panax ginseng Meyer): history, preparation method, and chemical composition. Journal of ginseng research 39: 384-391.
- Qi LW, Wang CZ, Du GJ, Zhang ZY, Calway T, et al. (2011) Metabolism of ginseng and its interactions with drugs. Curr Drug Metab 12: 818-822.
- Lee J, Lee E, Kim D, Lee J, Yoo J, et al. (2009) Studies on absorption, distribution and metabolism of ginseng in humans after oral administration. J Ethnopharmacol 122: 143-148.
- Kim DS, Kim Y, Jeon JY, Kim MG (2016) Effect of red ginseng on cytochrome P450 and P-glycoprotein activities in healthy volunteers. J Ginseng Res 40: 375-381.
- Choi KT (2008) Botanical characteristics, pharmacological effects and medicinal components of Korean Panax ginseng C A Meyer. Acta Pharmacol Sin 29: 1109-1118.
- Malati CY, Robertson SM, Hunt JD, Chairez C, Alfaro RM, et al. (2012) Influence of Panax ginseng on cytochrome P450 (CYP) 3A and P-glycoprotein (P-gp) activity in healthy participants. J Clin Pharmacol 52: 932-939.
- Yu CT, Chen J, Teng XW, Tong V, Chang TK (2005) Lack of evidence for induction of CYP2B1, CYP3A23, and CYP1A2 gene expression by Panax ginseng and Panax quinquefolius extracts in adult rats and primary cultures of rat hepatocytes. Drug Metab Dispos 33: 19-22.
- Gurley BJ, Gardner SF, Hubbard MA, Williams DK, Gentry WB, et al. (2005) Clinical assessment of effects of botanical supplementation on cytochrome P450 phenotypes in the elderly: St John's wort, garlic oil, Panax ginseng and ginkgo biloba. Drugs Aging 22: 525-539.
- Gurley BJ, Gardner SF, Hubbard MA, Williams DK, Gentry WB, et al. (2002) Cytochrome P450 phenotypic ratios for predicting herb-drug interactions in humans. Clin Pharmacol Ther 72: 276-287.
- Anderson GD, Rosito G, Mohustsy MA, Elmer GW (2003) Drug interaction potential of soy extract and Panax ginseng. J Clin Pharmacol 43: 643-648.
- Liu Y, Zhang JW, Li W, Ma H, Sun J, et al. (2006) Ginsenoside metabolites, rather than naturally occurring ginsenosides, lead to inhibition of human cytochrome P450 enzymes. Toxicol Sci 91: 356-364.
- Hao M, Zhao Y, Chen P, Huang H, Liu H, et al. (2008) Structure-activity relationship and substrate-dependent phenomena in effects of ginsenosides on activities of drug-metabolizing P450 enzymes. PLoS One 3: 2697.
- Li N, Wang D, Ge G, Wang X, Liu Y, et al. (2014) Ginsenoside metabolites inhibit P-glycoprotein in vitro and in situ using three absorption models. Planta medica 80: 290-296.
- Shi J, Cao B, Zha WB, Wu XL, Liu LS, et al. (2013) Pharmacokinetic interactions between 20 (S)-ginsenoside Rh2 and the HIV protease inhibitor ritonavir in vitro and in vivo. Acta Pharmacologica Sinica 34: 1349-1358.
- Zhang J, Zhou F, Wu X, Gu Y, Ai H, et al. (2010) 20(S)-ginsenoside Rh2 noncompetitively inhibits P-glycoprotein in vitro and in vivo: a case for herb-drug interactions. Drug Metabolism and Disposition 38: 2179-2187.
- Jin J, Shahi S, Kang HK, van Veen HW, Fan TP (2006) Metabolites of ginsenosides as novel BCRP inhibitors. Biochemical and biophysical research communications 345: 1308-1314.
- Seong SJ, Kang WY, Heo JK, Jo J, Choi WG, et al. (2018) A comprehensive in vivo and in vitro assessment of the drug interaction potential of red ginseng. Clinical therapeutics 40: 1322-1337.
- Liu Z, Li W, Li X, Zhang M, Chen L, et al. (2013) Antidiabetic effects of malonyl ginsenosides from Panax ginseng on type 2 diabetic rats induced by high-fat diet and streptozotocin. J Ethnopharmacol 145: 233-240.
- Choi MK, Jin QR, Ahn SH, Bae MA, Song IS (2010) Sitagliptin attenuates metformin-mediated AMPK phosphorylation through inhibition of organic cation transporters. Xenobiotica 40: 817-825.
- Zhou M, Xia L, Wang J (2007) Metformin transport by a newly cloned proton-stimulated organic cation transporter (plasma membrane monoamine transporter) expressed in human intestine. Drug Metab Dispos 35: 1956-1962.
- Müller J, Lips KS, Metzner L, Neubert RH, Koepsell H, et al. (2005) Drug specificity and intestinal membrane localization of human organic cation transporters (OCT). Biochem Pharmacol 70: 1851-1860.
- Nam SJ, Han YJ, Lee W, Kang B, Choi MK, et al. (2018) Effect of red ginseng extract on the pharmacokinetics and efficacy of metformin in streptozotocin-induced diabetic rats. Pharmaceutics 10: 80.
- Jin S, Lee S, Jeon JH, Kim H, Choi MK, et al. (2019) Enhanced intestinal permeability and plasma concentration of metformin in rats by the repeated administration of red ginseng extract. Pharmaceutics 11: 189.
- Daewoong Pharmaceutical (2020) Diabex tablet 1000 mg® (metformin hydrochloride 1000 mg). Daewoong Pharmaceutical, Seoul, Republic of Korea.
- Korea Ministry of Food and Drug Safety (MFDS) (2020) Criteria and standards of health functional food. Korea Ministry of Food and Drug Safety, Korea.
- Korea Ministry of Food and Drug Safety (MFDS) (2020) Public Official's Guide/Guidelines for Complainants. Korea Ministry of Food and Drug Safety, Korea.
- Chung H, Oh J, Yoon SH, Yu KS, Cho JY, et al. (2018) A non-linear pharmacokinetic-pharmacodynamic relationship of metformin in healthy volunteers: an open-label, parallel group, randomized clinical study. PLoS One 13: 0191258.
- Rhee Sj, Choi Y, Lee S, Oh J, Kim SJ, et al. (2016) Pharmacokinetic and pharmacodynamic interactions between metformin and a novel dipeptidyl peptidase-4 inhibitor, evogliptin, in healthy subjects. Drug Des Devel Ther 10: 2525-2534.
- US Department of Health and Human Services, Food and Drug Administration (2020) Clinical Pharmacology Data to Support a Demonstration of Biosimilarity to a Reference Product. US Department of Health and Human Services, Food and Drug Administration, USA.
Citation: Kang WY, Jung W, Gwon M-R, Lee HW, Song IS, et al. (2020) Effects of Korean Red Ginseng on the Pharmacokinetics and Pharmacodynamics of Metformin in Healthy Subjects. J Altern Complement Integr Med 6: 138.
Copyright: © 2020 Woo Youl Kang, et al. This is an open-access article distributed under the terms of the Creative Commons Attribution License, which permits unrestricted use, distribution, and reproduction in any medium, provided the original author and source are credited.