Effects of Levetiracetam on Aquaporin 4 Expression in the Rat Hippocampus with Brain Edema Following Status Epilepticus
*Corresponding Author(s):
Jiwei WangDepartment Of Neurosurgery, The First Hospital Of Hebei Medical University, Donggang Road, Shijiazhuang 050000, Hebei Province, China
Tel:+86031187155061/ 17788210226,
Email:451656516@qq.com
Abstract
This research was designed to explore the effects of levetiracetam on aquaporin 4 (AQP4) expression in the hippocampus of rat with brain edema after Status Epilepticus (SE) induced by lithium-pilocarpine. SE model was induced by lithium followed by pilocarpine 20 hours later. Methyl-scopolamine was administered 30 minutes prior to the pilocarpine injection to block peripheral cholinergic effects. The acute behavioral feature of SE was evaluated according to the modified six-stage classification of Racine. SE was defined as continuous convulsions at stage 4 to 5 seizures for at least 1 hour and terminated by Diazepam 2 hours after onset of SE. Adult male Sprague-Dawley rats were randomized into three groups: sham operation group, status epilepticus group, and levetiracetam group. Brain edema models in rat following status epilepticus were established by intraperitoneal injection of lithium-pilocarpine, and intervened by levetiracetam. Samples from all groups were collected at 6, 12, 24 hours, 3 and 7 days after the status epilepticus models established successfully. Histological observation was performed by hematoxylin-eosin staining. The ultrastructural changes were observed by transmission electron microscopy. Brain water content was measured by the dry-wet method. AQP4 and AQP4 mRNA expression was detected respectively by western blot assay and RT-PCR. The brain water content, AQP4 expression and AQP4 mRNA expression in levetiracetam group at each time points were lower than status epilepticus group, and the differences were statistically significant (P < 0.05). Levetiracetam can decrease brain edema caused by status epilepticus through down-regulating AQP4 and AQP4 mRNA expression.
Keywords
Epilepticus ; levetiracetam ; Mitochondrion edema
Introduction
Epilepsy is one of the most common neurological diseases which affects 0.5-1% of the general population [1]. Despite formal anti-epileptic drugs treatment, up to 30% of patients still have uncontrolled seizures. 3-6% of epileptic patients tend to develop Status Epilepticus (SE) with a case fatality rate of approximately 2% [2]. Edema formation and neuron injury in hippocampus are the main pathological damages following SE [3,4]. The pathophysiological alterations in rodent brain after lithium-pilocarpine induced SE are comparable to those observed in temporal lobe epilepsy patients [3,5]. Aquaporin 4 (AQP4) is one kind of major membrane proteins which mediates bidirectional transmembrane transfer of water molecules in the brain tissue, and plays a key role in encephaledema [6,7]. Levetiracetam has been shown to mitigate brain edema and protect neurons besides antiepileptic effect [8,9], nevertheless, the mechanism of action is still dimness. The purpose of this present study is to survey the role of levetiracetam in brain edema and AQP4 expression which might provide theoretical basis for the effects of levetiracetam on alleviating brain edema induced by SE.
Materials and Methods
- Experimental animals
120 healthy adult male Sprague-Dawley rats of clean grade weighing 280-320 g were provided by the Experimental Animal Center of the First Hospital of Hebei Medical University in China, certificate no. SCXK (Ji) 2021-1-003. The rats were housed at a constant temperature (23°C) and relative humidity (60%), with a 12-hour light and dark cycle (8:00-12:00), allowed free intake of food and water. All procedures were permitted by the Animal Care Committee of the First Hospital of Hebei Medical University and were in accordance with the guiding principles of the National Institutes of Health (Bethesda, MD, USA) on the care and use of animals.
- Main reagents and instruments
There were levetiracetam oral liquid (150 ml: 15 g, Approval No. GYZZJ20160060; NextPharma SAS, France), lithium, pilocarpine and Methyl-scopolamine (Sigma, USA); rabbit anti-mouse AQP4 polyclonal antibody, horseradish peroxidase-labeled goat anti-rabbit IgG, (Santa Cruz, USA), RNA Trizol Reagent (Invitrogen), reverse transcriptase (M-MLV), ribonuclease inhibitor (RNasin), random primers, and Taq DNA polymerase (Promega, USA), quantitative fluorescent RT-PCR kit (BBI Company), transmission electron microscopy (Hitachi Corp., JAP), gel imaging analysis system (UVP Company, USA) and ABI 7300 real-time PCR system (ABI Company, USA).
- Model establishment and intervention
The rats were randomly divided into three groups:sham operation group (SO group, n=40), status epilepticus group (SE group, n=40), levetiracetam group (LEV group, n=40). SO group, SE group and LEV group were subdivided into six subgroups (n=8) according to time points posterior to SE model creation (6, 12, 24 hours, 3 and 7 days). SE model was induced by lithium (127 mg/kg, i.p.) followed by pilocarpine (25 mg/kg, i.p.) 20 hours later. Methyl-scopolamine (1 mg/kg, i.p.) was administered 30 minutes prior to the pilocarpine injection to block peripheral cholinergic effects. Pilocarpine was substituted with saline in SO group. The acute behavioral feature of SE was evaluated according to the modified six-stage classification of Racine. SE was defined as continuous convulsions at stage 4 to 5 seizures for at least 1 hour and terminated by Diazepam (10 mg/kg, i.p.) 2 hours after onset of SE. Rats in the LEV group were intragastrically given levetiracetam oral solution 300 mg/kg/d, once a day 1 hour after seizure. Rats in the SO and SE groups were intragastrically administered the same amount of normal saline.
Sample Preparation
At 6, 12, 24 hours, 3 and 7 days after SE model establishment, 8 rats in each group were perfused transcardially with 4 ? saline solution followed by precooled 4% paraformaldehyde in 0.1 M phosphate buffer (PB, pH 7.4) for 1.5 hour under 10% chloral hydrate anesthesia (0.3 g/kg, i.p.). The brain was removed from the skull immediately and the bilateral hippocampal formations were isolated. The right hippocampal tissue was divided into two parts, one part in liquid nitrogen tank was stored at?80? for western blot analysis and real time polymerase chain reaction (RT-PCR) quantification, while the other part was utilized for edema measurement. The left hippocampus was also divided into two parts for HE staining and transmission electron microscopy (TEM) observation.
- Brain moisture content as detected by the dry-wet method
Brain water content was determined by the dry-wet method. At 2, 6, 12, 24 hours, 3 and 7 days after SE model establishment, 8 rats in each group were sacrificed. One part of the right hippocampus was dried by a filter paper, and weighed through the electronic analytical balance with 0.0001 g accuracy to gain the wet weight (W). Then the same tissue was dried in a 110 °C drier for 24 hours, and weighed to obtain the dry weight (D). In conformity with Elliot formula, brain water content (%) was measured by (W–D)/W × 100%.
- Hematoxylin-eosin staining and TEM observation
The left hippocampus was fixed in 4% paraformaldehyde in 0.1 M Phosphate Buffer Saline (PBS) for 12 hours and embedded in paraffin. The 5-μm paraffin slices were dewaxed, hydrated, and stained with hematoxylin and eosin. The extent and scope of abnormal neurons in the CA3 zone of hippocampus were observed with a light microscope. For TEM, a 1 mm3 tissue block of left hippocampus was prefixed in 4% glutaraldehyde solution and postfixed in 1% osmic acid, and embedded in Epon 812.50 nm ultrathin sections were then stained with uranyl acetate and lead citrate, and imaged using TEM (Hitachi H-7500).
- AQP4 protein expression as detected by western blot assay
The right hippocampal tissues were cut into pieces on the ice and were homogenized in ice cold RIPA buffer containing 150 mM NaCl, 1% NP-40, 0.5% sodium deoxycholate, 0.1% sodium dodecyl sulfate, 50 mM Tris-HCl, and 0.1% ethylenediamine tetraacetic acid. The protein content of the supernatant was measured by the Thermo Scientific Pierce BCA Protein Assay Quantification Kit. To detect AQP4, 40 μg of proteins was loaded onto each lane and separated by 10% sodium dodecyl sulfate-polyacrylamide gels, and transferred electrically to nitrocellulose membranes. The membranes were blocked by the 5% defatted milk powder at ambient temperature for 2 hours, incubated with AQP4 rabbit anti-rat polyclonal antibody (1:200) at 4 °C overnight. After three rinses with PBS plus Tween-20, the blots were detected with goat anti-rabbit IgG (1:6,000) tagged with horseradish peroxidase at environmental temperature for 2 hours and visualized by the enhanced chemiluminescence kit. β-actin was served as internal reference . Integral optical density (IOD) values of target band and internal reference were measured an calculated by the gel image analysis system. The ratio of IOD value between target band and internal reference represented the relative expression levels of AQP4 protein.
- AQP4 mRNA expression as detected by RT-PCR
The total RNA was successfully extracted from right hippocampus in each group by Trizol RNA Isolation extraction kit. RNA purity was assayed by the ultraviolet spectrophotometry. OD values at 260 nm and 280 nm (OD260 and OD280) were determined by ultraviolet spectrophotometry. The ratio of OD260/OD280 was set between 1.8 and 2.0. cDNA was synthesized by the M-MLV reverse transcription kit. PCR amplification was performed using cDNA as a template. The primer sequences were designed and synthesized by Sangon Biotech(Shanghai) using NCBI Genebank and Primer Premier 5.0 software. β-actin was used as an internal reference. Primer sequences were as follows:
AQP4 primer:
Upstream 5′-GTCCTCATCTCCCTTTGCTT-3′;
Downstream 5′-GACTCCCAATCCTCCAACCA-3′;
β-actin primer:
Upstream 5′-GAAGATCAAGATCATTGCTCCT -3′;
Downstream 5′-TACTCCTGCTTGCTGATCCA -3′
Quantitative fluorescent PCR was conducted by a quantitative fluorescent reagent kit using ABI 7300 real-time PCR system. Briefly, 1 μL of cDNA template was added to 10 μL of 2 × SYBR green PCR master mix (Bio Basic Inc.), 2 μL of each primer and nuclease-free water 7 μL to a final volume of 20 μL. Thermal cycling parameters were: 96 °C for 4 minutes, followed by 40 cycles of 94 °C for 30 seconds, 58 °C for 30 seconds, and 72 °C for 30 seconds. Fluorescence signal was gathered at 72 °C for 30 seconds in each cycle. After amplification, β-actin was served as an internal reference gene. The threshold cycle (Ct) values were analyzed with ABI 7300 SDS software (Applied Biosystems) to detect fluorescence. A comparative Ct method was applied to calculate relative quantification, which was used in the final statistical analyses.
Statistical Analysis
All the results were analyzed by SPSS17.0 statistical software, and expressed as mean ± SD. Differences in means among multiple groups were analyzed using two-ways ANOVA. The comparison between groups was carried out by Tukey's post hoc comparisons.The statistical significance for all tests was set at P < 0.05.
Results
- Histological and ultra-structural observation
As shown in (Figure 1), the morphological manifestations of hippocampal CA3 area were normal in SO group. In the SE group, the perineuronal space was widened, and the neurons were swelled and became worsen at 6-12 hours post injury. Neuronal swelling reached the peak at 24 hours, started to decline at 3 days, and decreased dramatically at 7 days. Compared with the SE group, the extent of neuronal swelling was reduced at various time points in the LEV group.
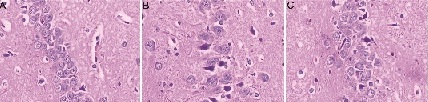 Figure 1: The HE staining of hippocampal CA3 area in different groups at 24 hours. A: SO group, B: SE group, C: LEV group
There is no significant pathological lesion in brain tissue slice of SO group. The swollen cells were successively alleviated in SE and LEV groups. Scale bar: 100 μm (×400). As shown in (Figure 2) mitochondrion edema with disarrangement or fragmentation of mitochondrial cristae was found in SE group. Mitochondrion edema was alleviated and mitochondrial cristae were increased in the LEV group.
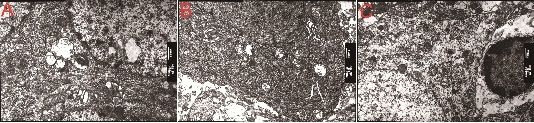 Figure 2: The ultra-structural changes in different groups at 24 hours by TEM (×6000). A: SO group, B: SE group, C: LEV.
Mitochondrion edema was consecutively alleviated in SE and LEV groups.
- Determination of brain water content
Compared with the SO group, the brain water content of SE group at 6 hours ascended slightly (80.77 ± 1.12, P < 0.05), rose obviously at 12 hours (82.62 ± 1.39, P < 0.05), came up to its peak at 24 hours (83.41±1.66, P < 0.05), then began to decrease at 3 days (82.41 ± 1.41, P < 0.05), and dropped greatly at 7 days (78.80 ± 0.75, P < 0.05). The brain water content was significantly lower in the LEV group than in the SE group, and statistical significance was observed between the two groups at each time point P < 0.05 as shown in (Figure 4 & Table 1).
|
|
Brain water content (%) |
AQP4 expression |
AQP4 mRNA expression |
||||||
|
SO |
SE |
LEV |
SO |
SE |
LEV |
SO |
SO |
SE |
|
|
6h |
74.18 ± 0.72 |
80.77 ± 1.12* |
77.83 ± 1.67*# |
0.085 ± 0.011 |
0.164 ± 0.020* |
0.134 ± 0.021*# |
0.993 ± 0.078 |
6h |
74.18 ± 0.72 |
|
12h |
74.12 ± 0.63 |
82.62 ± 1.39* |
78.70 ± 1.56* # |
0.086 ± 0.013 |
0.236 ± 0.017* |
0.198 ± 0.019*# |
0.976 ± 0.053 |
12h |
74.12 ± 0.63 |
|
24h |
74.24 ± 1.00 |
83.41 ± 1.66* |
79.49 ± 1.59*# |
0.093 ± 0.010 |
0.246 ± 0.016* |
0.206 ± 0.012*# |
1.069 ± 0.081 |
24h |
74.24 ± 1.00 |
|
3d |
74.44 ± 0.66 |
82.41 ± 1.41* |
78.44 ± 1.70*# |
0.095 ± 0.011 |
0.206 ± 0.021* |
0.164 ± 0.025*# |
0.980 ± 0.077 |
3d |
74.44 ± 0.66 |
|
7d |
74.13 ± 0.77 |
78.80 ± 0.75* |
76.64 ± 2.03*# |
0.095 ± 0.013 |
0.163 ± 0.014* |
0.131 ± 0.006*# |
0.963 ± 0.077 |
7d |
74.13 ± 0.77 |
Table 1. Brain water content, AQP4 expression and AQP4 mRNA expression at different time points in each group (± S %, n=8) 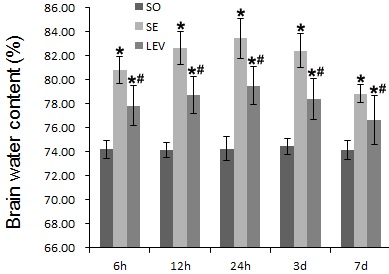
Figure 4: Levetiracetam effects on brain water content in rats with brain edema in each group.
Each column represents the mean (%) ± SD. Results were analyzed by two-ways ANOVA followed by Tukey's post hoc comparisons (each group, n=8). *P < 0.05, vs. SO group; #P < 0.05, vs. SE group at the same time point.
- Determination of AQP4 using western blot assay
Compared with the SO group, AQP4 expression showed an ascendant trend in the SE and LEV groups (P < 0.05). AQP4 expression was lower in the LEV group than that in the SE group at various time points (P < 0.05) (Figure 3 & Table 1).
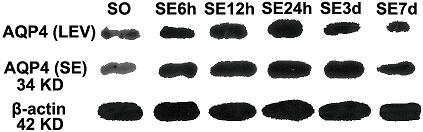 Figure 3: The expression of AQP4 protein in the different groups by western blot assay with β-actin as housekeeping gene.
- Detection of AQP4 mRNA expression using RT-PCR
AQP4 mRNA expression was significantly higher in the SE and LEV groups than that in the SO group (P < 0.05). AQP4 mRNA expression was meaningfully lower in the LEV group than that in the SE group at various time points (P < 0.05) (Figure 5 & Table 1).
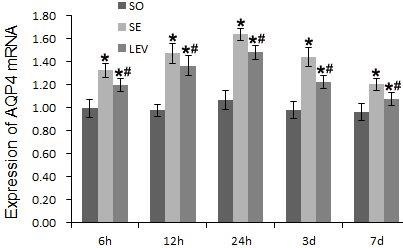 Figure 5: Levetiracetam effects on AQP4 mRNA expression in rats of each group.
RT-PCR was used to measure AQP4 mRNA expression levels. The data are presented as mean ± SD and were analyzed by two-ways ANOVA followed by Tukey's post hoc comparisons (each group, n=8). *P < 0.05, vs. SO group; #P < 0.05, vs. SE group at the same time point.
Discussion
SE results in neuronal degeneration and necrosis of hippocampus, and brain edema [2, 10]. These injured neurons showed typical hallmarks of programmed cell death mediated by mitochondria, which was confirmed by TEM observation consisting of mitochondria swelling and crista fragmentation in this research. Brain edema formation in lithium-pilocarpine model of SE in rat has been verified by pathology and imaging [11]. Brain edema is one of the main pathological events after SE and an important reason leading to neurological dysfunction and acute death, which begins with cytotoxic edema, followed by vasogenic edema [12]. Brain water content of SE group was significantly higher than that of SO group in this study, which suggested that SE produced brain edema. This result was fairly accorded with literatures [13]. AQP4 is mainly expressed in astrokeratinocytes and ependymal cells,and is most abundant in the subarachnoid space, the surface of astrocytes around blood vessels, and the glial boundary membrane formed by astrocytes' endfeet surrounding capillary walls. Above distribution is respectively called polar distribution. These distribution characteristics suggest that AQP4 plays an important role in maintaining cerebral water balance, and is an important structural basis for water regulation and transport between glial cells, cerebrospinal fluid and blood vessels. Meanwhile, the distribution of AQP4 in pia, ependymal cells around the ventricular system and chorioplexus epithelial cells was consistent with the sites of CSF reabsorption, suggesting that CSF may be reabsorbed through AQP4 on these cells.The level of AQP4 protein in the hippocampal formation analyzed by western blotting began to rise after 6 hours, reached the peak at 24 hours, began to decrease at 3 days, and dropped obviously at 7 days. In a rat model of kainite induced- temporal lobe epilepsy, AQP4 expression in western blot was also increased apparently [14]. The trend of AQP4 expression was basically consistent with the changes in brain water content, which suggested that AQP4 might participate in the formation of brain edema and SE could activate AQP4. Binder et al demonstrated that AQP4 deficient mice subjected to seizure showed increased seizure duration and increased seizure threshold than wild-type mice [15], which indicated AQP4 could take part in the regulation of brain excitability. AQP4 expression was obviously up-regulated in human sclerotic hippocampal tissue following temporal lobe epilepsy. In this study, the changes of brain edema induced by SE were consistent with the expression trend of AQP4 and AQP4 mRNA,which confirmed that the up-regulation of AQP4 expression was closely related to the formation of brain edema.Levetiracetam is quickly absorbed orally and has anti-epileptic and neuroprotective effects [16, 17], which also reduce the mortality effectively in a model of SE in rats induced by paraoxon [18]. In a brain edema model of SE induced by pilocarpine, repeated administration of high-dose levetiracetam after termination of SE by diazepam not only dramatically reduced the incidence of spontaneous recurrent seizures, but also obviously alleviated brain edema and neuronal damage [19]. The blood-brain barrier integrity was protected by levetiracetam in rat vasogenic edema model of SE, which might prevent the development of spontaneous recurrent seizures via the inhibition of brain edema events.[20]. This study confirmed that levetiracetam could not change the trend of cerebral edema, but could significantly reduce the degree of cerebral edema. It is suggested that the increase of AQP4 protein expression may be caused by the increase of AQP4 mRNA synthesis. The inhibitory effect of levetiracetam on AQP4 and AQP4 mRNA expression was consistent with the inhibitory effect of levetiracetam on brain water content. Taken together, levetiracetam may alleviate SE-induced brain edema by down-regulating AQP4 mRNA expression and inhibiting AQP4 expression. These results provide an experimental basis for the clinical application of levetiracetam in the treatment of SE.
Conclusion
This study showed that levetiracetam could effectively reduce brain water content, relieve brain edema and protect neurons by down-regulating AQP4 mRNA expression. The exact mechanism of down-regulation of AQP4 mRNA expression deserves further investigations.
Highlights
- Brain edema in the hippocampus of rat was successfully demonstrated after status epilepticus induced by lithium-pilocarpine.
- AQP4 and AQP4 mRNA expressions were evidently up-regulated in rat edematous hippocampal tissue following status epilepticus.
- Levetiracetam can reduce brain edema from status epilepticus by down-regulating AQP4 and AQP4 mRNA expression.
References
- Silbergleit R, Elm JJ (2019) Levetiracetam no better than phenytoin in children with convulsive status epilepticus. Lancet 393: 2101-2102.
- Park H, Choi SH, Kong MJ, Kang TC (2019) Dysfunction of 67-kDa Laminin Receptor Disrupts BBB Integrity via Impaired Dystrophin/AQP4 Complex and p38 MAPK/VEGF Activation Following Status Epilepticus. Front Cell Neurosci 13: 236.
- Kim JE, Yeo SI, Ryu HJ, Kim MJ, Kim DS, et al. (2010) Astroglial loss and edema formation in the rat piriform cortex and hippocampus following pilocarpine-induced status epilepticus. J Comp Neurol 518: 4612-4628.
- Wang D, Pan Y, Huang K, Lin Z, Xie Z, et al. (220) Is rat hippocampus section immunostaining an indicator for immunotherapy in cryptogenic adult new-onset refractory status epilepticus (NORSE). Seizure 76: 131-136.
- Janicot R, Stafstrom CE, Shao LR. (2020) 2-Deoxyglucose terminates pilocarpine-induced status epilepticus in neonatal rats. Epilepsia 61: 1528-1537.
- Kitchen P, Salman MM, Halsey AM, Clarke-Bland C, MacDonald JA, et al.(2020) Targeting Aquaporin-4 Subcellular Localization to Treat Central Nervous System Edema. Cell 181: 784-99.
- Xiong R, Yu J, Liu Y, Liu K, Jin G, et al. (2021) Aquaporin-4 is a potential drug target for traumatic brain injury via aggravating the severity of brain edema. Burns Trauma 9: tkaa050.
- Lee DS, Ryu HJ, Kim JE, Choi HC, Kim YI, Song HK, et al. (2013) The effect of levetiracetam on status epilepticus-induced neuronal death in the rat hippocampus. Seizure 22: 368-77.
- Imai T, Sugiyama T, Iwata S, Nakamura S, Shimazawa M, et al. (2020) Levetiracetam, an Antiepileptic Drug has Neuroprotective Effects on Intracranial Hemorrhage Injury. Neuroscience 431: 25-33.
- Vila Verde D, Zimmer T, Cattalini A, Pereira MF, van Vliet EA, et al. (2021) Seizure activity and brain damage in a model of focal non-convulsive status epilepticus. Neuropathol Appl Neurobiol 47: 679-693.
- Malheiros JM, Persike DS, Castro LU, Sanches TR, Andrade Lda C, et al. (2014) Reduced hippocampal manganese-enhanced MRI (MEMRI) signal during pilocarpine-induced status epilepticus: edema or apoptosis. Epilepsy Res108: 644-652.
- Park H, Kang TC (2019) The Regional Specific Alterations in BBB Permeability are Relevant to the Differential Responses of 67-kDa LR Expression in Endothelial Cells and Astrocytes Following Status Epilepticus. Int J Mol Sci 20: 6025.
- Kim JE, Park H, Lee JE, Kang TC (2020) Blockade of 67-kDa Laminin Receptor Facilitates AQP4 Down-Regulation and BBB Disruption via ERK1/2-and p38 MAPK-Mediated PI3K/AKT Activations. Cells 9: 1670.
- Alvestad S, Hammer J, Hoddevik EH, Skare Ø, Sonnewald U, et al. (2013) Mislocalization of AQP4 precedes chronic seizures in the kainate model of temporal lobe epilepsy. Epilepsy Res 105: 30-41.
- Binder DK, Oshio K, Ma T, Verkman AS, Manley GT (2004) Increased seizure threshold in mice lacking aquaporin-4 water channels. Neuroreport 15: 259-262.
- Imran I, Koch K, Schöfer H, Lau H, Klein J (2019) Effects of Three Anti-Seizure Drugs on Cholinergic and Metabolic Activity in Experimental Status Epilepticus. J Pharm Pharm Sci 22: 340-351.
- Avdic U, Ahl M, Andersson M, Ekdahl CT (2021) Levetiracetam and N-Cadherin Antibody Alleviate Brain Pathology Without Reducing Early Epilepsy Development After Focal Non-convulsive Status Epilepticus in Rats. Front Neurol 12: 630154.
- Deshpande LS, Blair RE, Halquist M, Kosmider L, DeLorenzo RJ (2020) Intramuscular atenolol and levetiracetam reduce mortality in a rat model of paraoxon-induced status epilepticus. Ann N Y Acad Sci 1480: 219-232.
- Itoh K, Inamine M, Oshima W, Kotani M, Chiba Y, et al. (2020) Prevention of status epilepticus-induced brain edema and neuronal cell loss by repeated treatment with high-dose levetiracetam. Brain Res 1608: 225-234.
- Itoh K, Ishihara Y, Komori R, Nochi H, Taniguchi R, et al. (2016) Levetiracetam treatment influences blood-brain barrier failure associated with angiogenesis and inflammatory responses in the acute phase of epileptogenesis in post-status epilepticus mice. Brain Res 1652: 1-13.
Citation: Wang J, Jin H, Tian Y, Yang C, Li C (2023) Effects of Levetiracetam on Aquaporin 4 Expression in the Rat Hippocampus With Brain Edema Following Status Epilepticus. J Brain Neursci 7: 023.
Copyright: © 2023 Jiwei Wang, et al. This is an open-access article distributed under the terms of the Creative Commons Attribution License, which permits unrestricted use, distribution, and reproduction in any medium, provided the original author and source are credited.