Effects of the Hypoxia-Mimetic Agents DFO and CoCl2 on HeLa-Fucci Cells
*Corresponding Author(s):
Baptiste BedessemCNRS, Laboratory TIMC-IMAG/DyCTIM, Grenoble, France
Tel:+33 0456520045,
Email:baptiste.bedessem@imag.fr
Abstract
The Fucci system is a promising model to study the cell cycle in vivo and in vitro. Because it enables to follow the progression of the cycle using fluorescent microscopy, it can be used to precisely visualize the effects of external strains on proliferation. However, it was reported that the lack of oxygen strongly affects the fluorophores used in the HeLa-Fucci cell line. As a consequence, it limits its use in hypoxic conditions. To study the effects of hypoxia on cell proliferation by using this cell line, one could use HiF-1α inducers, such as CoCl2 and DFO, which are often used as hypoxia-mimetic agents. As these iron-chelators also have anti-cancer properties, their biological effects were studied in various experimental conditions. A great variability of actions were reported. In this study, we investigate for the first time their effects on HeLa-Fucci cells proliferation dynamics. We find that CoCl2 has a biphasic effect on the cell cycle, by promoting or inhibiting the progression into the G1-phase. In presence of DFO, we identified an arrest in the G2-phase, which follows a switch-like behavior. These observations bring original results since iron-chelators are mainly known to induce an arrest at the G1/S transition. They also provide specific information about the possibility to use Fucci cells to study the influence of hypoxia on the cell cycle. Finally, by considering the known genetic characteristics of HeLa cells we propose a hypothesis to explain the particular response of Fucci cells to DFO and CoCl2. The discussion proposes a plausible action of DFO and CoCl2 on the MAPK pathway.
Keywords
BACKGROUND
The Fucci (Fluorescent Ubiquitination-Based Cell Cycle Indicator) cell is a recently created line of HeLa cells (cervix carcinoma) [1]. This system uses a couple of oscillating cell cycle proteins, cdt1 and geminin, respectively labeled with monomeric Kusabira Orange 2 and monomeric Azami Green. As a consequence, the G1, S, and G2/M phases are labeled with different colors. This cell line is useful to quantify the duration of each phase of the cycle, and to determine the percentage of cycling and non-cycling cells in a non destructive way. Notably, it can be used to visualize in vivo the progression of the cycle [2,3]. In vitro, it is a good tool to observe the effects on cell dynamics of various environmental strains, such as hypoxia. The study of the cellular and molecular effects of hypoxia is one of the important challenge of modern biology. Indeed, it is well established that tumor cells undergo chronic hypoxia, due to the limit of oxygen diffusion in the cancer tissue [4,5]. This chronic hypoxia correlates with an increased resistance to chemotherapy [6,7]. Notably, hypoxia activates anti-apoptotic pathways [8] and can induce proliferation of cancer cells. Indeed, even though hypoxia is known to induce cell cycle arrest in G1 phase [9], it was shown that chronic hypoxia can also stimulate proliferation in various cell lines [10-13]. In a general way, it seems that a balance exists between death and survival/proliferating pathways, depending on the duration and severity of the hypoxic event [14]. The complexity of the cellular response to hypoxia is controlled by the HiF-1α factor, which accumulates when oxygen is lacking [15]. This factor activates signaling pathways which regulate proliferation and death. It was often observed that HiF-1α accumulates in cancer cells [16,17]. This accumulation can be due to the physiological chronic hypoxia of cancer cells or genetically determined, for instance by the mutations affecting the Von Hippel-Lindau (VHL) gene [18].
However, the study of the effects of hypoxia using HeLa-Fucci cell line is complex since the lack of oxygen was shown to modify the fluorescence of Kusabira Orange and Azami Green, as shown by Kaida et al., [19,20]. This artefact makes difficult the use of HeLa-Fucci cells in real hypoxic conditions. As a consequence, the study of the effect of the hypoxia pathway, notably the stabilization of HiF-1α, on cell cycle dynamics using this cell line could be done through the use of hypoxia-mimetic chemicals. Indeed, various molecules can be used to mimic hypoxia by inducing HiF-1α accumulation, such as Cobalt Chloride (CoCl2), Dimethyloxalylglycine (DMOG), Desferrioxamine (DFO). These molecules are also studied for their anti-cancer effect, as iron-chelators [21,22]. In a general way, they induce HiF-1α accumulation, but they also have numerous HiF-1α-independent effects [23]. Notably, they are known to induce apoptosis [8] and cell cycle arrest through complex interactions with regulating proteins [22]. CoCl2 and DFO are certainly the most commonly used hypoxia-mimetic molecules [24]. As a consequence, their biological effects were relatively well tested over the last years. They both induce apoptosis when their concentration is high enough [8,25,26]. However, CoCl2 seems to promote cell survival during the first 6-8 hours of treatment [27,28]. Cell proliferation in presence of these agents was assessed using different cell lines. Dai et al., (2012) [25] have shown that in presence of CoCl2, PC-2 cells growth was stimulated during 72h. Then, a dose-dependent inhibition of growth was observed, with an increase of the cell death rate. In a general way, CoCl2 and DFO are known to inhibit cell proliferation [24]. However, their precise influence on cell cycle is variable. In presence of CoCl2, some studies report an arrest in the G1 phase [24,29], or in the G2 phase [30]. In the case of DFO, it is not clear if DFO blocks the cell cycle in G1, S, or G2 phase. Many studies report an arrest on G1 phase or in S phase, depending on dose and cell type [24,31-33]. A recent paper by Siriwardana et al., [34] could precisely differentiate a mid-G1 phase arrest and a S phase arrest. This result suggests that these two types of cell cycle blockage act more or less in presence of DFO, depending on cell line. In the other hand, some authors also noticed an arrest during the G2 phase [22,35]. Clearly, the effects of DFO and CoCl2 on cell cycle dynamics closely depend on the dose used, the time of exposure, and the cell line studied.
As a consequence, in order to use these molecules as HiF-1α inducers or anti-cancer agents on HeLa-Fucci cells, a preliminary study of their biological effects on this cell line is required. Notably, it is crucial to characterize their effect on the cell cycle, using the fluorescent properties of the Fucci cells. It would also bring additional knowledge on the biological response to these anti-cancer molecules. This work thus proposes, for the first time, to investigate the effects of iron-chelators DFO and CoCl2 on HeLa-Fucci cells proliferation dynamics. We constructed our study as follows. We first verified that a lack of oxygen generates fluorescence extinction, even in moderate hypoxia (3% O2). To evaluate the toxicity of DFO and CoCl2, we studied their influence on cell death and cell growth of HeLa-Fucci cells. This first step is necessary to rigorously interpret the fluorescent data. It also provides interesting comparative results of the cellular effects of the two molecules. Then, we studied their actions on the cell cycle dynamics of HeLa-Fucci cells. We show that this cell line exhibits an original response to iron-chelators DFO and CoCl2, quite different from observations obtained with other cell lines, which have mainly shown an arrest at the G1/S transition [22]. In our experimental conditions, DFO generates a G2 phase arrest of the cell cycle when its concentration passes over a threshold. CoCl2 acts on cell proliferation following a complex biphasic effect. Depending on dose and time of exposure, it promotes or inhibits the entry into the cycle. By using some known elements of the genetic characteristics of HeLa cells, we propose a molecular mechanism to explain our observations. It gives a hypothesis to test the action of DFO and CoCl2 on the MAPK pathway.
METHODS
Culture conditions
For the experiments in hypoxia we used a SANYO MCO-5M cell culture incubator which allows one to impose various conditions of oxygen pressure on the cells.
Cell death measurements
Fluorescent imaging
Cell cycle phases definition
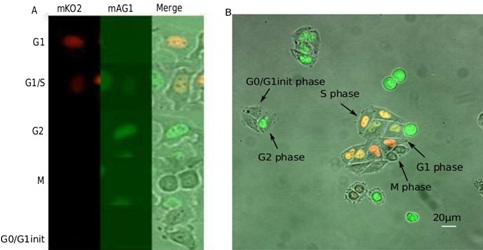
Figure 1: Fluorescent images of HeLa-Fucci cells.
B. Example of a microscopic field with Fucci-cells in different phases of the cycle.
Image processing and statistics
RESULTS
Fluorescence extinction of HeLa-Fucci cells in hypoxic conditions
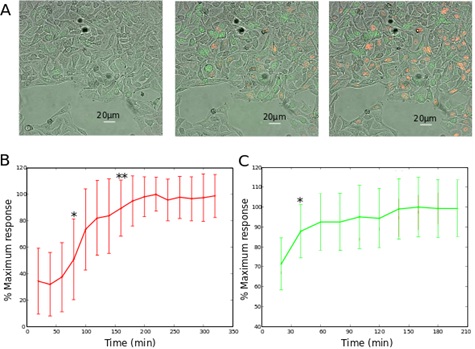
B. The red and C. the green fluorescence signals after reoxygenation are plotted as functions of time. The values are calculated by considering the average of the 10% most fluorescent pixels of each field, and normalized to the maximal value, as done by Kaida et al., [18]. The statistics are calculated using student’s test, with respect to the fluorescence measured 20min after reoxygenation.
Estimation of DFO and CoCl2 toxicity
DFO promotes cell death and inhibits cell growth
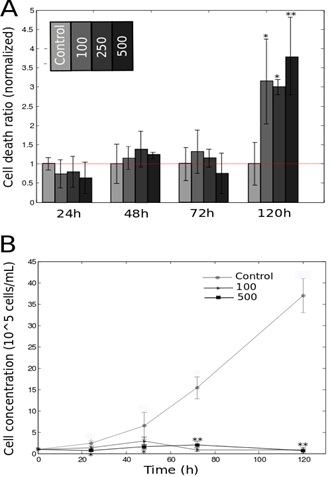
B. Growth profile of HeLa-Fucci cells treated with 100/500 μM of DFO. Statistics were calculated using Student’s test, with respect to the control group.
*P<0.05; **P<0.01
Dose and time dependency of CoCl2 effect on cell death and growth

Figure 4: Effect of CoCl2 on cell growth and mortality.
B. Growth profile of HeLa-Fucci cells treated with 100/200 μM CoCl2. Statistics were calculated using Student’s test, with respect to the control group.
*P<0.05; **P<0.01
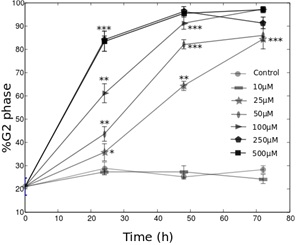
DFO promotes cell cycle arrest in G2 phase of HeLa-Fucci cells
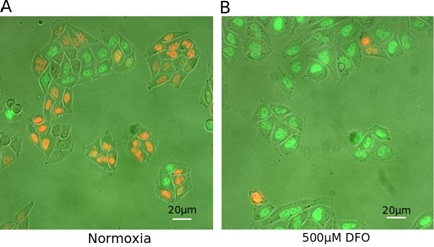
B. Representative field of cells on a cover glass cultured during 24h with 500 μM DFO.
CoCl2 has a biphasic effect on HeLa-Fucci cells proliferation dynamics

DISCUSSION
In this work, we tested for the first time, on HeLa-Fucci cells, the effects on cell death, cell growth and cell cycle of two widely used hypoxia-mimetic molecules (DFO and CoCl2). Our principal result concerns the characterization of the cell cycle dynamics using fluorescent microscopy. We found that CoCl2 has a biphasic effect on this cell line. It first promotes the progression into the G0/G1 phase, and inhibits it in a second time. DFO was found to induce cell cycle arrest in the G2 phase, following a switch-like behavior. When its concentration reaches a threshold (10 μM), more than 80% of the cells stop in this phase with a kinetics depending on DFO concentration. This observation leads to various types of conclusions. First, it provides interesting information about the use of hypoxia-mimetic agents on Fucci cells. We notably found that the effects of the molecules used are different from the known cellular response of hypoxia, which tends to promote cell cycle arrest in the G1 phase [9,37,38]. We note here that the use of HeLa-Fucci cells allowed us to distinguish the G0 from a G1init phase, which would not have been possible with other techniques such as flow cytometry. We could thus precisely quantify the effects of CoCl2 on the entry into the cycle. From our work, it appears that DFO and CoCl2 certainly have a large range of biological effects on HeLa-Fucci cells which hides the consequences of HiF-1α induction. This conclusion shows strong obstacles to the use of HeLa-Fucci cells to study the effect of hypoxia on the cell cycle. However, since we have shown that the fluorescence recovers after about 2-3 hours in normoxia, this cell line can be a good tool to study the influence of reoxygenation on the cell cycle dynamics. The tools we developed in this study could be used towards this interesting perspective.
Second, the cellular response to iron-depletion has been intensely studied over these last years [22]. In this framework, the results we obtained with the HeLa-Fucci cell line are surprising. Whereas these two molecules were often shown to promote cell cycle arrest in the G1 or S phases, they act differently in the HeLa-Fucci cell line. The biphasic effect of CoCl2 on cell growth was reported in the study by Dai et al., [25], but the authors did not explain this observation by precisely studying the cell cycle dynamics. As the Fucci cells allow us to follow the G0/G1 progression (non-colored to red cells), we could observe the biphasic effect of CoCl2 on the entry into the cycle. Moreover, the G2 phase arrest in presence of DFO was rarely observed [22]. How can we explain the particular features of the response of HeLa-Fucci to iron-chelators DFO and CoCl2? In their review, Yu et al., [22] note that one of the principal actor of the G1/S arrest in presence of these molecules is the p53 protein, which inhibits the cyclins D and E. Yet, HeLa cells are known to have low p53 activity [39-41]. This could explain the absence of a G1 phase arrest. This idea is confirmed by the fact that the cell lines exhibiting a G1 phase arrest in presence of DFO or CoCl2 seem to present a wild-type p53 activity: hMSC [24], UCC-2 [29], T-Lymphocytes [32]. Interestingly, the study by Brodie et al., [31] quantified the proliferation of two cell lines in presence of DFO. The SKN-SH cell line (neuroblastoma) is very sensitive to the G1 phase arrest. It has a non-mutated p53 activity, as suggested by the results of Kim et al., [42]. On the contrary, the T98G cell line (glioblastoma) is not sensitive to the G1 phase arrest, and it presents a low p53 activity [43]. The low p53 activity of HeLa cells is also coherent with the high resistance to apoptosis we observed in this study. If p53 cannot explain the cell response to DFO and CoCl2, which pathway could be involved?
The MAPK signaling cascade is strongly activated by iron-chelators [22]. More specifically, it was shown that DFO and CoCl2 activate this pathway [30,44-46]. Besides, it is functional in the HeLa cell line [47,48]. The enzymes of the MAPK family, notably p38, ERK and MEK have numerous effects on the cell cycle. First, they are known to inhibit the G2/M transition, and to promote the G2 phase arrest of the cell cycle [49]. Second, it was shown that they have an effect on the G0/G1 progression. On the one hand, ERK1/2 can inhibit the progression into the G0/G1 phase by promoting the synthesis of Mirk/Dyrk1B [50]. On the second hand, it was recently shown that in HeLa cells, ERK1/2 promotes proliferation by activating the progression into the G1 phase [51]. Thus, ERK can have two opposite effects on cell proliferation. It provides a promising candidate (or mechanism?) to explain the biphasic response to CoCl2 we observed with HeLa-Fucci cells. Interestingly, a biphasic effect related to MAPK activation by Cd and Hg was observed by Hao et al., [52]. As a consequence, our hypothesis that the response of HeLa-Fucci cells to CoCl2 treatment is due to the activation of the MAPK pathway may be relevant. Following this view, in presence of CoCl2, proteins activating cell proliferation are primarily synthesized. The work of Bai et al., [51] suggests that the p-c-fos protein could be involved in this step. Then, Mirk/Dyrk1B gene is expressed, and the progression into the G0/G1 phase is slowed down. As our experiments show that the biphasic time-response to CoCl2 is coupled to a biphasic dose-response, we can suggest that the differential activation of the Mirk and p-c-fos pathways could also depend on the concentration of the chemical. However, in this framework, it remains difficult to understand why DFO and CoCl2 have different actions on the cell cycle dynamics. It may depend on the type of enzymes activated by each of these agents. DFO would activate the MAPK-mediated G2 phase arrest and CoCl2 the biphasic action of MAPK on the G0/G1 progression. The complexity of the MAPK pathway and the huge number of its targets do not allow us to propose a more precise hypothesis. In all cases, the idea of a predominance of the MAPK pathway, because of the inactivity of p53, is an interesting hypothesis. It could be tested with molecular biology protocols. There would be many approaches to test. That is why we chose to limit our work to a first investigation at the cellular scale. For instance, it would be interesting to observe the effects of chemical inhibitions of the MAPK signaling cascade, as made in previous studies [49,51]. If our hypothesis is verified, HeLa-Fucci cells would be a good tool to precisely study the poorly known impact of iron-chelators agents on the MAPK pathway.
REFERENCES
- Sakaue-Sawano A, Kurokawa H, Morimura T, Hanyu A, Hama H, et al. (2008) Visualizing spatiotemporal dynamics of multicellular cell-cycle progression. Cell 132: 487-498.
- Sugiyama M, Sakaue-Sawano A, Iimura T, Fukami K, Kitaguchi T, et al. (2009) Illuminating cell-cycle progression in the developing zebrafish embryo. Proc Natl Acad Sci USA 106: 20812-20817.
- Zielke N, Korzelius J, van Straaten M, Bender K, Schuhknecht GF, et al. (2014) Fly-FUCCI: A versatile tool for studying cell proliferation in complex tissues. Cell Rep 7: 588-598.
- Harris AL (2002) Hypoxia--a key regulatory factor in tumour growth. Nat Rev Cancer 2: 38-47.
- Lesart AC, van der Sanden B, Hamard L, Estève F, Stéphanou A (2012) On the importance of the submicrovascular network in a computational model of tumour growth. Microvasc Res 84: 188-204.
- Hernandez-Luna MA, Rocha-Zavaleta L, Vega MI, Huerta-Yepez S (2013) Hypoxia inducible factor-1α induces chemoresistance phenotype in non-Hodgkin lymphoma cell line via up-regulation of Bcl-xL. Leuk Lymphoma 54: 1048-1055.
- Kunz M, Ibrahim SM (2003) Molecular responses to hypoxia in tumor cells. Mol Cancer 2: 23.
- Guo M, Song LP, Jiang Y, Liu W, Yu Y, et al. (2006) Hypoxia-mimetic agents desferrioxamine and cobalt chloride induce leukemic cell apoptosis through different hypoxia-inducible factor-1alpha independent mechanisms. Apoptosis 11: 67-77.
- Gardner LB, Li Q, Park MS, Flanagan WM, Semenza GL, et al. (2001) Hypoxia inhibits G1/S transition through regulation of p27 expression. J Biol Chem 276: 7919-7926.
- Gwak GY, Yoon JH, Kim KM, Lee HS, Chung JW, et al. (2005) Hypoxia stimulates proliferation of human hepatoma cells through the induction of hexokinase II expression. J Hepatol 42: 358-364.
- Michiels C, De Leener F, Arnould T, Dieu M, Remacle J (1994) Hypoxia stimulates human endothelial cells to release smooth muscle cell mitogens: role of prostaglandins and bFGF. Exp Cell Res 213: 43-54.
- Sahai A, Mei C, Pattison TA, Tannen RL (1997) Chronic hypoxia induces proliferation of cultured mesangial cells: role of calcium and protein kinase C. Am J Physiol 273: 954-960.
- Wohrley JD, Frid MG, Moiseeva EP, Orton EC, Belknap JK, et al. (1995) Hypoxia selectively induces proliferation in a specific subpopulation of smooth muscle cells in the bovine neonatal pulmonary arterial media. J Clin Invest 96: 273-281.
- Sermeus A, Michiels C (2011) Reciprocal influence of the p53 and the hypoxic pathways. Cell Death Dis 2: 164.
- Semenza GL (2007) Hypoxia-Inducible Factor 1 (HIF-1) pathway. Sci STKE 2007: cm8.
- Ke Q, Costa M (2006) Hypoxia-Inducible Factor-1 (HIF-1). Mol Pharmacol 70: 1469-1480.
- Zhong H, De Marzo AM, Laughner E, Lim M, Hilton DA, et al. (1999) Overexpression of hypoxia-inducible factor 1alpha in common human cancers and their metastases. Cancer Res 59: 5830-5835.
- Banks RE, Tirukonda P, Taylor C, Hornigold N, Astuti D, et al. (2006) Genetic and epigenetic analysis of Von Hippel-Lindau (VHL) gene alterations and relationship with clinical variables in sporadic renal cancer. Cancer Res 66: 2000-2011.
- Kaida A, Miura M (2012) Differential dependence on oxygen tension during the maturation process between monomeric Kusabira Orange 2 and monomeric Azami Green expressed in HeLa cells. Biochem Biophys Res Commun 421: 855-859.
- Kaida A, Miura M (2012) Visualizing the effect of hypoxia on fluorescence kinetics in living HeLa cells using the Fluorescent ubiquitination-based cell cycle indicator (Fucci). Exp Cell Res 318: 288-297.
- Potuckova E, Jansova H, Machacek M, Vavrova A, Haskova P, et al. (2014) Quantitative analysis of the anti-proliferative activity of combinations of selected iron-chelating agents and clinically used anti-neoplastic drugs. PLoS One 9: 88754.
- Yu Y, Kovacevic Z, Richardson DR (2007) Tuning cell cycle regulation with an iron key. Cell Cycle 6: 1982-1994.
- Xiao H, Gu Z, Wang G, Zhao T (2013) The possible mechanisms underlying the impairment of HIF-1α pathway signaling in hyperglycemia and the beneficial effects of certain therapies. Int J Med Sci 10: 1412-1421.
- Zeng HL, Zhong Q, Qin YL, Bu QQ, Han XA, et al. (2011) Hypoxia-mimetic agents inhibit proliferation and alter the morphology of human umbilical cord-derived mesenchymal stem cells. BMC Cell Biol 12: 32.
- Dai ZJ, Gao J, Ma XB, Yan K, Liu XX, et al. (2012) Up-regulation of hypoxia inducible factor-1α by cobalt chloride correlates with proliferation and apoptosis in PC-2 cells. J Exp Clin Cancer Res 31: 28.
- Lee JH, Choi SH, Baek MW, Kim MH, Kim HJ, et al. (2013) CoCl2 induces apoptosis through the mitochondria- and death receptor-mediated pathway in the mouse embryonic stem cells. Mol Cell Biochem 379: 133-140.
- Ardyanto TD, Osaki M, Tokuyasu N, Nagahama Y, Ito H (2006) CoCl2-induced HIF-1alpha expression correlates with proliferation and apoptosis in MKN-1 cells: a possible role for the PI3K/Akt pathway. Int J Oncol 29: 549-555.
- Piret JP, Mottet D, Raes M, Michiels C (2002) CoCl2, a chemical inducer of hypoxia-inducible factor-1, and hypoxia reduce apoptotic cell death in hepatoma cell line HepG2. Ann N Y Acad Sci 973: 443-447.
- Bae S, Jeong HJ, Cha HJ, Kim K, Choi YM, et al. (2012) The hypoxia-mimetic agent cobalt chloride induces cell cycle arrest and alters gene expression in U266 multiple myeloma cells. Int J Mol Med 30: 1180-1186.
- Triantafyllou A, Liakos P, Tsakalof A, Georgatsou E, Simos G, et al. (2006) Cobalt induces Hypoxia-Inducible Factor-1alpha (HIF-1alpha) in HeLa cells by an iron-independent, but ROS-, PI-3K- and MAPK-dependent mechanism. Free Radic Res 40: 847-856.
- Brodie C, Siriwardana G, Lucas J, Schleicher R, Terada N, et al. (1993) Neuroblastoma sensitivity to growth inhibition by deferrioxamine: evidence for a block in G1 phase of the cell cycle. Cancer Res 53: 3968-3975.
- Lucas JJ, Szepesi A, Domenico J, Takase K, Tordai A, et al. (1995) Effects of iron-depletion on cell cycle progression in normal human T lymphocytes: selective inhibition of the appearance of the cyclin A-associated component of the p33cdk2 kinase. Blood 86: 2268-2280.
- Metzendorf C, Lind MI (2010) The role of iron in the proliferation of Drosophila l(2) mbn cells. Biochem Biophys Res Commun 400: 442-446.
- Siriwardana G, Seligman PA (2013) Two cell cycle blocks caused by iron chelation of neuroblastoma cells: separating cell cycle events associated with each block. Physiol Rep 1: 00176.
- Renton FJ, Jeitner TM (1996) Cell cycle-dependent inhibition of the proliferation of human neural tumor cell lines by iron chelators. Biochem Pharmacol 51: 1553-1561.
- Nagano T, Hashimoto T, Nakashima A, Hisanaga S, Kikkawa U, et al. (2013) Cyclin I is involved in the regulation of cell cycle progression. Cell Cycle 12: 2617-2624.
- Box AH, Demetrick DJ (2004) Cell cycle kinase inhibitor expression and hypoxia-induced cell cycle arrest in human cancer cell lines. Carcinogenesis 25: 2325-2335.
- Goda N, Dozier SJ, Johnson RS (2003) HIF-1 in cell cycle regulation, apoptosis, and tumor progression. Antioxid Redox Signal 5: 467-473.
- Koivusalo R, Krausz E, Helenius H, Hietanen S (2005) Chemotherapy compounds in cervical cancer cells primed by reconstitution of p53 function after short interfering RNA-mediated degradation of human papillomavirus 18 E6 mRNA: opposite effect of siRNA in combination with different drugs. Mol Pharmacol 68: 372-382.
- May E, Jenkins JR, May P (1991) Endogenous HeLa p53 proteins are easily detected in HeLa cells transfected with mouse deletion mutant p53 gene. Oncogene 6: 1363-1365.
- Minagawa Y, Kigawa J, Itamochi H, Kanamori Y, Shimada M, et al. (1999) Cisplatin-resistant HeLa cells are resistant to apoptosis via p53-dependent and -independent pathways. Jpn J Cancer Res 90: 1373-1379.
- Kim SS, Chae HS, Bach JH, Lee MW, Kim KY, et al. (2002) P53 mediates ceramide-induced apoptosis in SKN-SH cells. Oncogene 21: 2020-2028.
- Park CM, Park MJ, Kwak HJ, Moon SI, Yoo DH, et al. (2006) Induction of p53-mediated apoptosis and recovery of chemosensitivity through p53 transduction in human glioblastoma cells by cisplatin. Int J Oncol 28: 119-125.
- Gaitanaki C, Kalpachidou T, Aggeli IK, Papazafiri P, Beis I (2007) CoCl2 induces protective events via the p38-MAPK signalling pathway and ANP in the perfused amphibian heart. J Exp Biol 210: 2267-2277.
- Lee SK, Jang HJ, Lee HJ, Lee J, Jeon BH, et al. (2006) p38 and ERK MAP kinase mediates iron chelator-induced apoptosis and -suppressed differentiation of immortalized and malignant human oral keratinocytes. Life Sci 79: 1419-1427.
- Markel TA, Crisostomo PR, Wang M, Herring CM, Lahm T, et al. (2007) Iron chelation acutely stimulates fetal human intestinal cell production of IL-6 and VEGF while decreasing HGF: the roles of p38, ERK, and JNK MAPK signaling. Am J Physiol Gastrointest Liver Physiol 292: 958-963.
- An WW, Gong XF, Wang MW, Tashiro S, Onodera S, et al. (2004) Norcantharidin induces apoptosis in HeLa cells through caspase, MAPK, and mitochondrial pathways. Acta Pharmacol Sin 25: 1502-1508.
- Zhong W, Zhu H, Sheng F, Tian Y, Zhou J, et al. (2014) Activation of the mapk11/12/13/14 (p38 mapk) pathway regulates the transcription of autophagy genes in response to oxidative stress induced by a novel copper complex in HeLa cells. Autophagy 10:1285-1300.
- Astuti P, Pike T, Widberg C, Payne E, Harding A, et al. (2009) MAPK pathway activation delays G2/M progression by destabilizing Cdc25B. J Biol Chem 284: 33781-33788.
- Gao J, Zhao Y, Lv Y, Chen Y, Wei B, et al. (2013) Mirk/Dyrk1B mediates G0/G1 to S phase cell cycle progression and cell survival involving MAPK/ERK signaling in human cancer cells. Cancer Cell Int 13: 2.
- Bai L, Mao R, Wang J, Ding L, Jiang S, et al. (2015) ERK1/2 promoted proliferation and inhibited apoptosis of human cervical cancer cells and regulated the expression of c-Fos and c-Jun proteins. Med Oncol 32: 57.
- Hao C, Hao W, Wei X, Xing L, Jiang J, et al. (2009) The role of MAPK in the biphasic dose-response phenomenon induced by cadmium and mercury in HEK293 cells. Toxicol in vitro 23: 660-666.
Citation: Bedessem B, Marie-Paule M, Hamel M, Giroud F, Stéphanou A (2015) Effects of the Hypoxia-Mimetic Agents DFO and CoCl2 on HeLa-Fucci Cells. J Cell Biol Cell Metab 2: 004.
Copyright: © 2015 Baptiste Bedessem, et al. This is an open-access article distributed under the terms of the Creative Commons Attribution License, which permits unrestricted use, distribution, and reproduction in any medium, provided the original author and source are credited.