Advances in Industrial Biotechnology Category: Biotechnology Type: Research Article

Enzymatic Hydrolysis of Various Pretreated Dried Distillers’ Grains with Solubles

Emily L Baldwin1, Bishnu Karki2*, Loren Iten3 and William R Gibbons1
1 Department of biology and microbiology, South Dakota State University, Brookings, United states
2 Department of biology and microbiology, 1224 Medary Avenue # 228, P.O. Box 2104A, South Dakota State University, Brookings, SD, 57007, United states
3 United states department of agriculture, Agricultural Research Service, National Center for Agricultural Utilization Research, Peoria, United states

*Corresponding Author(s):
Bishnu Karki
Department Of Biology And Microbiology, 1224 Medary Avenue # 228, P.O. Box 2104A, South Dakota State University, Brookings, SD, 57007, United States
Tel:+1 6056954744,
Email:bishnu.karki@sdstate.edu

Received Date: Aug 16, 2018
Accepted Date: Aug 31, 2018
Published Date: Sep 14, 2018

Abstract

Dried Distillers’ Grains with Solubles (DDGS) is a popular animal feed that is mainly fed to ruminant livestock (i.e., cattle). However, because of its high fiber content, DDGS is limited in monogastric livestock (i.e., swine and poultry) and aquaculture diets. This causes low inclusion rates and reduced economic value of DDGS for these species. But there is possibility of breaking down the fibers using commercial enzymes. But the high cost associated with the use of commercial enzymes is a challenge with the industrial application of enzymes in feed application. Pretreatment (physical, chemical, and/or biological) of high fiber containing feedstocks and/or lignocellulosic feedstocks prior to enzymatic saccharification can improve the overall fiber digestibility. Therefore, ranges of commercial enzymes were tested in this study. It was found the commercial enzyme that performed well at low enzyme dosages was Viscozyme L. The effectiveness of the Viscozyme L was significantly high (~280% increase in sugar recovery as compared to the untreated DDGS) when supplemented with the dilute acid pretreated DDGS as compared to the untreated DDGS.


Keywords

Dried Distillers, Enzymatic Hydrolysis

INTRODUCTION

Dried Distillers’ Grains with Solubles (DDGS) is the major byproduct of corn-based ethanol industry. In 2016, 25.4 million metric tons of DDGS were produced from ethanol plants [1]. DDGS is sold as animal feed, mainly to ruminant livestock (i.e., cattle). Ruminants are able to metabolize the fiber, which can serve as a good source of energy when properly formulated in the animals’ diet [2]. However, because of the high fiber content, DDGS is limited in monogastric livestock (i.e., swine and poultry) and aquaculture diets. The low inclusion rate of DDGS in these diets lower the economic value of DDGS for these species [2]. The problem associated with the high fiber content of the DDGS can be overcome either by solubilizing the carbohydrates with commercial enzymes and/or pretreating the DDGS with physical and chemical processes prior to enzyme treatments.

The environmentally-friendly process of using commercial enzymes to solubilize fibers can achieve high sugar yields in lignocellulose biomass (lignin, hemicellulose, and cellulose). However, enzymes cost is of a significant barrier in producing an economical product [3]. One way to overcome the high cost of enzymes is by lowering the enzyme loading rates or dosages. Additionally, application of pretreatment techniques prior to enzymatic saccharification can enhance the digestibility of the lignocellulosic fibers. Pretreatments should ideally use minimal amounts of energy and chemicals to limit the cost of the pretreatment process [4]. Mechanical process reduces the particle size and crystallinity by chipping, grinding, and milling to increase the surface area and reduce the degree of polymerization [5]. Milling alters the ultrastructure of lignocellulose and degree of crystallinity, causing cellulose to be more readily accessed and hydrolyzed by cellulase [6]. Liquid Hot Water (LHW) pretreatment is where the lignocellulosic biomass is saturated in water before it is heat treated under pressure to ensure the water stays in the liquid state and dissolves the hemicellulose fraction of the biomass into soluble oligosaccharides. Dilute acid pretreatment is where lignocellulose biomass is saturated with 0.2-2.5% w/w of acid and heat treated [7,8]. This process removes the hemicellulose and thus enhances the cellulose digestibility by providing the greater enzyme accessibility [9-12]. Dilute alkali pretreatment can be performed using low alkali concentration (i.e., 0.5-4%) and high temperatures [13,14]. This pretreatment will disrupt the lignin and xylan cross-linking ester bonds, increasing the porosity of the lignocellulose biomass [15]. This results in enriched fractions of cellulose and hemicellulose [16].

In this study, we analyzed the saccharification yields of the monosaccharides from pretreated DDGS using various commercial enzyme preparations and dosages. The goal was to screen various commercial enzymes at different dosages on pretreated and untreated DDGS to identify the best enzyme and lowest dosage needed to achieve the high amounts of monosaccharides from DDGS. Therefore, preliminary experiments were conducted to test the different commercial enzymes at various dosages on untreated DDGS. Once the enzyme and dosage were established, DDGS was pretreated by various physical and chemical treatments prior to enzyme saccharification.

MATERIAL AND METHODS

Enzymes

The enzymes, CTec2 and Htec2 (cellulase, enzyme blends; Novozymes), Ronozyme VP (multienzyme complex, carbohydrase; DSM), Superzyme L (multienzyme complex, carbohydrase; Canadian Biosystems Inc.) and Viscozyme L (hemicellulase, arabinase, cellulase, β-glucanase, xylanase; Novozymes) were used for enzymatic saccharification of DDGS. The enzymes were loaded based on mg protein/dry gram of biomass basis. Therefore, total protein content in the enzymes (mg protein/ml or mg protein/g for Ronozyme VP) were determined using the BCA protein assay (Pierce BCA Protein Assay Kit, cat# 23225; Thermo Fisher Scientific). The protein content of the enzymes as determined for CTec2, Ronozyme VP, Superzyme L, and Viscozyme L respectively, were 290 ± 3.2 (mg/ml), 7.2 ± 0.08 (mg/g), 80.12 ± 1.11 (mg/ml), and 130 ± 2.97 (mg/ml). Enzyme HTec2 was supplemented with CTec2 at the ratio of 9:1 for CTec2:HTec2 (recommended dosage by Novozymes).

Enzymatic saccharification of untreated DDGS

Enzymatic hydrolysis was performed in a 250 ml Erlenmeyer flask (100 ml working volume, pH 4.8) using DDGS at 10% Solid Loading Rate (SLR) on dry basis (DM). To prevent from the possible contamination during saccharification period, each flask was supplemented with 500 µl of 500 ppm BioTrol. Enzymes were added individually at dosage of 2, 4 and 6 mg protein/dry gram of DDGS. The enzymes were added to the slurries and put into a shaker incubator set at 50°C (enzyme optimal temperature) and 200 rpm. Samples (5 ml) were taken after 4 and 24 hours of saccharification and immediately stored in freezer until processed for the sugar analysis using HPLC. Details of the sample processing are listed in a later section.

Pretreatments

DDGS samples were sent to the USDA laboratory at Peoria (IL) for conducting pretreatments prior to enzymatic saccharification. Hot water cook, dilute acid, and alkali pretreatments (1 and 4% ammonium hydroxide) were conducted using a stainless steel steam jacketed reactor tube in 8-10 l batch-wise increments on homogenized, 15% w/w (DM) slurries at 160°C for 20 min. For the dilute acid pretreatment, 0.5% w/w sulfuric acid was used while for the alkali pretreatment, 30% ammonium hydroxide was used at the concentration of 1 and 4% (w/w) basis. Similarly, Kady mill pretreatment was carried out using a 12 L jacketed vessel and 4” diameter homogenizing head (Model # OOPS-10). The mill was operated at 8000 rpm at 160ºC and 70 psi pressure. The mill was operated at two different conditions, 1) 8000 rpm at 100°C, and atmospheric pressure and it was called “Kady mill”; 2) DDGS slurry was homogenized at 160°C and 70 psi pressure, which was called “treated Kady mill”. After pretreatments, slurries were frozen and stored until use.

Enzymatic saccharification of the pretreated DDGS

Enzymatic saccharification of pretreated DDGS samples were conducted according to the method as described in the section above. Based on the preliminary results as obtained on the untreated DDGS samples, only Ronozyme VP and Viscozyme L were chosen for the further study. To optimize the enzyme dosage for each pretreatment, Ronozyme VP and Viscozyme L were added at the 5 different levels of enzyme dosages (0, 0.125, 0.25, 0.5, 0.75, and 1 mg protein/dry gram of pretreated samples). Samples were drawn at 0, 4, and 24 hours of saccharification to determine the sugar yields.

Sugar analysis

An HPLC was used to measure the sugars released from the enzymes. The samples were boiled for 15 minutes to inactivate the enzyme. Samples were then centrifuged at 4,000 rpm for 10 minutes before the supernatant was poured into new centrifuge tubes and frozen overnight. The supernatant was thawed to be re-centrifuged again at 4,000 rpm for 10 minutes to remove any precipitants. Then the supernatant was poured into a 2 ml microcentrifuge tube and allowed to freeze overnight. The final supernatant was thawed before it was filter through a 0.2 μm filter and into a HPLC vial and frozen until analysis. A high performance liquid chromatography system (Agilent Technologies, Santa Clara, CA, USA) equipped with refractive index detector (Model G1362A) was used to measure the sugars. The sugars were eluted using a 50 Mm sulfuric acid (de-ionized water) as a mobile phase at a flow rate of 0.6 ml/min and a column temperature of 65°C using an Aminex HPX-87H (300 x 7.8 mm) organic acid column (Bio-Rad Laboratories, Hercules, CA). The sugars quantified included glucose, cellobiose, galactose, xylose, mannose, and arabinose.

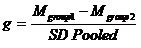
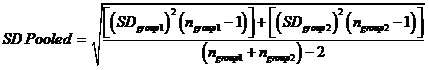
Statistical analysis

The enzyme saccharification of untreated and pretreated trials was completed in triplicates. Statistical significance and effect size evaluation were used to provide complementary information of practical significance. Using practical significance aids in the evaluation of whether the results will be applicable in industrial settings. The significance test indicates the likelihood that the observed effect is due to chance, while the effect size indicates the magnitude of the observed effects between variables [17]. Effect size value was determined using Hedges’ g, rather than Cohen’s d, which eliminates bias by putting weight on the pooled standard deviation based on its small sample size (n = 3) [18]. Hedges, however, still uses Cohen effect sizes classification which are: small (0.2), medium (0.5), and large (≥0.8) units of differing standard deviations between group means [19]. The equation to find Hedges’ g is as follows; M = Mean, SD = Standard Deviation, and n = Sample size:


Significant difference was found in the sugars by one-way Analysis of Variance (ANOVA) by using a R statistical power analysis program and package ‘agricolae’ [20,21]. Tukey’s Honestly Significant Difference (HSD) was used for post hoc tests of significant difference between means [22].

RESULTS

Preliminary screening of commercial enzymes on untreated DDGS

During the primary trials, four commercial enzymes were screened (Figure 1). These trials were meant to select the enzyme that performed the best at low enzyme loading. The total sugars represent all the sugars quantified: glucose, cellobiose, galactose, xylose, mannose, and arabinose. Ronozyme VP did the best out of all the enzymes across all enzyme dosages and time. The next enzyme that performed well was Superzyme L and Viscozyme L. Superzyme L at 4 hours had an effect size value of g equal to 2.10 when comparing 2 and 6 mg/g dosage. So Superzyme L had a high practical significance at 6 mg/g but was not effective with a lower enzyme dosage. Viscozyme L at 4 hours had an effect size value of g equal to 0.71 when comparing 2 and 6 mg/g dosage. So Viscozyme L had a medium practical significance at 2 mg/g, so having a low enzyme dosage was effective. Superzyme L and Viscozyme L at 4 hours were compared at 2 mg/g dosage and had an effect size value of g equal to 0.84. Viscozyme L had high practical significance versus Superzyme L at a lower dosage. Next, Viscozyme L at 2 mg/g dosage r was compared between 4 hours and 24 hours with 8.65 ± 0.36 mg/ml and 10.29 ± 0.18 mg/ml, respectively. The carbohydrate concentration increased only by ~ 1.64 mg/ml when enzymatic hydrolysis was conducted for additional 20 hours.
 
Figure 1: Enzymatic saccharification of untreated DDGS using different enzymes at three different enzyme dosages.
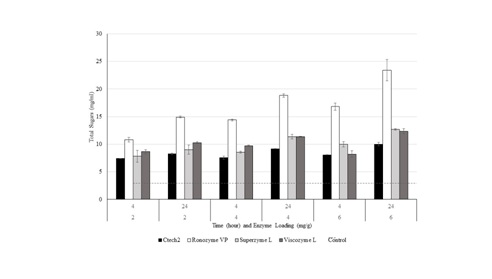
The control represents the DDGS without enzymes. Each data point represents the average of three replications and the error bars represent the standard deviation.
 

Enzymatic saccharification of pretreated DDGS

Total sugars data of pretreated DDGS showed no significant change between 4 hours and 24 hours. So, when sugars of pretreated DDGS are discussed, it is represented by hour 4. The total sugars concentration of enzyme treated DDGS were higher than pretreated samples without enzymes at all levels of enzyme dosages (Table 1). But the pretreatment that performed the best was 0.5% sulfuric acid, followed by liquid hot water, treated Kady mill, Kady mill, 4% ammonium hydroxide, and 1% ammonium hydroxide (Table 1). The two alkali pretreatments did not perform well, especially when comparing with 0.5% sulfuric acid without enzymes. The total sugars yields of sulfuric acid pretreated without the enzyme additions were similar with that of alkali pretreatments at high enzyme dosages (0.75 and 1 mg/g).
 

1Enzyme dosages for different pretreated DDGS sample

Glucose (mg/ml)

Total Sugars (mg/ml)

Kady Mill

0

1.87 ± 0.16nop

7.60 ± 3.04lm

0.125

6.88 ± 0.06hijk

19.27 ± 3.81cdefgh

0.25

11.93 ± 0.85cdef

22.88 ± 2.45cdef

0.5

12.11 ± 1.87cdef

18.58 ± 1.03defghi

0.75

12.05 ± 0.42cdef

18.54 ± 2.78defghi

1

13.39 ± 1.2bcd

17.08 ± 0.56efghij

Treated Kady Mill

0

1.32 ± 0.9p

9.38 ± 2.45klm

0.125

6.48 ± 0.54ijkl

15.93 ± 1.21ghijk

0.25

8.55 ± 0.29fghi

17.84 ± 0.06defghij

0.5

12.25 ± 0.78cdef

23.55 ± 1.39cdef

0.75

13.64 ± 0.49bcde

24.32 ± 0.84bcde

1

14.2 ± 0.18bc

23.58 ± 1.26bcdef

0.5% Sulfuric Acid

0

4.58 ± 0.17jklmno

15.28 ± 2.37ghijk

0.125

13.08 ± 0.56bcde

35.42 ± 1.31a

0.25

12.59 ± 0.41defg

38.52 ± 4.18a

0.5

12.38 ± 0.38cdef

31.4 ± 1.13ab

0.75

12.04 ± 0.61cdef

25.77 ± 1.39bc

1

17.4 ± 1.12a

33.22 ± 3.32a

Liquid Hot Water

0

1.31 ± 0.19p

11.78 ± 0.64jklm

0.125

9.18 ± 2.0fghi

24.57 ± 4.03bcd

0.25

6.63 ± 0.82hijkl

18.73 ± 2.49defgh

0.5

7.67 ± 0.26ghij

16.82 ± 3.55defghi

0.75

9.86 ± 0.04efgh

19.1 ± 1.25cdefgh

1

15.88 ± 1.09ab

22.38 ± 3.34cdefg

4% Ammonium Hydroxide

0

2.42 ± 0.12mnop

5.63 ± 0.51m

0.125

3.69 ± 0.22klmnop

7.76 ± 0.92lm

0.25

5.33 ± 0.77jklmn

10.7 ± 1.28jklm

0.5

5.65 ± 0.04jklm

7.34 ± 1.1lm

0.75

10.26 ± 0.22defg

16.61 ± 0.81fghij

1

11.24 ± 0.93cdef

16.15 ± 0.1fghij

1% Ammonium Hydroxide

0

1.58 ± 0.06op

5.32 ± 0.05m

0.125

2.69 ± 0.14mnop

6.97 ± 0.17m

0.25

3.49 ± 0.14lmnop

9.37 ± 0.26klm

0.5

5.46 ± 0.42jklmn

11.59 ± 2.72ijklm

0.75

10.26 ± 0.61defg

16.2 ± 1.11fghij

1

9.17 ± 0.75fghi

14 ± 2.04hijkl

 
Table 1: Carbohydrate concentrations (mg/ml) of pretreated DDGS with Viscozyme L at 4 hours of saccharification.
1Enzyme dosages: mg protein/dry gram of DDGS.

As seen in table 1, all the Viscozyme L dosages of 0.5% sulfuric acid total sugars were significantly different from the other pretreatments, but not between the different dosages. To determine the best dosage, glucose was compared from all pretreated DDGS. 0.5% sulfuric acid at 1 mg/g of Viscozyme L was significantly higher than all the other pretreatments.

DISCUSSION

This study was conducted in two different series, where firstly commercial enzymes were tested on untreated DDGS to select the enzyme that performed well at low dosages. Then the DDGS was treated by various physical and/or chemical pretreatments and tested with the best selected enzyme from primary experiments on untreated DDGS. The low enzyme dosages were used (less than 2 mg/dry gram of DDGS). Lower enzyme dosages on pretreated DDGS were tested versus the untreated DDGS because the pretreatment would have liberated more sugars, resulting in less enzymes to be used.

Ronozyme VP performed the best out of all the enzymes tested. However, this enzyme is very low in protein content and is a powder feed enzyme that is meant to go on solid-state materials and not submerged-state materials. This was most prevalently seen as the powder had hydrophobic qualities, causing difficulties of completely dissolving the enzyme and evenly distributing it throughout the entire media. And since this was also a multienzyme complex, another enzyme was selected to be tested on the pretreated DDGS. Superzyme L and Viscozyme L were the next candidates and it was determined that Superzyme L did well at high dosages while Viscozyme L did well at low dosages. Viscozyme L also has known lignocellulose enzymes versus Superzyme L, which is a multienzyme complex.

Viscozyme L was continued on the pretreated DDGS with lower dosages. Overall, 0.5% sulfuric acid at 1 mg/g of Viscozyme L was the most effective when total sugars and glucose was taken into consideration. 0.5% sulfuric acid with Viscozyme L at 1 mg/g resulted in the total sugar yields of 33.22 ± 3.32 mg/ml while untreated DDGS at 2 mg/g produced 8.65 ± 0.36 mg/ml total sugars. This is a ~280% increase with a lower enzyme dosage. The pretreatment that did not have significant impact on total sugar yields was the dilute alkali pretreatment. One of the reason for this is monosaccharides, like galactose, mannose, and glucose, are rapidly destroyed by the hot aqueous alkaline solution used with dilute alkali pretreatment [23]. This was also reflected by the low amount of glucose on both the dilute alkali pretreated DDGS.

CONCLUSION

Overall, pretreatment followed by enzyme saccharification improved the carbohydrate yields of DDGS. Viscozyme L was determined to perform well at low enzyme dosages on untreated DDGS. Pretreated DDGS of 0.5% sulfuric acid with 1 mg/g of Viscozyme L resulted in the greatest improvement with an increase of ~280% of total sugars versus untreated DDGS at 2 mg/g.

ACKNOWLEDGMENT

Funding support was provided by the South Dakota Agricultural Experiment Station under grant SD00H616.

REFERENCES

  1. Renewable Fuels Association (2017) Building Partnerships| Growing Markets: 2017 Ethanol Industry Outlook. Renewable Fuels Association, Washington, DC, USA.
  2. US Grains Council (2012) A guide to distiller's dried grains with solubles (DDGS). US Grains Council, Washington, USA.
  3. Fang X, Yano S, Inoue H, Sawayama S (2009) Strain improvement of Acremonium cellulolyticus for cellulase production by mutation. J Biosci Bioeng 107: 256-261.
  4. Mosier N, Wyman C, Dale B, Elander R, Lee YY, et al. (2005) Features of promising technologies for pretreatment of lignocellulosic biomass. Bioresour Technol 96: 673-686.
  5. Tassinari T, Macy C, Spano L, Ryu DD (1980) Energy requirements and process design considerations in compression?milling pretreatment of cellulosic wastes for enzymatic hydrolysis. Biotechnology and Bioengineering 22: 1689-1705.
  6. Mais U, Esteghlalian AR, Saddler JN, Mansfield SD (2002) Enhancing Enhancing the enzymatic hydrolysis of cellulosic materials using simultaneous ball milling. Appl Biochem Biotechnol 98: 815-832.
  7. Sarkar N, Ghosh SK, Bannerjee S, Aikat K (2012) Bioethanol Bioethanol production from agricultural wastes: An overview. Renewable Energy 37: 19-27.
  8. Cardona C, Quintero J, Paz I (2010) Production of bioethanol from sugarcane bagasse: Status and perspectives. Bioresource Technology 101: 4754-4766.
  9. Brownell HH, Saddler JN (1984) Steam-explosion pretreatment for enzymatic hydrolysis. Biotechnol Bioeng Symp 14.
  10. Converse AO, Grethlein HE (1985) Process for hydrolysis of biomass. US4556430A, Dartmouth College, USA.
  11. Grous WR, Converse AO, Grethlein HE (1986) Effect of steam explosion pretreatment on pore size and enzymatic hydrolysis of poplar. Enzyme and Microbial Technology 8: 274-280.
  12. Knappert D, Grethlein H, Converse A (1981) Partial Partial acid hydrolysis of poplar wood as a pretreatment for enzymatic hydrolysis. Biotechnol Bioeng Symp 11.
  13. Cheng KK, Zhang JA, Ping WX, Ge JP, Zhou YJ, et al. (2008) Sugarcane Sugarcane bagasse mild alkaline/oxidative pretreatment for ethanol production by alkaline recycle process. Appl Biochem Biotechnol 151: 43-50.
  14. Mirahmadi K, Kabir MM, Jeihanipour A, Karimi K, Taherzadeh M (2010) Alkaline pretreatment of spruce and birch to improve bioethanol and biogas production. BioResources 5.
  15. Tarkow H, Feist WC (1969) A mechanism for improving the digestibility of lignocellulosic materials with dilute alkali and liquid ammonia. Advances in Chemistry 95: 197-218.
  16. Sun Y, Cheng J (2002) Hydrolysis of lignocellulosic materials for ethanol production: a review. Bioresour Technol 83: 1-11.
  17. Maher JM, Markey JC, Ebert-May D (2013) The other half of the story: effect size analysis in quantitative research. CBE Life Sci Educ 12: 345-351.
  18. Hedges LV (1981) Distribution theory for Glass's estimator of effect size and related estimators. Journal of Educational and Behavioral Statistics 6: 107-128.
  19. Cohen J (1969) Statistical power analysis for the behavioral sciences (2ndedn). Lawrence Erlbaum Associates, Inc., New York, USA.
  20. R Core Team (2011) R: A language and environment for statistical computing. Global Biodiversity Information Facility, Vienna, Austria.
  21. Felipe M (2013) Agricolae: statistical procedures for agricultural research. R package version 1:1-4.
  22. Freund R, Mohr DL, Wilson W (2010) Statistical Methods (3rdedn). Elsevier Publishing company, New York, USA.
  23. Kaye GI, Weber PB, Wetzel WM (2004) The alkaline hydrolysis process. ALN Magazine, USA.


Citation: Baldwin EL, Karki B, Iten L, Gibbons WR (2018) Enzymatic Hydrolysis of Various Pretreated Dried Distillers’ Grains with Solubles. Adv Ind Biotechnol 1: 004.  

Copyright: © 2018  Emily L Baldwin, et al. This is an open-access article distributed under the terms of the Creative Commons Attribution License, which permits unrestricted use, distribution, and reproduction in any medium, provided the original author and source are credited.


Herald Scholarly Open Access is a leading, internationally publishing house in the fields of Sciences. Our mission is to provide an access to knowledge globally.


© 2024, Copyrights Herald Scholarly Open Access. All Rights Reserved!