Evaluation and Selection of Improved Food Barley (Hordeum Vulgare L.) Varieties in the Highland Areas of Western Guji, Southern Oromia
*Corresponding Author(s):
Natol BakalaOromia Agricultural Research Institute, Bako Agricultural Research Center, Ethiopia
Email:natymartyko@gmail.com
Abstract
The field experiment was conducted on six improved food barley varieties and one local check at Bule hora woreda, western Guji during 2017, 2018 and 2019 main cropping season. The main objective of the study was to identify, select and recommend well adaptable and high yielding variety for western Guji. The seed were sown in Randomized Complete Block Design (RCBD) with three replications in the net plot size of 1.2mx2.5m. Number of effective tillers per plant (ETP), Number of Spikelet Per Panicle (SPP), Plant Height (PH), Panicle Length (PNL), Number of Grain Per Spike (GPS), Days to 50% Heading (DH), Days to 50% Maturity (DM, Thousand Seed Weight (TSW) and Grain Yield (GY) were collected as Agronomic traits. Combined analysis of variance detected significant difference among main effect of variety, year and location for most of agronomic traits considered. The interaction effect of variety by year imposed significant effect on all traits except for PNH, PH and PNH, DM and SPP, respectively. Likewise, variety by year by location had significant influence on all agronomic traits excluding PH. Among evaluated varieties; Guta (4.68 tone/ha) and Dinsho (4.51 tone//ha) had significantly higher mean value of grain yield over the rest and followed by Biftu (4.17 tone/ha). Therefore, the superior variety was suggested for further demonstration and popularization in western Guji southern Oromia and areas with similar agro-ecology.
Keywords
Barely; Evaluation; Highland; Selection; Variety
Introduction
Barley (Hordium vulgare L.) is recognized as one of the world’s most ancient food crop, which is believed to have first domesticated about 10,000 years ago from its wild relatives in the Fertile Crescent of the Near East and Center of diversity in Ethiopia [1]. In Ethiopia, Barley is the fifth important cereal crop after Tef, Maize, Sorghum and Wheat in both total area coverage and annual production [2]. It is cultivated at altitudes ranging from 1500 to 3500 above sea level and predominantly grown at elevation ranging from 2000 to 300 m.a.s.l. [3]. Being the most dependable and desirable crop for the resource poor highland farmers [4], in some regions it is cultivated in two district seasons: belg which relies on the short rainfall period from March to April and Meher which relies on the long rainfall period from June to September [5].
Barley area coverage, production, and productivity were estimated to be 959,273.40 ha, 2,024,921.70 tones, and 2.11 tones/ha, respectively, at the national level [6]. The absence of improved varieties, insect pest, disease, poor soil fertility, soil acidity, and weed competition are the most important biotic and abiotic factors that reduce barley productivity [5,7]. Gradual increases in these production constraints are thought to be important in the study areas' declining barley productivity. One alternative intervention strategy for increasing crop productivity is to evaluate different food barley varieties for significant yield increment. Therefore, the main objective of the study was to evaluate the performance of improved food barley varieties and to recommend the adaptable and high yielding variety/ies for highland aeas of West Guji Zones and areas with similar agro-ecologies.
Materials and Methods
Description of the study area
For three years, a field experiment was conducted in the western Guji of Bule hora woreda (2017 to 2019). The study sites were identified as having a bimodal rainfall distribution pattern at an elevation of 2100 masl. Maize (Zea mays L), wheat (Triticum aestivum L.), and Tef (Eragrostis tef (Zucc.) Trotter) are some of the major field crops grown in the study areas.
Experimental materials and design
Six improved foods barely varieties brought from Sinana Agricultural Research Center were compared to a local cultivar for grain yield and yield-related agronomic traits. Randomized Complete Block Design (RCBD) in three-replication with a net plot size of 1.2mx2m and spacing of 1.5m, 0.75m, and 0.2m between replications, plot, and row, respectively. Drilling method was used to sow seed at a rate of 125 kg/ha. The use of inorganic fertilizer is also advised. Every agronomic practice was carried out in the same manner.
Collected data
Plot based data
The data on the following attributes was collected on the basis of the central four rows in each plot.
- Days to 50% heading (DTH): The number of days from date of sowing to the stage where 75% of the spikes have fully emerged.
- Days to 90% maturity (DTM): The number of days from sowing to the stage when 90% of the plants in a plot have reached physiological maturity.
- Grain yield (GY): Grain yield in grams obtained from the central four rows of each plot and converted to kilograms per hectare at 12.5% moisture content.
- Thousand kernel weights (TKW): Weight of 1000 seeds in gram.
- Above ground biomass (BM): The plants within the four central rows were harvested and weighed in grams.
Plant base data
Ten plants were randomly selected from the four central rows for recording the following observations:
- Number of productive Tillers (TN): The average number of productive tillers with heading
- Plant height (PH): The average height in cm from ground level to the tip of the spike.
- Spikelet per spike (SPS): The average number of spikelets per spike.
- Spike length (SL): The average spike length in cm from its base to the tip.
Data analysis
Before computing the combined analysis, error variance homogeneity test was performed using the procedure suggested by Gomez and Gomez (1984). The collected data were organized and analyzed using SAS statistical package (SAS, 2006 version 9.03). Mean separation was done by using least significant difference (LSD) at 1% probability level through employing the procedure developed by Gomez and Gomez (1984). In the combined analysis of variance, over year were considered random and genotypes were considered fixed.
The mathematical model used for analysis of variance was:
Yijk = μ + Gi + Yj + GYij + Bk(j) + Eijk
Where:
Yijk = observed value of genotype i in block k of year j
µ= grand mean
Gi= effect of genotype i
Yi=effect of year j
GYij=the interaction effect of genotype i, year j
Bk (j) = effect of block k in location/environment
Eijk = random error or residual effect of genotypei in block k of location j
Results And Discussion
Analysis of Variances (ANOVA)
Combined analysis of variance detected significant difference of variety and over the year analysis for all agronomic traits (Table 1). Over year analysis explained significant of variety for all agronomic traits except TSW. On the other hands, ANOVA exhibited presence of significant interaction effect of variety by year for all most all of agronomic traits except SPS, TSW (Tables 2 & 3). Thus, analysis of variance depicted the existence of significant effect of fluctuating weather condition on mean performance of most of the traits (Figure 1). The finding of the study supported previous report of [8-12].
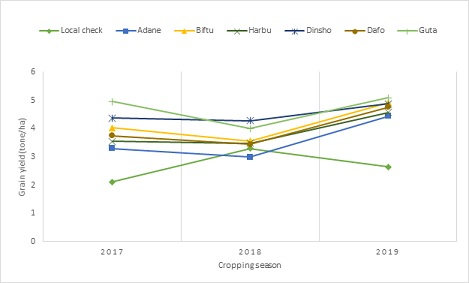 Figure 1: Performance of food barley genotypes across seasons Bule Hora, Southern Oromia.
|
Genotypes |
DF |
DM |
PH (cm) |
SL (cm) |
TN |
SPS |
BM (ton/ha) |
TKW |
GY (ton/ha) |
|
2017 cropping season |
|||||||||
|
Local check |
78.67a |
120.00a |
72.07c |
10.07ab |
2.00c |
32.20c |
8.03cde |
38.81b |
2.11e |
|
Adane |
76.67a |
110.00b |
88.47b |
9.47abc |
2.00c |
43.93a |
13.11a |
40.90ab |
3.29d |
|
Biftu |
71.67b |
102.33c |
102.73a |
9.13bc |
2.53c |
42.87a |
7.24de |
42.30ab |
4.03bc |
|
Harbu |
69.67b |
101.33cd |
103.87a |
9.00c |
3.33b |
41.20ab |
5.41e |
41.46ab |
3.55cd |
|
Dinsho |
69.00bc |
98.00de |
99.27a |
10.20a |
3.33b |
34.00bc |
11.84ab |
42.43a |
4.37ab |
|
Dafo |
66.00cd |
96.67e |
101.27a |
10.00abc |
4.40a |
36.87abc |
10.29abc |
41.06ab |
3.74cd |
|
Guta |
64.00d |
97.67de |
103.73a |
10.17ab |
3.40b |
43.67a |
9.66bcd |
41.83ab |
4.96a |
|
Mean |
70.81 |
103.71 |
95.91 |
9.72 |
3 |
39.25 |
9.37 |
41.26 |
3.72 |
|
CV |
2.504 |
2.031 |
5.678 |
5.991 |
13.413 |
12.56 |
17.237 |
4.801 |
9.4 |
|
LSD |
3.154 |
3.747 |
9.689 |
1.034 |
0.716 |
8.77 |
2.873 |
3.524 |
0.62 |
|
2018 cropping season |
|||||||||
|
Local check |
82.00a |
114.67c |
78.07ab |
10.43a |
2.00b |
33.67a |
7.71a |
38.47a |
3.29bc |
|
Adane |
69.00b |
122.67a |
76.87b |
10.00ab |
2.33ab |
33.78a |
4.65bc |
33.30b |
2.99bc |
|
Biftu |
68.00bc |
118.67abc |
78.93ab |
9.07b |
2.67ab |
40.67a |
3.98c |
29.96b |
3.56b |
|
Harbu |
68.67b |
120.67ab |
87.80ab |
9.67ab |
2.67ab |
32.00a |
6.96ab |
33.13b |
3.48b |
|
Dinsho |
66.33cd |
118.33abc |
91.93a |
10.20ab |
3.00a |
35.56a |
7.95a |
33.43ab |
4.28a |
|
Dafo |
64.33e |
117.33bc |
88.07ab |
9.87ab |
2.67ab |
42.89a |
5.64bc |
33.87ab |
3.44b |
|
Guta |
65.67de |
115.67c |
86.20ab |
9.93ab |
2.67ab |
44.33a |
7.63a |
33.50ab |
4.00a |
|
Mean |
69.14 |
118.29 |
83.98 |
9.88 |
2.57 |
37.56 |
6.36 |
33.67 |
3.57 |
|
CV |
1.599 |
2.117 |
9.357 |
6.717 |
19.598 |
21.992 |
26.259 |
8.419 |
6.77 |
|
LSD |
1.967 |
4.455 |
13.98 |
1.181 |
0.897 |
14.693 |
2.971 |
5.042 |
4.31 |
|
2019 cropping season |
|||||||||
|
Local check |
78.00abc |
134.00a |
82.73c |
9.33b |
4.33a |
52.00a |
6.36b |
43.40a |
2.64d |
|
Adane |
80.67a |
140.33a |
103.27ab |
11.60a |
4.33a |
53.00a |
9.96ab |
41.40a |
4.44c |
|
Biftu |
77.00bc |
134.33a |
107.87ab |
11.93a |
4.67a |
51.00a |
10.44ab |
43.07a |
4.91ab |
|
Harbu |
77.67abc |
135.67a |
109.93a |
12.40a |
4.67a |
49.67a |
9.65ab |
42.50a |
4.57bc |
|
Dinsho |
75.33c |
131.67a |
105.87ab |
12.00a |
4.00a |
55.00a |
9.36ab |
43.63a |
4.88abc |
|
Dafo |
76.33c |
131.00a |
100.87b |
12.07a |
4.00a |
51.33a |
9.72ab |
42.17a |
4.75abc |
|
Guta |
80.33ab |
133.67a |
102.47ab |
12.37a |
4.67a |
57.33a |
11.54a |
42.50a |
5.08a |
|
Mean |
77.91 |
134.38 |
101.86 |
11.67 |
4.38 |
52.76 |
9.58 |
42.67 |
4.47 |
|
CV |
2.469 |
4.819 |
4.789 |
4.582 |
11.322 |
12.135 |
25.778 |
7.085 |
5.72 |
|
LSD |
3.4212 |
11.52 |
8.677 |
0.951 |
0.882 |
11.39 |
4.392 |
5.378 |
4.54 |
Table 1: Mean performance of yield and yield related traits of Food barley Varieties during 2017, 2018 and 2019 main cropping season at Bule hora Woreda of western Guji Zone.
Key: DF=degree of freedom, FD=flowering data, MD= maturity date, PH=plant height, SL= spike length, TN=number of productive tillers, SPS=number of spikelet per spike, BM= biomass yield, TSW=thousand kernel weight, GY=grain yield
|
Source Variance |
DF |
FD |
MD |
|
PH (cm) |
SL (cm) |
TN |
SPS |
|
BM (ton/ha) |
TKW |
|
GY (ton/ha) |
|
Replication |
4 |
45.32ns |
9.86ns |
|
50.92ns |
0.23ns |
0.13ns |
23.82n |
|
1.37ns |
3.39ns |
|
5.60ns |
|
|
|
|
|
|
|
|
|
s |
|
|
|
|
|
|
Year |
2 |
454.62*** |
4941.40*** |
|
1740.48*** |
24.65*** |
18.78*** |
1458.60*** |
|
68.06*** |
492.07*** |
|
48.06*** |
|
|
|
|
|
|
|
|
|
|
|
|
|
|
|
|
Genotypes |
6 |
124.74*** |
119.61*** |
|
572.75*** |
1.09* |
1.13*** |
80.63ns |
|
11.23* |
3.80ns |
|
3.97* |
|
|
|
|
|
|
|
|
|
|
|
|
|
|
|
|
Year*genotype |
12 |
38.71*** |
73.60*** |
|
96.60* |
1.83*** |
0.86*** |
42.40ns |
|
12.79** |
10.56ns |
|
5.51*** |
|
|
|
|
|
|
|
|
|
|
|
|
|
|
|
|
Residue |
36 |
2.69 |
17.55 |
|
38.40 |
0.36 |
0.22 |
44.50 |
|
3.83 |
7.03 |
|
8.23 |
|
|
|
|
|
|
|
|
|
|
|
|
|
|
|
|
CV |
|
2.2576 |
3.52 |
|
6.59 |
5.71 |
14.15 |
15.44 |
|
23.20 |
6.76 |
|
7.31 |
Table 2: Mean Square of Food Barley at Bule Hora, southern Oromia.
Key: DF=degree of freedom, FD=flowering data, MD= maturity date, PH=plant height, SL= spike length, TN=number of productive tillers, SPS=number of spikelet per spike, BM= biomass yield, TSW=thousand kernel weight, GY=grain yield, ns=non-significant
|
Genotypes |
DF |
DM |
|
PH (cm) |
SL (cm) |
TN |
SPS |
|
BM (ton/ha) |
TKW |
GY (ton/ha) |
Yield advantage % |
|
Local check |
79.56a |
122.89ab |
|
77.62c |
9.94c |
2.78c |
39.29b |
|
7.37b |
40.23a |
2.68e |
0.00 |
|
|
|
|
|
|
|
|
|
|
|
|
|
|
|
Abdane |
75.44b |
124.33a |
|
89.53b |
10.36abc |
2.89bc |
43.57ab |
|
9.24ab |
38.53a |
3.57d |
24.93 |
|
|
|
|
|
|
|
|
|
|
|
|
|
|
|
Biftu |
72.22c |
118.44c |
|
96.51a |
10.04bc |
3.29ab |
44.84ab |
|
7.22b |
38.44a |
4.17b |
35.73 |
|
Harbu |
72.00c |
119.22bc |
|
100.53a |
10.36abc |
3.56a |
40.96b |
|
7.34b |
39.03a |
3.87c |
30.75 |
|
Dinsho |
70.22d |
116.00c |
|
99.02a |
10.80a |
3.44a |
41.52ab |
|
9.72a |
39.83a |
4.51a |
40.58 |
|
Guta |
70.00d |
115.67c |
|
97.47a |
10.82a |
3.69a |
48.44a |
|
9.61a |
39.28a |
4.68a |
42.74 |
|
Dafo |
68.89d |
115.00c |
|
96.73a |
10.64ab |
3.58a |
43.70ab |
|
8.55ab |
39.03a |
3.98bc |
32.66 |
Table 3: Combined ANOVA of food barley mean performance across all seasons Bule Hora, Southern Oromia.
Key: DF=degree of freedom, FD=flowering data, MD= maturity date, PH=plant height, SL= spike length, TN=number of productive tillers, SPS=number of spikelet per spike, BM= biomass yield, TSW=thousand kernel weight, GY=grain yield
Combined analysis of overall years
Based on cropping season productivity, the 2019 cropping season outperformed all others, with a high yield from the variety Guta (5.08 tone/ha), while the 2017 cropping season was less productive (4.28 tone/ha) grain output from the Dinsho variety (Figure 1). In both the 2017 and 2019 cropping seasons, the Guta variety produced higher yields, whereas the local check produced lower yields than all other types. As a result, we may infer that the cropping season of 2019 was better than all others, whereas the cropping season of 2018 was the worst cropping season for barely in study area (Figure 1).
Mean performance of varieties across years
Days to Flowering (DF)
Statistically significant variation (P < 0.01) was observed in days to flowering among tested varieties (Table 2). Mean value of flowering date varied from 79.56 (Local) to 68.89 (Dafo) with over all mean value of 72.62. Local barley varieties had the longest flowering date, while Dafo had shorter flowering date (Table 3). The result was considered with the finding of [9,11,13].
Days to 95% physiological maturity (DM)
Significant difference of variation was observed at (P < 0.01) in days to 95% physiological maturity (Table 2). The mean value of date of maturity ranged from 124.3 for Abdane to 115 for Dafo with over all mean value of 118.79. Abdane had significantly longer mean value of date of maturity (Table 3). The result supported by [12] who reported significant variation of variety for flowering and maturity date.
Plant Height (PH)
The study also found significantly shorter for Local followed by Abdane and longer for Harbu, Dinsho, Guta, Dafo and Biftu for mean value of Plant Height (Table 2). The highest plant height was recorded for Harbu variety (100.53 cm) while the lowest plant height was recorded for local variety (77.62 cm) (Table 3). [10] found similar significant difference among different food barely genotypes in their study.
Spike Length (SL)
The analysis of variance showed that there was significant (P< 0.05) difference among the tested varieties in spike length (Table 2). The tallest spike length was recorded for Guta (10.82 cm), while Local check (9.94 cm) was the shortest (Table 3).
Productive Tiller Number (TN)
The analysis of variance showed that there was significant (P< 0.01) difference among the tested varieties in spike length (Table 2). The highest tiller number was recorded for Guta while the lowest was recorded for local check Table 3).
Above ground biomass (BM)
Statistically significant variation (P< 0.05) was observed in total biomass among tested varieties (Table 2). The highest biomass was obtained from Dinsho (9.72 tone/ha) while the lowest biomass was obtained from Biftu variety (7.22 tone/ha) (Table 3). Significant difference among genotypes in above ground bilmass was reported by on malty barely on their study of Malt Barley (Hordeum vulgare L.) Varieties evaluation for yield and quality traits in Eastern Amhara Regional State, Ethiopia.
Grain Yield (GY)
Statistically significant variation (P< 0.05) was observed in total biomass among tested varieties (Table 2). The mean value of grain yield varied from 2.68 tone/ha (Local check) to 4.68 tone/ha (Guta) (Table 3). The yield advantage 42.74%, and 40.58% was estimated for Guta and Dinsho, respectively over the local check. Different authors reported significant different among food barely genotypes [10,13-15].
Conclusion and Recommendations
The experiment was conducted for three consultive years (2017-2019) at location of Bule hora districts to select food barley varieties that have a good performance in terms of yield and other different parameters. From the Overall years result, Guta variety was found superior over all other varieties tested grain yield and other important parameters. Therefore, Guta variety was recommended for production at Bule Hora and other similar agro ecologies of southern Oromia.
References
- Bedasa M (2014) Selection of Barley Varieties for their Yield Potential at Low Rain Fall Area Based on Both Quantitative and Qualitative Characters North West Tigray, Shire, Ethiopia. Int J Plant Breed Genet 8: 205-213.
- Central statistical Authority (CSA) (2015) Agricultural sample survey. Report on area and production of crops (Private peasant holding, meher season). Statistical Bulletin No. 578. Addis Ababa, Ethiopia.
- Mideksa T, Tadese K, Sabsibe H (2016) Registration of “Robera” a newly released food barley (Hordeum vulgare L.) variety for highland altitude areas of Ethiopia. Scientific Journal of Crop Science 5: 116-120.
- Eticha F, Sinebo W, Grausgruber H (2010) On-farm diversity and characterization of barley (Hordeum vulgare L.) landraces in the highlands of West Shewa, Ethiopia. Ethnobotany Research and Applications8: 25-34.
- Bekele H (2005) Infection biology, epidemiology and resistance of barley land race lines to Pyrenophora teres(Doctoral dissertation, A dissertation submitted in partial fulfillment of the requirements for the Degree of Doctor of Philosophy (Tropical Agriculture). Graduate School, Kasetsrat University, Thailand).
- Tadesse D, Mekuria W, Derso B, Asres T (2019) Food Barley Land races Characterization in the Northwestern Highlands of Ethiopia. African Journal of Agricultural Research 14: 209-217.
- Gomez, Kwanchai A, Arturo A (1984) Statistical procedures for agricultural research.
- Mekonnon B (2014) Selection of Barley varieties for their yield potential at low rainfall area based on both quantitative and qualitative characters North West Tigria Shire Ethiopia. Journal of plant breeding and genetics 8: 205-213.
- Tolesa T, Ashagre H, Abera T (2019) Agronomic Performance of Food Barley (Hordeum vulgare L.) Varieties and Their Response to Seed Rate at Elfeta District, West Showa Zone, Oromia National Regional State. Journal of Science and Sustainable Development7: 20-31.
- Birhanu A, Tahir Z, Tilahun M, Tilahun M, Hailu A (2020) Performance Evaluation and Adaptation of Food Barley (Hordeum Vulgare L.) Varieties in the Highlands of North Gondar Ethiopia. American Journal of Agriculture and Forestry8: 252-257.
- Assefa A, Girmay G, Alemayehu T, Lakew A (2021) Performance evaluation and stability analysis of malt barley (Hordeum vulgare L.) varieties for yield and quality traits in Eastern Amhara, Ethiopia. CABI Agriculture and Bioscience 2: 1-7.
- Hameso H, Worku W, Ayalew T (2021) Growth, Phenology and Yield Component of Barley (Hordeum vulgare L.) Genotypes as Affected by Fertilizer Types under Acidic Soil. American Journal of Bioscience and Bioengineering 9: 104-109.
- Tolesa T, Ashagre H, Abera T (2019) Agronomic Performance of Food Barley (Hordeum vulgare L.) Varieties and Their Response to Seed Rate at Elfeta District, West Showa Zone, Oromia National Regional State 7: 2304-2702.
- Mideksa T, Tadese K, Sabsibe H (2016) Registration of “Robera” a newly released food barley (Hordeum vulgare L.) variety for highland altitude areas of Ethiopia. Scientific J of Crop Sci 5: 116-120.
- Eticha F, Sinebo W, Grausgruber H (2010) On-farm Diversity and Characterization of Barley (Hordeum vulgare L.) Landraces in the Highlands of West Shewa, Ethiopia. Ethnobot Res Appl 8: 25-34.
Citation: Bakala N, Jibat I, Idao B (2022) Evaluation and Selection of Improved Food Barley (Hordeum Vulgare L.) Varieties in the Highland Areas of Western Guji, Southern Oromia. J Plant Sci Curr Res 6: 021.
Copyright: © 2022 Natol Bakala, et al. This is an open-access article distributed under the terms of the Creative Commons Attribution License, which permits unrestricted use, distribution, and reproduction in any medium, provided the original author and source are credited.