Evaluation of Drug Use Pattern Using WHO Drug Use Indicators At Tikur Anbessa Specialized Hospital, Addis Ababa, Ethiopia
*Corresponding Author(s):
Firomsa BekeleDepartment Of Pharmacy, College Of Health Science, Mattu University, Mattu, Ethiopia
Email:firomsabekele21@gmail.com
Abstract
Background
The irrational use of the drugs becomes a worldwide problem than lack of drug information. Therefore, the World Health Organizations developed the standard indicators to reduce the irrational drug use. The stud was aimed to evaluate drug use patterns based on this standard at Tikur Anbessa Specialized Hospital.
Methods
A facility based cross sectional study was conducted to analysis the prescription and patient care at Tikur Anbessa Specialized Hospital. Pre-tested structured checklist was employed to collect information from prescription papers and respondents after obtaining a verbal consent. Data was entered, cleaned, edited and analyzed using Statistical package for social science Version 20.
Results
Over the study period, a total of 2101 drugs were prescribed that means about 1.75 (SD=0.87) drugs were prescribed per patient. Of which, 88.86% of the drugs were prescribed by generic name, and 23.3% prescriptions had at least one antibiotic. Moreover, 19.7% prescription were contained at least one injectable medication. The average consultation time was 13.37 (SD=3.46) minutes and the average dispensing time was 96.73 (SD=4.51) seconds. A total of 83.3% of patients had good knowledge about the medicine dispensed. In our study, a total of 88% essential drugs were prescribed from the national essential list, formulary list and standard treatment guidelines.
Conclusion
The pattern of drug use in Tikur Anbessa Specialized Hospital was consistent with the indicators of World Health Organization standard value. The average consultation time, dispensing time and patient knowledge about the drugs was within the standard. Despite this, there is a need to improve availability of key drugs, labelling, generic prescribing pattern and injection prescribing pattern.
Keywords
Ethiopia; Facility indicators; Patient care indicator; Prescribing indicator; Tikur Anbessa Specialized Hospital
Abbreviations
EDL: Essential drug list
HIV: Human Immune Deficiency Virus
OPD: Outpatient Department
SPSS: Statistical Package for the Social Sciences
SD: Standard deviation
TASH: Tikur Anbessa Specialized Hospital
WHO: World health organization
Introduction
Irrational drug use is defined as patients taken appropriate drugs as per their needs, correct dose, and adequate duration at affordable cost [1]. According to the WHO, more than 50 % of all medicines are prescribed, dispensed or sold inappropriately and half of the patients were fail to take it appropriately [2-4]. The irrational use of drugs becomes the world-wide problem than the absence of drugs information [5].
Essential drugs have an indispensable role in maintaining the health of the patients [2]. Therefore, increasing access to essential drugs and their rational use can improve health status and secure development gains [2,6,7].
The WHO had developed the core components of drug use indicators [2]. Moreover, about one-third of the world’s population especially in developing country lacks access to essential medicines [5]. The common types of irrational medicine use are poly pharmacy, inappropriate indication, dose and route [7].
Irrational drug use is repeatedly reported by WHO in which the patients are inappropriately followed of their treatment plan [2]. In the developing countries, like Ethiopia, the problem is exacerbated by limited resources and inadequate drug policy [3].
An adequate supply of essential drugs and access to unbiased information are the components used by WHO to assure rational drug use [8]. Therefore the essential drug list and formulary should be available at heath facility [8-11].
Study conducted in Pakistan showed that Poly-pharmacy, brand prescribing, over-prescribing of antibiotics, short consultation and dispensing times, lack of patients’ knowledge about prescribed medicines and unavailability of all key drugs in stock were the major issues that need attention of the healthcare authorities [12].
Study conducted in Ethiopia showed that percentages of antibiotic and injection exposure were found to be very high as the result of patient’s pressure on physicians to prescribe injectable medicines and lack of pharmaceutical care services. The average times spent for consultation and dispensing were very short in all the hospitals involved in the study due to the increased patients flow in hospital, insufficient pharmacist and a few numbers of drugs were adequately labeled [13].
Even though irrational drug uses are common in both developed and developing countries, the degree of the problem is higher in developing countries like Ethiopia where practices such as inappropriate dosage of drugs, ineffective drug therapy, inappropriate use of drugs and overuse of antimicrobials and injections are very common due to poor regulatory system to support clinical pharmacy service [3,14,15]. Despite this, there was a scanty of studies on rational drug use at specialized hospital of Ethiopia. Therefore the study was aimed to assess drug use patterns at TASH.
The study would reduce the unsafe and ineffective drug therapy, treatment costs, prolonged hospitalization, and harm to the patients by decreasing the inappropriate use of medicine via improving the prescribing and dispensing practice and findings from this study may be used as an input for regulatory authorities, pharmacy professionals and medical representatives, and other stakeholders for designing frameworks in TASH for the implementation and monitoring of drug use patterns in parallel with the ethical code of conduct.
Methods
Study area, design and period
Facility based cross sectional study was used for the study from March 01, 2018 to Feb 28, 2019 (prescribing indicators), from April 20 to May 20 2019 (patient care indicators and facility indicator). Different OPD clinics and general outpatient pharmacy were used to assess the patient care indicators.
Study participants and eligibility criteria
In our study 30 patient were included to assess the patient’s indicators. Of these, 18 were males and 12 were females. A total of 27 (90%) were in the age range of 18-64years and 3 (10%) were above 65 years while the mean and standard deviation of the participants age was 37 (SD=7.15). All outpatient prescriptions dispensed, patient attendants during the study period and drugs under essential drug lists of Ethiopia were included whereas, patients unwilling to participate, incomplete prescription, prescriptions that contain only medical supplies like glove, syringe and patient attendants outside the normal working hours were excluded.
Sample size and sampling technique
At least 600 sample sizes is recommended for prescribing indicators as WHO prescribing indicator standard and double of this minimum standard was used which means 1200 prescriptions, and the prescription was taken by systemic random sampling technique. This means 100 prescriptions were taken from each month from March 31, 2018 to Feb 01, 2019. A total of 30 patients were used for assessing patient care indicators.
Data management and statistical analysis
The collected data was checked for its completeness and internal consistency on daily bases. Finally the data was entered into EPI-data version 3.1. The results were expressed in terms of means and percentages and presented using tables and graphs. The different values of the indicators obtained were compared with WHO standards.
Data collection process
To collect the data we have used the standard WHO checklist which includes prescriber, patients and health facility indicators [9]. One medical doctors and two pharmacist were recruited for data collection.
Operational definition
Dispensing time: Is the time interval between the patients giving the prescription to dispenser and patient receiving medication [16]. Drug Knowledge: Ideally this explication includes the reasons why medications are being given, how each drug should be used as well as information about precaution and possible side effects.
- Generic drug: Non-proprietary name of drugs
- Labelling: To be adequate, the drug packages should have at least patient name, drug name, and when the drug should be taken.
- Poly-pharmacy: The daily consumption of 5 or more medications
Results
Prescribing indicators
Diagnosis is one important thing to be written on the prescription, those prescriptions without diagnoses can make difficulty for pharmacists to counsel patient about its medical and medication condition because almost all medications has two and above indications. Among 1200 prescription encounters only 14 (1.16%) prescriptions had diagnosis, were 98.4% of prescriptions has no diagnosis. For the assessment prescribing pattern, a total of 1200 prescription encounters were included in the study at the OPD pharmacy. Of these, 2101 drugs or on average 1.75 (SD=0.87) were prescribed. Among the total number of drugs prescribed, 1867 (88.86%) of them were prescribed by generic name (Table 1).
|
Indicators (N=1200) |
Frequency |
Percentage/ average |
WHO standard |
|
|
Prescribing indicator |
Average number of drugs per encounter |
2101 |
1.75 (SD=0.87) |
1.6 – 1.8 |
|
Percentage of drugs prescribed by generic name |
1867 |
88.86% |
100% |
|
|
Percentage of antibiotic prescribed |
280 |
23% |
20.0%-26.8% |
|
|
Percentage of injection prescribed |
236 |
19.7% |
13.4%- 24.1% |
|
|
Percentage of drug prescribed from Drug formulary |
2101 |
100% |
100% |
|
Table 1: Results of prescribing indicators at outpatient pharmacy in TASH, May 2019.
From the total drug prescribed about 280 (23.3%) of prescriptions contained antibiotics that lies within normal range of WHO standard. Moreover, 236 (19.7%) prescription contained at least one injectable medication (Figure 1).
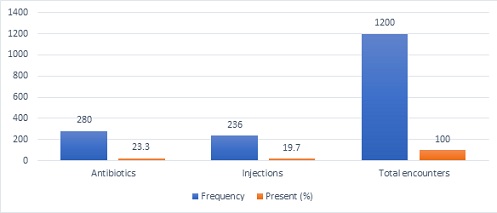 Figure 1: Prescriptions with antibiotics and injections at OPD pharmacy in TASH, May 2019.
Patient care indicators
The minimum consultation time was 4 minutes and the maximum was 27 minutes while the average consultation time was 13.37 (SD=3.46) minutes and the average dispensing time was 96.73 (SD=5.41) seconds whereas the minimum and maximum dispensing time during this study was 34sec and 176sec respectively (Table 2).
|
Indicators (N=30) |
Sum of Individual Records |
Percentage/average |
WHO Standard |
|
|
Patient indicator |
Consultation time |
401 |
13.37 (SD=3.46) |
≥10min |
|
Dispensing time |
2942 |
96.73 (SD=5.41) |
≥60sec |
|
|
No of drugs actually dispensed |
55 |
69.62% |
100% |
|
|
Adequately labelled |
0 |
0% |
100% |
|
|
Know Dosage |
25 |
83.3% |
100% |
|
Table 2: Summary of patient care indicators at OPD pharmacy in TASH, May 2019.
During this study, from the 79 drugs prescribed, only 55 (69.62%) were actually dispensed. This result does not meet WHO standard that should be 100% and implies that the health facilities are unable to provide the drugs which were prescribed. From drugs that were prescribed, none of them was adequately labeled. Of the 30 patients involved in patient care indicators, 25 (83.3%) of patients had the adequate knowledge about the drug whereas 5 (16.7%) did not have adequate knowledge.
Health facility indicators
Regarding health facility indicators, the hospital has updated facility specific pharmaceutical lists like copies of the national EDL, local formulary or STG. The number of key/essential drugs at TASH are 25, during the study 22 (88%) of key drugs were available and 3 (12%) were not available on hand (Figure 2).
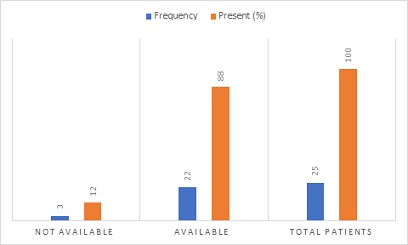 Figure 2: Availability of key drugs at OPD pharmacy in TASH, May 2019.
Discussion
The study revealed that the average number of drugs per prescription was 1.75 (SD=0.87) which was similar to WHO recommendation (1.6-1.8) and the result found in this study was better than the studies of Ayder Referral Hospital, Northern Ethiopia which was 2.61 [17], Hawassa referral hospital, Southern Ethiopia which was 1.9 [7] and University of Gondar which was 1.88 [16]. Generally, keeping the mean number of drugs per prescription as low as possible is always preferable to reduce the risk of polypharmacy which can lead to drug-drug interaction, development of drug resistance and adverse drug events [17].
From the total number of drugs prescribed a total of 1867 (88.86%) were prescribed by generic name. These findings finding was better than the study of Pakistan which was 56.6% [12], and consistent with the study of eastern Ethiopia [13]. Inappropriate use of brand drugs can have the negative impact on the health care costs both for patients and hospitals as well [3,12].
The proportion of antibiotics prescribed in our study was 280 (23.3%) which was similar to the WHO standard value (20.0-26.8). However it was lower than the studies of Hawassa university teaching and referral hospital and government hospitals of Dessie town which were 58.1% and 42.6%, respectively [18,19]. Despite this, the utilization of antibiotics might be low or high since the indications of antibiotics for different infectious disease was not assessed in our study. The inappropriate use of antibiotics could results in the emergency of resistant microorganism [17]. So, it encouraged to carefully use appropriate antibiotics.
In our study, the proportion of injection use was 236(19.7%) which is comparable to the WHO standard value i.e., 13.4-24.1% [9] and higher than the study of Arba minch hospital which was 62 (10.3%) and Chencha Hospital which was 58 (9.7%) [3]. However, it is lower than study done in Hawassa referral hospital 38.1% [7]. The reduction of percentage of encounters with injections may have an advantageous in reducing the possibility of transmissions of blood born infections like HIV, and hepatitis [17].
The average consultation time was13.37 min which was consistent with WHO recommendation but higher than the study of Pakistan [9,12]. Generally, longer consultation time had improved patient satisfaction and more effective resource use. In our study, the average the average dispensing time was 96.73sec. Time spent for dispensing was better when compared to the average dispensing for other studies; Pakistan (8.7sec) [12])and University of Gondar 64.8sec [16].
Among 79 drugs prescribed for 30 patients, only 55 (69.62%) were actually dispensed. This finding was lower than the study of Pakistan which was (98.07 %) [12] and India which was 96.6% [20]. The difference might be partly ascribed to differences in the national logistic management system. Studies have showed that good drug and medical supply management ensures continuous supply of drugs and prevents frequent stock outs and wastages [13].
In this study, none of the drugs were adequately labeled which was incontinent with WHO standards [9]. This result was lower than the study conducted in Pakistan and India which was 100% [12] and 99.3% [20], respectively and higher than the study of University of Gondar which was 18.5% [16]. The variations obtained might be due to increased patient flow and inadequacy of knowledge and skill in labelling of prescribed drugs.
In TASH about 83.3% of patients had adequate knowledge regarding the dose and frequency of drug which was higher than the study done of Zimbabwe (70%) [21] and public hospitals of eastern Ethiopia (75.7%) [13]. In our study the percentage of the patients who had poor knowledge of the dosage regimens was low than two studies above. Since the assessment of knowledge was done immediately, the impact of labeling on patient knowledge might seem insignificant. But their knowledge will fade when the time elapses.
The study revealed that TASH OPDs had a copy of the EDL which was in line with the WHO standard [9]. However, only 23 (88%) of key drugs were available on hand in this facility. Among 25 drugs 3(12%) Zinc, Implanon NXT and Medroxy progesterone (depo) injection were not available during data collection. The unavailability of the essential drugs in the hospital might pose extra burden on the patients’ through “out of pocket “expense. The finding was better than the study of Pakistan and public hospitals of eastern Ethiopia which was 72.4% and 66.7%, respectively [12,13].
Limitation of the study
The weakness of this study was only describing the drug prescribing and dispensing patterns in the outpatient departments of the hospitals. Thus, it didn’t reflect the drug use in inpatient wards of the hospitals. Besides this, the study was retrospective and conducted in single center that made difficulties for the representative of the national or regional trends. The over flow of patients is full of challenge to assess their knowledge. Finally we have used the WHO recommendations to calculate sample size. Therefore, sample size calculation was not performed.
Conclusion
The pattern of drug use in TASH was in an optimal level that was within the standards of WHO recommendation. The pattern of antibiotics and injection prescribing appears appropriate when compared with the world health organization guideline. Despite the majority of the patients had adequate knowledge of their treatment, there should be a need to improve patients’ knowledge and on dispensed drugs. In TASH the health care administrators should increase the availability of key drugs in the stock by enhancing drug supply management systems in the outpatient pharmacies of the hospitals.
Declarations
Ethics approval and consent-to-participate
The study conducted after ethically clearance was obtained from ethical review committee of School of Pharmacy, College of Health Sciences, Addis Ababa University, and permission was obtained from medical directors of TASH. The interview was carried out only with full consent of the patient/caregiver/parent. Each respondent was assured that the information provided by him/her would be confidential and used only for the purpose of research.
Acknowledgment
Our gratitude was goes to Addis Ababa University for helping us by providing logistics. Lastly, we acknowledge health professionals working in TASH, data collectors, and participants involved in the study for their cooperation
Authors’ Contributions
WA was contribute in the proposal development, methodology, analysis, and preparing the first draft of the manuscript. ZT and FB were contributed to the methodology and editing of the manuscript. The final revised manuscript was approved by all authors before submission.
Consent for publication
Not applicable. No individual person’s personal details, images, or Videos are being used in this study
Funding
None
Availability of data and materials
The materials used while conducting this study are obtained from the corresponding author on reasonable request.
Competing interests
No competing interests exist.
References
- World Health Organization (1985) The Rational use of drugs: Report of the conference of experts Nairobi. Dev Dialogue 2: 1-4.
- World Health Organization (2002) Promoting rational use of medicines: Core components -WHO policy perspectives on medicines.
- Mensa M, Tadesse T, Ayele A (2017) Assessment of drug use pattern by using WHO Core drug use indicators at public hospitals in Ethiopia. J Community Med Health Educ.
- Sharif SI, Al-Shaqra M, Hajjar H, Shamout A, Wess L (2008) Patterns of drug prescribing in a hospital in Dubai, United Arab Emirates. Libyan JMed 3: 10-12.
- Angamo M, Wabe NT, Raju NJ (2011) Assessment of Patterns of Drug use by using World Health Organization’s Prescribing, Patient Care and Health facility indicators in Selected Health Facilities in Southwest Ethiopia.
- WHO (2000) WHO Medicines Strategy: Framework for action Essential drugs and
Medicines policy 2000-2003. - Assessment of drug use pattern using WHO prescribing indicators at Hawassa University teaching and referral hospital, south Ethiopia: Across-sectional study. BMC 13: 170.
- Enwere OO, Falade CO, Salako BL (2007) Drug prescribing pattern at the medical outpatient clinic of a tertiary hospital in southwestern Nigeria. Pharmacoepidemiol Drug Saf 16: 1244-1249.
- WHO (1993) How to investigate drug use in health facilities, selected drug use indicators. Geneva Action program on Essential Drugs.
- Hogerzeil HV, Walker GJA, Sallami AO, Fernando G (1989) Impact of an essential drugs program on availability and rational use of drugs. Lancet 141-14
- Laing RO, Hogerzeil HV (2001) Ten recommendations to improve use of medicines in developing countries. Health Policy Plan 16: 13-20.
- Atif M, Sarwar MR, Azeem M, Umer d, Rauf D, et al. (2016)Assessment of WHO/INRUD core drug use indicators in two tertiary care hospitals of Bahawalpur, Punjab, Pakistan. J Pharm Policy Pract 22: 27.
- Sisay M, Mengistu G, Molla B, Amare F, Gabriel T (2017) Evaluation of rational drug use based on World Health Organization core drug use indicators in selected public hospitals of eastern Ethiopia: A cross sectional study. BMC Health Serv Res 17: 161.
- Bekele F, Tsegaye T, Negash E, Fekadu G (2021) Magnitude and determinants of drug related problems among patients admitted to medical wards of southwestern Ethiopian hospital. A multicenter prospective observational study. Plose One 16: e0248575.
- Bekele F, Fekadu G, Bekele K, Dugassa D, Sori J (2021) Drug related problem among patients with infectious disease admitted to medical wards of Wollega university referral hospital: Prospective observational study. Sage open medicine 9: 1-8.
- Getahun KA, Redia AS, Aragaw TJ (2020) Evaluation of drug use pattern using WHO core drug use indicators and completeness of prescription at university of Gondar comprehensive specialized hospital, Gondar, Ethiopia. A cross-sectional study. Integrated pharmacy research and practice 9: 219-227.
- Demeke B, Molla F, Asses A, Melkam W, Abrha S, et al. (2015) Evaluation of drug utilization pattern using WHO prescribing indicators in Ayder referral hospital, Northern Ethiopia. International of pharma science and research 6: 343-347.
- Desalegn AA (2013) Assessment of drug use indicators using WHO prescribing indicators at Hawassa university teaching and referral hospital,south Ethiopia. BMC health services research 13: 170.
- Mengistu G, Misganaw D, Tsehay T, Kassa B, Bogale K (2020) Assessment of drug use pattern using WHO core prescribing indicators at outpatient setting of government hospitals in Dessie town. Drug,health care and patient safety 12: 237-244.
- Parasad PS, Rudra JT, Vasanthi P, Sushitha U, Jaffar M, et al. (2015) Assessment of drug use pattern using WHO core drug use indicators at secondary care referral hospital of South India. Chrismed Journal of health and research 2: 223-228.
- http://www.mohcc.gov.zw/index.php?option=com_content&view=article&id=153&Itemid=472
Citation: Amsalu W, Tilahun Z, Bekele F (2022) Evaluation of Drug Use Pattern Using WHO Drug Use Indicators At Tikur Anbessa Specialized Hospital, Addis Ababa, Ethiopia. J Community Med Public Health Care 9: 118.
Copyright: © 2022 Wakuma Amsalu, et al. This is an open-access article distributed under the terms of the Creative Commons Attribution License, which permits unrestricted use, distribution, and reproduction in any medium, provided the original author and source are credited.