Evaluation of the Patients Data Forms which Arrives at Emergency Medical Services by Ambulance
*Corresponding Author(s):
Ismail TaskentDepartment Of Radiology, Mus State Hospital, Mus, Turkey
Tel:+ 90 5357969360,
Email:dr.taskent@gmail.com
Abstract
Objective: In this study, we came to know about the patient who arrives to emergency medicine by the ambulance between July 2015- July 2016 and we aimed to improve usage of the ambulance for emergency service in our province.
Methods: The ambulance data form which was filled from the ambulance staff was checked and a descriptive study was done retrospectively. SPSS 22 is used for statical analysis in this study.
Results: Patients who arrives to emergency medicine with an ambulance are 48.4% female and 51.4% male the usage of Ambulance service is higher during spring and 11.9% in May. Additionally, the most common age group that are using Ambulance service is 80-89 with 20.9% and the average time that ambulances arrivesis7.80 (± 6.342) minutes, waiting time is 13.29 ± 9.009and arriving time at hospital is 9.85 ± 7.328 minutes. It is determined that most common reasons about the emergence calling are medical (66.2%) and traffic accidents (11.4%) When the cases are analyzed according to the early diagnosis, its determined that the group of minor trauma has the powerful reason by 13.8% and trauma facts are 25.6%. When the analyses of trial is evaluated, the facts are clear with the 80.7% patients sorting codes are not shown in the form, furtherly8 % of the patients are shown as yellow code. According to the members of GCS (Glasgow Coma Scale) teams' results, the average value of the GCS is 13.2% of which 2.4% of the patients are helped by cardiac life Support unit, 77 patients are taken care at the spot by the team.
Conclusion: Pre-hospitalization is one of the most important case of this study, the patients must reach the hospital at the right time. On the other hand ambulance service should be available emergency patients. The people must be organized, information about the usage an ambulance service and public service ads should be circulated. Ambulance case form is important part of emergency medicine system so ambulance staff should and must fill in the case forms properly.
Keywords
Ambulance case forms; Command center; Emergency medicine system
INTRODUCTION
Medical Emergency, accidents, injuries are common like Earth quake and floods, we live in a country where intense terrorist incidents occur for these reasons, the organizational structure, applications of emergency health services at country level are important [1].
The emergency medical system is a multidisciplinary approach for reporting of an emergency case to the definitive treatment and completion of the intervention. The important building blocks of the system are health care workers and ambulance services.
In Turkey, the development of provision ambulance services has begun in the late 1980s. In 1986, under the name ?eklindeH?z?r Emergency Service an ambulance service was started for patient transportation in three metropolitan cities (Ankara, ?stanbul, ?zmir). In 1994, devre 112 Emergency Aid and Rescue “was introduced. A team consisting of general practitioner, nurse and driver started to work in ambulances. Nowadays, health workers who are trained in emergency interventions such as paramedic and emergency medical technicians have been added to this team [2].
Command and Control Center operates the head of provincial ambulance service (Turkish Medical Association web site), Provincial Ambulance Service Working Directive for population of the province, emergency health call number, number of stations and sufficient number of staff according to the characteristics of the province technical hardware and software infrastructure with the appropriate physical structures are established (112 Emergency Call Center Establishment, Duty and Work Regulation). The Crisis Command Center is capable of managing all ambulances, other centers, emergency services of hospitals and intensive care units.
The aim of this study is to obtain information about the quality of pre-hospital health services by examining the registration forms of patients brought to the emergency department by ambulance 112.
METHODS
This study was conducted by evaluating the ambulance case registration forms by including all cases except pediatric (except trauma) and pregnant (except trauma) patients who were brought to the emergency department by 112 during July 2015-July 2016 period. The variables of the research were determined according to the data below:
Age, gender, months of application, cause of emergency call (medical diseases, traffic accident, work accident, trauma, suicide, fire, health measures, protocol and other reasons), ambulance arrival time at the scene, departure time, hospital admission time, preliminary diagnoses (cardiovascular , respiratory, neurological, gastrointestinal, psychiatric, genitourinary, obstetrics and gynecology, metabolic, infectious diseases, poisoning, trauma and other causes), results of cases (on-site intervention, transfer to hospital, transfer between hospitals, transfer for medical examination, home transfer, exit us, refusal of transport, other arrivals, duty cancellation, transfer by other means, waiting at the scene, other), vital parameters (systolic and diastolic blood pressure, pulse, respiration rate, oxygen saturation, blood sugar, GCS), code status of cases (blue-red-yellow-green-black), trauma stabilization (cervical collar, backboard, vacuum stretcher... etc), applied procedures {Electrocardiography (ECG), aspiration, intravenous (IV)treatment, inhalation therapy, cardiopulmonary resuscitation (CPR), defibrillation, cardio version}, materials and medicines used.
During the study of 112 emergency health care teams to the patient and pre-hospital health services, the quality of patient transportation were investigated in July 2015-July 2016 in Istanbul. The analysis distributions of the study are planned as follows;
- Distribution of cases by months
- Distribution of cases by gender
- Distribution of cases according to hours
- Distribution of cases according to age group
- Ambulance access times
- Ambulance stay
- Duration of ambulance access to hospital
- Analysis of diseases according to pre-diagnoses
- Distribution of cases according to the reasons of the call
- Distribution of cases according to triage code groups
- Distribution of patients evaluated for vital parameters
- Distribution of patients in need of intervention and intervention
- Distribution of patients receiving IV-IM (Intramuscular) treatment
- Distribution of patients with advanced cardiac life support
- Crime scene electrocardiography withdrawal distribution
- Distribution of trauma vest use
- Distribution of servicalcollar use
STATISTICS
Mean, Median, standard deviation, frequency and ratio values were used in descriptive statistics of the data. In the analysis of qualitative independent data, “chi-square test” was done. SPSS 22.0 program was used in the analysis. Between July 2015 and July 2016, a total of 9100 patients were admitted to the emergency department via ambulance (including special ambulances) except for pediatric and pregnant patients (including traumatic pregnant and pediatric patients).
Total Patients admitted to the emergency department by ambulance
Patients who came to the emergency department by ambulance between July 2015 and July 2016 were examined; the distribution of 9100 patients admitted by months is shown in table 1.
|
Month |
January |
February |
March |
April |
May |
June |
July |
August |
September |
October |
November |
December |
|
Percentage % |
10.5 |
7.2 |
11.6 |
10.5 |
11.9 |
11.6 |
8.2 |
4.3 |
4.1 |
4.6 |
6.7 |
8.6 |
Table 1: Patient Distribution by Months.
When the distribution of the patients according to the seasons was examined, it was found that the most applications were in the spring months. During this period, the most cases were found in May (11.9%) (Figure 1).
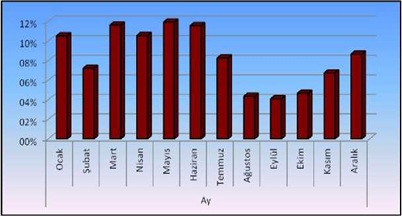 Figure 1: Distribution of patients by months.
Distribution of cases by gender
When the cases were examined by gender, it was found that the majority of them are male 51.4%. Gender distribution percentages are given in figure 2.
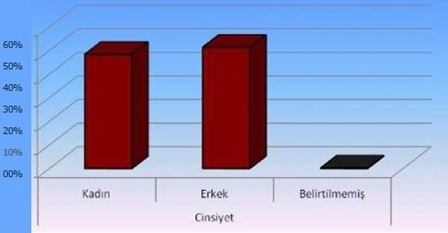 Figure 2: Distribution of cases by gender.
Distribution of cases by age
When the distribution of cases by age was examined, it was found that ambulances mostly served patients between 80-89 years (20.9%). The distribution of cases according to age groups is presented below (Table 2) and figure 3.
|
Age |
17-19 |
20-29 |
30-39 |
40-49 |
50-59 |
60-69 |
70-79 |
80-89 |
90-? |
Uncertain |
|
No. of People |
294 |
1202 |
896 |
834 |
814 |
953 |
1400 |
1903 |
378 |
427 |
|
Percentage % |
3.2 |
13.2 |
9.8 |
9.2 |
8.9 |
10.5 |
15.4 |
20.9 |
4.2 |
4.7 |
Table 2: Distribution of Cases by Age Groups.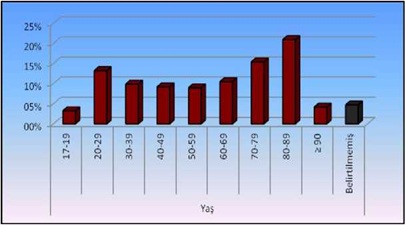 Figure 3: Distribution of cases by age.
Time to reach ambulances
Ambulances reach on an average of 7.8 minutes after call reaches the center from the scene. These time vary according to the distance of the transportation, place to the command and control center and the average distribution of the transportation time is given in table 3 and figure 4.
|
Duration (min) |
0-4 |
5.Eyl |
Eki.14 |
15-19 |
20-24 |
25-29 |
30-34 |
35-39 |
> 40 |
Uncertain |
|
Number of People |
2623 |
2820 |
910 |
256 |
45 |
43 |
11 |
9 |
31 |
2353 |
|
Percentage % |
28.8 |
31 |
10 |
2.8 |
0.5 |
0.5 |
0.1 |
0.1 |
0.3 |
25.9 |
Table 3: Average Distribution of Access Time.
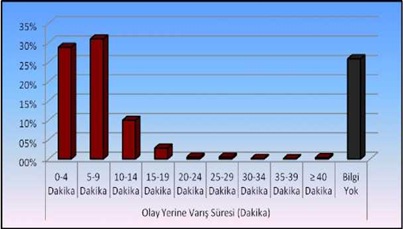 Figure 4: Distribution of cases by age.
Time to reach ambulances and transportation to the hospital
The average residence time of the ambulances after the arrival of the case is 13. 29 and is given in table 4. The average time to reach the hospital is 7.8 and their distribution is given in table 5 and (Figures 5 and 6).
|
Duration (min) |
0-4 |
5.Eyl |
Eki.14 |
15-19 |
20-24 |
25-29 |
30-34 |
35-39 |
> 40 |
Uncertain |
|
Number of People |
645 |
1509 |
1509 |
981 |
380 |
105 |
52 |
51 |
61 |
3808 |
|
Percentage % |
7.1 |
16.6 |
16.6 |
10.8 |
4.2 |
1.2 |
0.6 |
0.6 |
0.7 |
41.8 |
Table 4: Breakdown of on-site stay time.
|
Duration (min) |
No. of People |
Percentage % |
|
0-4 |
1540 |
16.9 |
|
5-9 |
2003 |
22 |
|
10-14 |
951 |
10.4 |
|
15-19 |
520 |
5.7 |
|
20-24 |
200 |
2.2 |
|
25-29 |
100 |
1.1 |
|
30-34 |
21 |
0.2 |
|
35-39 |
1 |
0 |
|
> 40 |
23 |
0.3 |
|
Uncertain |
3742 |
41.1 |
Table 5: Breakdown of Arrival Time.
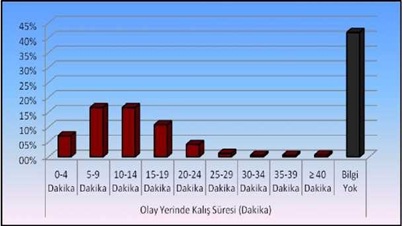 Figure 5: Duration of the scene.
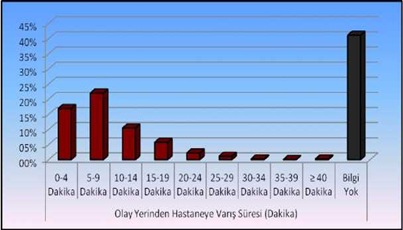 Figure 6: Duration of arrival from the scene to the hospital.
Distribution of ambulances according to hours
It was found that 48.9% of the ambulances had the highest number of visits between 08-18 hours and 17.9% between 00-08 figure 7. The distribution of ambulances according to application is given in table 6. However, the distribution of the notification times of the cases to 112 call centers is given in table 7.
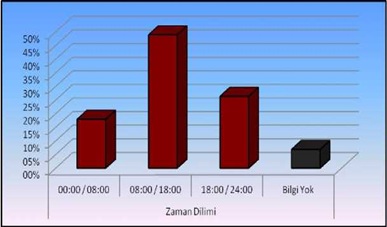 Figure 7: Percentage % of distribution of applications for ambulances.
|
Time Period |
00:00-08:00 |
08:00-18:00 |
18:00-24:00 |
Uncertain |
|
No. Of Patients |
1631 |
4452 |
2397 |
621 |
|
Percentage % |
17.9 |
48.9 |
26.3 |
6.8 |
Table 6. Distribution of ambulances by application hours.
|
Call Duration |
Number of Calls |
Percentage % |
|
00:00-01:00 |
312 |
3.4 |
|
01:00-02:00 |
268 |
2.9 |
|
02:00-03:00 |
229 |
2.5 |
|
03:00-04:00 |
209 |
2.3 |
|
04:00-05:00 |
202 |
2.2 |
|
05:00-06:00 |
134 |
1.5 |
|
06:00-07:00 |
114 |
1.3 |
|
07:00-08:00 |
163 |
1.8 |
|
08:00-09:00 |
277 |
3.0 |
|
09:00-10:00 |
432 |
4.7 |
|
10:00-11:00 |
432 |
4.7 |
|
11:00-12:00 |
447 |
4.9 |
|
12:00-13:00 |
537 |
5.9 |
|
13:00-14:00 |
417 |
4.6 |
|
14:00-15:00 |
485 |
5.3 |
|
15:00-16:00 |
533 |
5.9 |
|
16:00-17:00 |
438 |
4.8 |
|
17:00-18:00 |
454 |
5.0 |
|
18:00-19:00 |
441 |
4.8 |
|
19:00-20:00 |
416 |
4.6 |
|
20:00-21:00 |
389 |
4.3 |
|
21:00-22:00 |
399 |
4.4 |
|
22:00-23:00 |
392 |
4.3 |
|
23:00-00:00 |
360 |
4.0 |
|
Uncertaain |
621 |
6.8 |
Table 7: Distribution of call center call hours.
Analysis of casesby call reasons
During the 1-year period, 66.2% of the cases with medical reasons were the most common cause of call. The distribution of the reasons for the call is presented in table 8.
|
Call Reason |
Number of Calls |
Percentage % |
|
Medical |
6021 |
66.2 |
|
Traffic accident |
1037 |
11.4 |
|
Fall |
855 |
9.4 |
|
Drill-Cutter Injury |
97 |
1.1 |
|
Alcohol-Drug Purchase |
94 |
1.0 |
|
Work accident |
77 |
0.8 |
|
Blunt Trauma |
71 |
0.8 |
|
Suicide |
44 |
0.5 |
|
Darpa |
44 |
0.5 |
|
Other Accidents |
18 |
0.2 |
|
Chemical |
12 |
0.1 |
|
Fire |
9 |
0.1 |
|
Firearm Injury |
6 |
0.1 |
|
Electric shock |
2 |
0 |
|
Suffocation |
1 |
0 |
|
Allergy |
1 |
0 |
|
Unspecified |
712 |
7.8 |
Table 8: Distribution by Reason of Call.
Analysis of cases according to preliminary diagnosis
When the analysis of the cases according to preliminary diagnosis was examined, the largest patient group consisted of minor trauma 13.8%. Respiratory distress (7.4%) and syncope (6.2%) were followed by this group. The analysis of the cases according to the preliminary diagnosis is presented in table 9.
|
Call Reason |
Number of Calls |
Percentage % |
Call Reason |
Number of Calls |
Percentage % |
|
Minor Trauma |
1258 |
13.8 |
Intoxication |
40 |
0.8 |
|
Dyspnea |
671 |
7.4 |
Arrest Case |
37 |
0.4 |
|
Syncope |
564 |
6.2 |
Alcohol intake |
36 |
0.4 |
|
Stroke |
550 |
6.0 |
Arrhythmia |
33 |
0.4 |
|
Head Trauma |
537 |
5.9 |
Tachycardia |
24 |
0.3 |
|
General Condition Disorder |
337 |
3.7 |
Agitation |
23 |
0.3 |
|
Geriatric Patient |
325 |
3.6 |
Myocardial Infection |
22 |
0.2 |
|
Hypertension |
282 |
3.1 |
Liver failure |
22 |
0.2 |
|
Nausea |
263 |
2.9 |
Chronic renal failure |
18 |
0.2 |
|
Chest Pain |
226 |
2.5 |
Drug Allergy |
18 |
0.2 |
|
Soft Tissue Trauma |
202 |
2.2 |
Dizziness |
17 |
0.2 |
|
Hypotension |
200 |
2.2 |
Back ache |
16 |
0.2 |
|
VOTA (Vehicle Outdoor Traffic Accident) |
179 |
2.0 |
Urological Malignancy |
14 |
0.2 |
|
Epileptic Attack |
158 |
1.7 |
Heart failure |
11 |
0.1 |
|
Gastroenteritis |
158 |
1.7 |
Cirrhosis |
10 |
0.1 |
|
VITA (Vehicle Interior Traffic Accident) |
154 |
1.7 |
Acute Bronchitis |
9 |
0.1 |
|
Article Purchase |
150 |
1.6 |
Diabetic Patient |
7 |
0.1 |
|
GIS (Gastrointestinal System)Bleeding |
145 |
1.6 |
Neurological Emergency |
7 |
0.1 |
|
Abdominal Pain |
141 |
1.5 |
CO (Carbon monoxide) intoxication |
5 |
0.1 |
|
Vertigo |
112 |
1.2 |
Pulmonary Edema |
4 |
0 |
|
COPD (Chronic Obstructive Pulmonary Disease) Attack |
110 |
1.2 |
Probe Change |
4 |
0 |
|
Hyperglycemia |
79 |
0.9 |
Food Intoxication |
3 |
0 |
|
Alcohol Coma |
75 |
1.2 |
Cancer |
2 |
0 |
|
Infection |
71 |
0.8 |
Gynecologic Malignancy |
2 |
0 |
|
Suicide |
66 |
0.7 |
Asthma |
1 |
0 |
|
Pounding |
61 |
0.7 |
Atrial fibrilation |
1 |
0 |
|
Drug Intoxication |
57 |
0.6 |
Uvula Edema |
1 |
0 |
|
Lung CA (cancer) |
55 |
0.6 |
Unspecified |
1481 |
16.3 |
|
Hypoglycemia |
46 |
0.5 |
|
|
|
Table 9: Distribution of Analysis of Cases According to Preliminary Diagnosis.
Distribution of cases by circulation code groups
When the distribution of the patients who were brought to the emergency department by ambulance was examined according to the urgency, the yellow code group was the most common group with 8.0% and the triage code group of 80.7% of the patients was not specified. Distribution by groups is presented in table 10 and figure 8.
|
Availability |
Number of Codes |
Percentage % |
|
Red Code |
517 |
5.7 |
|
Yellow Code |
725 |
8.0 |
|
Green Code |
507 |
5.6 |
|
Social Indication |
8 |
0.1 |
|
Unspecified |
7344 |
80.7 |
Table 10: Distribution of cases according to triage code groups.
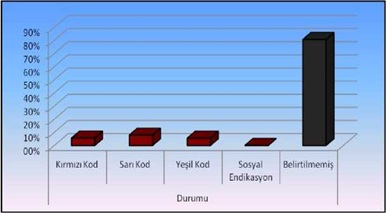 Figure 8: Percentage of distribution of cases according to distribution Codes.
Distribution of cases according to evaluation of vital parameters
In the initial evaluation of the patients who were brought to the emergency department, the patient's parameters such as blood pressure arterial (systolic-diastolic), pulse (pulse / min), respiratory rate, fever, oxygen saturation, electrocardiography should be measured. Accordingly, the average values of the parameters are given in table 11. However, in the first evaluation of the patients with rapid examination, the pupil reflex and skin findings were determined by the health professionals and related to this are given in tables 12 and 13. The distributions of the first examination findings are shown in figures 9 and 10.
|
Vital Parameter |
Value range |
Median |
Mean ± Standard Deviation |
|
Systolic Blood Pressure |
0 - 280 |
120 |
124.9 ± 26.7 |
|
Diastolic Blood Pressure |
0 - 150 |
80 |
74.7 ± 15.1 |
|
Pulse |
0 - 256 |
84 |
87.6 ± 19.4 |
|
Respiratory |
0 - 32 |
17 |
17.7 ± 8.2 |
|
SPO2 |
0 - 100 |
97 |
83.8 ± 9.3 |
|
GCS |
3 - 15 |
13 |
13.2 ± 1.2 |
Table 11: Average Values of Evaluations of Vital Parameters.
SPO2: Saturation of peripheral oxygen
|
Pupillary Finding |
Number of patients |
Percentage % |
|
Normal |
6772 |
74.4 |
|
Meiotic |
113 |
1.2 |
|
Fiks Dilate |
37 |
0.4 |
|
Anisocoric |
31 |
0.3 |
|
Mydriatic |
12 |
0.1 |
|
No Reaction |
2 |
0.0 |
|
Unspecified |
2134 |
23.4 |
Table 12: Pupillary examination findings.
|
Skin Findings |
Number of patients |
Percentage % |
|
Normal |
5906 |
64.9 |
|
Pale |
811 |
8.9 |
|
Sweaty |
117 |
1.3 |
|
Cyanotic |
83 |
0.9 |
|
Hyperemic |
31 |
0.3 |
|
Icteric |
2 |
0.0 |
|
Unspecified |
2151 |
23.6 |
Table 13: Skin examination findings.
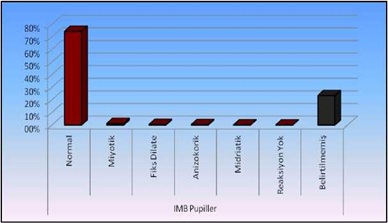 Figure 9: Distribution of pupillering appearance in initial examination findings.
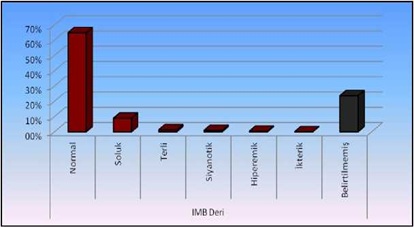 Figure 10: Distribution of leather findings in initial examination findings.
Distribution of ?ntervened and ?nterventional patients
The distribution of the ambulance's procedures (trauma stabilization, cervical collar, trauma board, vacuum stretcher application, blood sugar measurement, transcutaneous pO2 measurement, oxygen inhalation), which should be applied at the first sight of the patient, is presented in table 14.
|
|
Number of patients |
||
|
Intervention (Y/N) |
Y |
N |
Unspecified |
|
Cervical Collar |
919 (%10.1) |
7 (%0.1) |
8175 (%89.8) |
|
Backboard |
172 (%1.9) |
2 (%0.0) |
8927 (%98.1) |
|
Trauma Vest |
43 (%0.8) |
7 (%0.1) |
9051 (%99.5) |
|
Vacuum Stretcher |
70 (%0.8) |
6 (%0.1) |
9025 (%99.2) |
|
ECG |
1302 (%14.3) |
19 (%0.2) |
7780 (%85.5) |
|
Blood sugar |
1887 (%20.7) |
10 (%0.1) |
7204 (%79.2) |
|
Oxygen Therapy |
972 (%10.7) |
8 (%0.1) |
8121 (%89.2) |
|
Transcutaneous pO2 |
2882 (%31.6) |
9 (%0.1) |
6220 (%68.3) |
Table 14: Distribution of intervened and interventional patients
pO2: Partial pressure of Oxygen
Y: Yes
N: No
Distribution of cases according to intravenous-intramuscular treatment
Table 15 presents the distribution of intravenous and intramuscular treatments administered to the emergency department by ambulance according to the patient's condition. However, the frequency of administration of the drugs used is indicated below.
|
|
Number of patients |
||
|
Treatment (Y/N) |
Y |
N |
Unspecified |
|
IV drug treatment. |
208 (%2.3) |
7 (%0.1) |
8886 (%97.6) |
|
Vascular access |
7006 (%77.0) |
37 (%0.4) |
2058 (%22.6) |
|
Adrenalin 1 mg |
40 (%0.4) |
1 (%0.0) |
9095 (%99.6) |
|
Atropine 0.5 mg |
4 (%0.0) |
2 (%0.0) |
9095 (%99.9) |
|
Atropine 1 mg |
2 (%0.0) |
1 (%0.0) |
9098 (%99.9) |
|
NaCl 0.9% 500cc |
55 (%0.6) |
2 (%0.0) |
9044 (%99.4) |
|
Dekortamp |
5 (%0.1) |
1 (%0.0) |
9095 (%99.9) |
|
Avilamp |
5 (%0.1) |
1 (%0.0) |
9095 (%99.9) |
|
IV Injection |
39 (% 0.4) |
6 (%0.1) |
9056 (%99.5) |
|
IM Injection |
6 (%0.1) |
6 (%0.1) |
9089 (%99.8) |
Table 15: Distribution of Intravenous or Intramuscular Therapy Patients.
Y: Yes
N: No
Distribution of cases according to advanced cardiac life support
Advanced cardiac life applications, which constitute perhaps the most important group in terms of the emergency department and where on-site intervention sometimes plays a more important role than hospital intervention, are very important in patient's mortality and morbidity. Table 16 presents the distribution of patients in need of advanced cardiac life support (intubation, cardiopulmonary resuscitation, defibrillation, airway support.
|
|
Number of patients |
||
|
Treatment (Y/N) |
Y |
N |
Unspecified |
|
CPR |
120 (%1.3) |
7 (%0.1) |
8974 (%98.6) |
|
Intubation |
87 (%1.0) |
7 (%0.1) |
9007 (%99.0) |
|
Vascular access |
7006 (%77.0) |
37 (%0.4) |
2058 (%22.6) |
|
Defibrillation |
6 (%0.1) |
7 (%0.1) |
9088 (%99.9) |
|
O2 treatment |
972 (%10.7) |
8 (%0.1) |
8121 (%89.2) |
Table 16: Distribution by Advanced Cardiac Life Support Practice.
Y: Yes
N: No
Distribution of electrocardiography (ECG)
According to the analysis of the ambulance; ECG withdrawal rate in respiratory group-breathlessness was significantly higher than non-respiratory group-breathlessness (p <0.05). Angina Pectoris-Chest Pain in the group with an ECG rate Angina Pectoris-Chest Pain with no group was meaningful (p <0.05) is higher. ECG withdrawalorcardiacarrhythmia in the cardiac group is significantly higher (p <0.05). ECG withdrawal rate in the tachycardia group was significantly higher than that of the group (p <0.05). The rate of ECG withdrawal in myocardial infarction group is higher than that of myocardial infarction group (p <0.05). The ECG withdrawal rate in the group with and without heart failure did not differ significantly (p> 0.05) (Table 17).
|
|
ECG (Y/N) |
P Value |
|
|
Clinic |
Y |
N |
|
|
Respiratory Distress |
158 (%23.5) |
513 (%76.5) |
0,000 x2 |
|
Chest Pain |
104 (%46.0) |
122 (%54.0) |
0,000 x2 |
|
Arrhythmia |
23 (%69.7) |
10 (%30.3) |
0,000 x2 |
|
Tachycardia |
12 (%50.0) |
12 (%50.0) |
0,000 x2 |
|
Myocardial infarction |
13 (%59.1) |
9 (%40.9) |
0,000 x2 |
|
Heart failure |
1 (%9.1) |
10 (%90.9) |
0,000 x2 |
Table 17: Distribution of ECG Percentage by Clinical Findings.
Y: Yes
N: No
X2: Chi-Square test
Distribution of trauma vest use percentage
Patients with pre-diagnosis of trauma; no significant difference (p> 0.05). The rate of use of anVITA group was significantly higher (p <0.05). The rate of use of VOTA was significantly higher than that of VOTA (p <0.05). (Table 18).
|
|
Trauma Vest (Y/N) |
P Value |
|
|
Clinic |
Y |
N |
|
|
Head Trauma |
4 (%0.7) |
533 (%99.3) |
0.532 |
|
VITA |
10 (%6.5) |
144 (%93.5) |
0,000 x2 |
|
VOTA |
6 (%3.4) |
8885 (%99.6) |
0,000 x2 |
Table 18: Distribution of trauma vest use percentages by clinical findings.Y: Yes
N: No
X2: Chi-Square test
VITA: Vehicle Interior Traffic Accident
VOTA: Vehicle Outdoor Traffic Accident
Distribution of cervical collar usage percentage
In the case of VITA, the ratio of Cervical Collar Application is higher than non-VITA group (p <0.05). In the case of VITA, the ratio of Cervical Collar Application is higher than non-VITA group (p <0.05). The ratio of Cervical Collar Application to VOTA was higher than that of non-VOTA (p <0.05) (Table 19).
|
|
Trauma Vest(Y/N) |
P Value |
|
|
Clinic |
Y |
N |
|
|
Head Trauma |
197 (%31.1) |
370 (%68.9) |
0,000 x2 |
|
VITA |
97 (%63.0) |
57 (%37.0) |
0,000 x2 |
|
VOTA |
132 (%73.7) |
47 (%26.3) |
0,000 x2 |
Table 19: Distribution of cervical collar usage percentages by clinical findings.
Y: Yes
N: No
X2Chi-Square test
VITA: Vehicle Interior Traffic Accident
VOTA: Vehicle Outdoor Traffic Accident
DISCUSSION AND CONCLUSION
In Istanbul, where the patient population is quite high, in recent years, the ambulance usage rate has been gradually increasing. In this study, except for the patients and children (including the trauma patients), the emergency forms of the patients who were brought to the emergency department by ambulance were examined in detail. According to the information obtained from Istanbul Public Hospitals Association, a total of 214 stations are available in Istanbul, of which 89 are on the Anatolian side, 125 of them are in Europe. According to Article 11 /A of the Ambulance Station, the emergency services shall be established like 1 station for a population of 50,000. The number of calls received from each direction is 10 minutes in order to make available to public easily the places to be reached must be reconstructed, and particularly in the case of geography. Göztepe Training & Research Hospital is located inKad?köy district of ?stanbul province where a total of 10 ambulances are available in the Kad?köy region, of these 8 are located nearby. There are 2 near the hospital and 2 local train stations BarbarosMahalles.
In our study, according to the information given by the Public Hospitals Association, ambulances collected 665509 number of cases in Istanbul till July-2016 of 15926 cases are to Göztepe Education and Research Hospital (adult emergency service, pediatric emergency service, gynecology emergency service and medical clinic) 9100 patients were included in the study. However, in total 1,864,481 patients have applied to the various units of the hospital in accordance with the data obtained from the statistics of Education and Research Hospital. Approximately 22.4% of 418,508 patients in the emergency department were admitted to the emergency department. The number of patients admitted to the emergency department with ambulance is approximately 3.73% of the total number of patients and this corresponds to a total of 15926 patients. In the studies carried out in Europe, the use of emergency health services has been increased over the years. In a 2006 study conducted in the UK shown that the ambulance calls between 1997 and 2002 were compared with each year and shown significant increase [3]. In a study conducted by Niska et al., The ambulance service is recommended in our country for public education level of 15.5% in 2007 [4]. Ambulance Service includes expectations, national income level, whether the economic situation and health assurance of patients are determining factors [5].
Considering the growth of population in Turkey's largest city Istanbul, it is predicted that the number of applications will gradually increase and appropriate measures should be taken. In recent years, especially in metropolitan municipality provinces, ambulance services have seen significant improvements, but the rates of ambulance use in Turkey are far behind the developed countries. The study conducted on Kidak and his friends in Izmir province, they used 112 services in cold (27%) and in winter (24%) [6], this data supports the use of 112 health services in our country, usually in the summer months. However, similar studies in our country have found very different results. Göztepe education and research hospital has shown that the application to the emergency service entrance by ambulance are more in May compared to other months. Hanakives' colleagues conducted an interview in Kyoto city with 25.9% of the most frequently used ambulance service [7].
Unnecessary calls to call centers constitute a serious obstacle to the transportation to the patient. In our country, it shows that the majority of calls made to Crisis Command Centre are made for non-medical reasons. The data obtained in domestic studies support that emergency health services are not used for the intended purposes. In Canada, USA, Sweden and UK 40-50% of total ambulance usage has been reported to be inappropriate [8]. In the study of Snooks and his colleagues, it was reported that the high rate of discharge from the emergency service are brought to the hospital by ambulances [9]. Kawakami and his friends in Japan's Yokohama had conducted study in the city and shown the effect of socioeconomic factors on calls for medically unnecessary ambulances. In 2004, it was determined that 60% of the total ambulance calls in Yokohama were discharged from the emergency room without being admitted to the hospital. The results of this study are socioeconomic factors that influence the decision to call ambulances and in the same study, it was reported that sex, age, ownership of vehicles, living alone were factors that influence ambulance calling [10].
Therefore it should be eradicated to cutoff the misuse of emergency ambulance services. The improper use of ambulances increases the workload of 112 command centers and emergency services, as well as the country's economy [5]. In emergencies, the ambulance at the nearest scene should be in service and the ambulance shall be deployed further away from the airport and therefore the access to the case is extended [11]. Unsubstantiated information may result in misuse use of emergency ambulance services. In 2014, the law penalized 112 emergency ambulance services for unfounded information (112 Emergency Chariot Centers Associations, Duty and Labor Regulation). Thus, the unfounded numbers are minimized and unnecessary use of 112 emergency services is controlled. According to information from the Istanbul Public Hospitals Association, 0.44% is unlocated.
In this study, where patients usage ofemergency health services were examined according to gender and it was found that male patients were more likely to apply by i.e51.4%. However, studies conducted in our country have shown similar results, but they often show that male uses 112 health services more than the female. In the first half of 2013, kapci and her friends found that 55% of cases with use ambulances to the emergency service were from male patients [12].In a study conducted it was determined that the male patients use of emergency health services was high in the eight months study, where Olia and her friends investigated cases transported by ambulance to the emergency service in Italy, it was determined that 53.5% of the searches were from male patients [13]. In the study of Kawakami and his colleagues, it was determined that male cases tended to call more ambulances then women [10]. In the study of his colleagues in Izmir, it was determined that 53% of the total number of applications were female, 39%male and 8% others [6]. Niska and her colleagues conducted a 2007 study that found that 55% of patients are women who uses the ambulance services for medical emergency [4].
Age groups were examined when the age distribution of cases in the study was examined; 17-19 years, 20-29 years, 30-39 years, 40-49 years, 50-59 years, 60-69 years, 70-79 years, 80-89 years, 90 and above. The age group who used the 112 emergency health services is mainly between 80-89 years (20.9%). However, the 17-19 age groups (3.2%) are the minimum applicants. In the study of Kawakami and his colleagues, it was reported that one of the most important factors affecting the use of ambulances was age. It was found that the decision to call ambulances in the elders is easier [10]. In the study of his colleagues, it was stated that in 2004-2005, a quarter of the total applications (26.7%) were elderly people over the age of 65 [6]. Victor and his colleagues found that 40% of the calls were made to London ambulance by age group of 60 and over [14]. According to these studies, 112 ambulance service demands of patients increased due chronic diseases as a result the progression of age [15]. Age is an important factor for urgent medical system, emergencies such as hypertension, CAD, COPD, neurovascular disease and trauma, which require ambulance use, increase as they progress [16], similar results have also been observed in other studies. In Hong Kong study of Lai and his colleagues, 45.64 % of the patients who applied for ambulance emergency services were aged between 0-64 [17].
The time to reach the emergency services unit of the pre-hospital care is very important and correct patient's access to the center directly affects the patient's quality of life. Ensuring the correct coordination within the emergency medical system should be the important objective of ensuring that patients reach the relevant center in time. 112 health systems and public hospitals have to work in coordination with emergency services, intensive care units, stroke units, angiography centers, and this must be provided from a single center. Patient’s overtime has been reported by the American Heart Association as eight for future cardiac support ambulances [15]. Experts have informed that 20% of those who have lost their lives with the quality, quality, accurate, speed-provided emergency assistance services may be able to recover [18]. In this study, it was determined that 31.0% of the cases (2820 cases) were reached in 5-9 minutes. In the study conducted by Altintas and his colleagues in Ankara, ambulances reached 15% under the duration of transportation time to the Emergency care [19]. Breen and his colleagues conducted a study in Ireland that reached 42% of cases in less than 3 minutes [20]. Lieberman and his colleagues found an average of 9.8 in Montreal [21]. Similarly, Lecky and his colleagues found 7.8 on average in Manchester [21]. Cameron and his friends had access to the case at 18.7 in the Victoria [21]. In the literature, studies on average ambulance arrival times vary widely country by country. Ong and his colleagues conducted a study in Singapore with an average arrival time of 8 [22].
Breen and his colleagues described ambulance response time in Ireland, 38% of cases in a 1-week period, the response time was below 9, 44% of urban cases it was below 15 and 81%of rural cases it was below 20 [20]. Campbell and his colleagues reported response time of 8.2 in the United States [23]. In the study of stoykovave friends, the response time was 80% for 50% of emergency calls in 1996, compared to 75% in 2001 [24]. When the distribution of the cases to the relevant center was examined, it was determined that an average of 22% of cases reached the emergency service by ambulance within 5-9 minutes. In a total of 2003 patients, the ambulance was transported to the hospital within 5-9 minutes.
The duration of transportation of ambulances in Istanbul; considering that traffic is effective in the density of the settlement and the social factors, it is observed that ambulances have a near-duration of access to cases in developed countries. In this study, the length of stay of ambulances at the site was examined and the rates were approximately 16.6% and 5-9 min to 10-14 min. In a study by Cameron and his colleagues in Victoria, they took the patient from the scene and delivered it to the relevant health center at an average of 22.9 [21]. Lecky and his colleagues in Manchester at 15.8, Lieberman and his colleagues in Montreal found that the duration was 10.8 [21].
One of the most important components of ambulance services is time. In cases requiring thrombolytic treatment and emergency surgery [25]. Continuous modernization efforts are under way with the current technical infrastructure of the General Directorate of Emergency Health Services of the Ministry of Health for the shortening of the time of the emergency medical team's incidental access. Dissemination of air, sea and motorized emergency health services, installation of vehicle satellite access systems, rapid detection of the location of the case, thanks to the integrated system with mobile communication devices, and the nearest emergency health service the duration of the transport to the case is further shortened by directing the intermediary [25]. It is foreseen that in cities such as Istanbul, where traffic congestion has reached serious proportions, it is foreseen that the length of transportation time of cases to the hospital will be reduced by increasing the awareness of the community and acting within the rules in traffic.
During the study, it was determined that patients who were brought to the emergency department of Göztepe Education and Research Hospital were able to find 112 emergency medical services very frequently (66.2%). This is followed by traffic accident (11.4%) and fall (9.4%), respectively. Across Turkey, ambulance calls (67.3%) are reported to be more medical reasons and 14.9% are involved in traffic accident-related calls [26]. However, according to data from the Association of Public Hospitals in Istanbul, 83% of the reason for calling all cases throughout Istanbul is medical cases, followed by traffic accidents with 7%. As a result of his colleagues' work in Izmir province, the most common causes of emergency calls were medical emergency (69.5%) and traffic accidents (14.2%) [6].
All these results support that 112 emergency health services are generally sought in our country due to medical cases. Similar results have been obtained in studies abroad. Olia and her colleagues conducted a study in Italy that 46% of ambulance calls were non-traumatic causes and 17% were cases of trauma. Dyspnea (16.7%), loss of consciousness (16.6%) and chest pain (11.8%) are the most common cause of non-traumatic causes (62.6%) [13].
When the cases were analyzed according to their prescribed diagnosis, it was determined that the largest group of patients in our study was the neural trauma group. The total number of cases presenting with the diagnosis of minor trauma were 13.8%. This was followed by 7.4% vesyncop with 6.2%. General Directorate of Basic Health Services Working Yearbook 2006, 25.7% emergency vaka prescribers were turkey ranks first, CVS diseases are with 19.5% [26], according to information from the Association of Public Hospitals in Istanbul, cardiovascular disease were 10%. In the same year, trauma (24.3%), cardiovascular diseases (20.6%) and neurological diseases (10.7%) were the most common causes among the prescribed diagnoses throughout Izmir (General Directorate of Health, Basic Health Service, 2007).Some studies on 112 health services in our country have shown that non-traumatic causes are more common in prescribed diagnoses. In the study of his friends in Izmir, approximately 1/5 (20%) of the prescribed diagnoses diagnosed by the ambulance team were cardiovascular, 1/6 (16%) were respiratory diseases and trauma-related diseases were in third place (11.5%). In approximately 25% of cases, no witnesses were collected by the team or no classification could be made [6]. Hanakive and friends conducted a study on the applicants with 48.5% medical diseases, of which 18.5% are anti-traumatic group [7].
In the study of Horibataves in Osaka, 28.8% of the most common causes of the stroke were traumas, while 15.8% were in an undiagnosed group [27]. In Danish studies conducted by Christensen and his colleagues, 30% of the prescribed diagnoses were trauma group, followed by 10.6% cardiovascular system [28].
The study did not include patients left at the ambulance transport site and patients who applied to the emergency room. The study was evaluated only by patients who applied to the emergency service because the evaluation form of the cases were not transferred to the hospital did not reach us. In the study of the Calist and his friends, it was reported that the majority of the cases resulted in hospitalization [12]. In the study conducted by his friends in Izmir, it was determined that 52% of the cases resulted in hospital transfer and 19% were on-site interventions [6]. The majority of emergency calls for ambulance services in England do not result in carrying patients to the hospital [29], 17% of patients in England and Wales were not transported to hospital after an emergency ambulance call [29]. In the study of Hip skind and his colleagues, 30% of ambulance responses in the United States resulted in patients' rejection of transport, and these patients were mostly asymptomatic patients between the ages of 11 and 40 who met accidents [30]. Us study reported that 7 out of 10 patients were transported to similar hospital [31]. When we evaluate the results of all these studies, we see that it is a global problem that the majority of cases have been transported to the hospital and that the majority of the patients brought to the hospital are discharged from emergency services. In our country, global studies should be carried out to reduce the use of unnecessary ambulances and health policies should be developed according to the results.
In a recent study, it was concluded that 48.9% of the cases had most applications between 08-18 hours and the minimum application were between 17.6% and 00-08. In the study of his friends in Hanakive, 44.8% of the cases were admitted between 8-15 hours and 36.3% between 16-23 [7]. Considering that emergency services are dynamic field, health workers should have high-level motivation all the time. Health workers should be more careful, especially in patients who have been on duty in the last hours of their shifts and in the morning. Given that the application for daytime cases to the emergency department of our hospital is more frequent, it is necessary to ensure and prepare the adequate personnel and the equipment of the emergency room. However, although 00-08 hours are the hours when the application is low, it should be especially considered in terms of the frequent cases that may associate with chest pain.
In the study, green, yellow, red and black code classifications of patients who applied to the emergency service were determined according to the evaluation of the case of ambulance crews. Approximately 80.7% of patients who contacted the emergency services through ambulances did not specify the co-group. This was evaluated as yellow code with a rate of 8.0%.
In the rapid care patients admitted to the emergency room and their vital findings are very important. Vitality provides faster decision-making of the patient and approaching the patient is the most important methods. The case should be assessed at the site itself before reaching the hospital; systolic and diastolic artery pressure (mmHg), respiratory count (/min), pulse (pulse/min), fever (°C), oxygen saturation (%), blood sugar (mg/dl), GCS, Electrocardiography is vital. However, the evaluation of the appearance of people and skin in the initial examination findings is also a marker. Approximately 74.4% of the patients were normal, 1.2% was myotic and 0.4% was dilated of the first examination findings by ambulance crews. In addition, 5906 patients (64.9%) had normal skin findings, 811 patients (8.9%) were pale and 117 patients (1.3%) were sweaty. When the initial evaluations for the correct diagnosis are made, it is determined that the patient is used in the place of pre-hospital care if it is reached directly to the center at the right time. In this study, the mean systolic blood pressure of patients admitted to the emergency service by ambulance was 124.9 ± 26.7 mmHg and diastolic blood pressure was measured as 74 ± 15.1 mmHg on average. Hypertensive crisis is rare in concerned evaluations, but patients are not preferred to administer through IV or oral antihypertensive drugs. The average values of the patients with pulse were 87.6 ± 19.4/min. Therefore, it has been observed that severe cases of bradycardia do not have very frequent applications and it is not specified how the measurement is made. The patients were evaluated at the event site and were found to be 13.3 on average. Electrocardiography was performed in approximately 14.3% of the 1302 patients. However, since the electrocardiography taken in ambulances was mostly 6 derivations, the applicants to the emergency service had this electrocardiography inadequate for us emergency medical doctors, but emergency medical workers working in ambulances are also incapable of recognizing the patient's possible cardiac problems. Therefore, the use of 12 skinned electrocardiography in ambulances should be widened and the knowledge of electrocardiography should be tediously used by ambulance stewards. This will increase the efficiency of patients at the right time in angiography centers. PaO2 was measured transcutaneously at the scene of 2872 patients (31.6%) and it was determined as an average of 92.8% ± 6.3. When GCS was evaluated, 12.3 ± 2.2 was determined as the average value. In the study of Cameron and his colleagues in Victoria, the average of GCS was evaluated and was found to be 11.9% [21]. In the study of Civil and his friends in Auckland, the event scene was evaluated in GCS and the average was 10.8% [21]. In our study, 1887 patients (20.7%) had blood sugar at the site. Interventions should be aimed at detecting contingency hypoglycemia or hyperglycemia, which should be aimed at preventing the patient from recovering from minimal damage. In the study of Toyoda and his friends in Ojoke, the event scene was first looked at and vital parameters were evaluated [32]. The Systolic blood pressure of 54.3% of the patients was determined to be around 140-149 mmHg. The value of 50.8% of the patients pulse measurement was 60-89 beats/min [32]. Lieberman and his colleagues conducted a Montreal study in which the average systolic arterial value of 17% of patients was estimated at 90 mmHg [21]. In a similar study conducted by Lecky and his colleagues in Manchester, the systolic arterial value of 12% of the patients was found to be 90 mmHg [21].
The approach of health workers encountered at the case site and the measures to be taken for patient stabilization are vital. First, ensuring the safety of the patient, then creating an appropriate and non-harming area of intervention should be the first measures. In order to achieve trauma stabilization, the case is positioned correctly, according to the condition of the case trauma, cervical collar and vacuum, must be made necessary interventions in conjunction. In this study, 1.9% of patients brought to the emergency service with trauma diagnosis were used in backpacks (172 patients in total), cervical collar in 10.1% (919 patients), 0.8% vacuums (only 70 patients), and 0.5% in approximately 43 patients. It is one of the most important steps in terms of the drug applications required after patients have intravenous pathway. In this study, approximately 77.0% of patients admitted to emergency services were intravenously administered; approximately 2.3% of patients (total 208) and intravenous drugs were administered. Most of these drugs were adrenaline (0.4%) and phenypramine (0.1%). In 1887 patients (20.7%) finger-tipping blood sugar was measured at the scene. Oxygen inhalation was applied to 10.7% of patients and 31.6% of the patients had transcutaneous pO2 levels with fingertip pulsoxitis. In the study of Toyoda and his colleagues, the values of 78.8% of patients in the measurement of transcutaneous pO2 values were identified as 95 [32].
One of the areas where the emergency room should be most effective is the group of patients who need advanced cardiac life support. After the intubation, cardiopulmonary resuscitation and necessary airline support applied to patients at the site of the ambulance crews should be delivered to the emergency service. During this time, it should be the aim to protect the patient from hypooxix and to minimize the mortality and mortality of morbidity. In this study, 87 patients (1%) were intubated and 120 patients (1.3%) had incidental cardiopulmonary resustation. In the study, only 6 patients (0.1%) were defibrillated. Looking at these results, it is not overlooked that the cases of crime scene are inconclusive.
LIMITATIONS OF THE STUDY
This study doesn’t include pregnant and pediatric patients (including trauma cases) and we didn't consider evaluating the cases of patients left at the scene. Employees of Göztepe Training and Research Hospital ?ali emergency service were included.
CONCLUSION
The emergency medical system should also be multidisciplinary. Every step of this system must be more valuable and functional than the previous one most importantly people involved with this system are health workers who aims to keep human life and life quality at an optimal level. The information that this is recorded by the lab employees and filed in the case form with the text will show the adequacy and the availability of the information. The first step of emergency health services is the critical step for the ambulance service system. Ambulance team’s first response is to ensure the patient's mortality and morbidity and the initial evaluation of the hospital, patient should be properly placed in the correct health board with correct interventions. The necessary socio-cultural and environmental measures should be taken for the ambulance to be used effectively. Any kind of distress encountered in the following intervene will cause loss of time, the public should be informed and the medical forms are kept sloppy. Therefore, we should evaluate the quality of the fast-moving texts and the emergency services. Priority for development and availability of all kinds’ of the Emergency services the ambulance tag must be kept up-to-date on the ability to give the training and approach to the patient. Complementary emergency health services and referral of patients to the hospital prior will prevent loss of time. In order to ensure critical patient care in our country, emergency services provide services to many patients outside of critical patient care.
REFERENCES
- Lilja G, Swor R (2004) Emergency medical services. In: Tintinalli J, Kelen G, Stapczynski J (eds.). Emergency medicine A comprehencive study guide, (5th edn). McGraw-HilL New York, USA.
- Heckman JD (1992) Emergency care and transportation of the sick and injured. Jones & Bartlett Learning, Massachusetts, USA.
- Peacock PJ, Peacock JL (2006) Emergency call work-load, deprivation and population density: An investigation into ambulance services across England. J Public Health (Oxf) 28: 111-115.
- Niska R, Bhuiya F, Xu J (2010) National hospital ambulatory medical care survey: 2007 emer?ency department summary. Natl Health Stat Report 26: 1-31.
- Ayten S (2015) Denizli in the 112 command center of the calls made and the evaluation of the use of emergency services. Pamukkale University, Pamukkale, Turkey.
- K?dak L, Keskinoglu P, Sofuoglu T, Ölmezo?lu Z (2009) ?zmir ?linde 112 Acil Ambulans hizmetlerinin kullan?m?n?n de?e Genel Tip Dergisi 19: 113-119.
- Hanaki N, Yamashita K, Kunisawa S, ?manaka Y (2016) Effect of the number of request calls on the time from call to hospital arrival: A cross-sectional study of an ambulance record database in Nara prefecture, Japan. BMJ open 6: 12194.7.
- Brown E, Sindelar J (1993) The emer?ent problem of ambulance misuse. Ann Emerg Med. 22: 646-650.
- Snooks H, Wri?ley H, Geor?e S, Thomas E, Smith H, et al. (1998) Appropriateness of use of emer?ency ambulances. J Accid Emerg Med 15: 212-215.
- Kawakami C, Ohshi?e K, Kubota K, Tochikubo O (2007) ?nfluence of socioeconomic factors on medically unnecessary ambulance calls. BMC Health Serv Res 7: 120.
- Yaylac? S, Y?lmazer Çelik S, Öztürk Cimilli T (2013) Retrospective evaluation of the urgency of patients admitted to the emergency department by ambulance. Acibadem University, ?stanbul, Turkey.
- Kapci M, Turkdo?an KA, Yi?it M, Akpinar O, Dumana A, et al. (2014) Demo?raphic data of 112 cases transported to the emer?ency medicine clinic. Journal of Experimental& Clinical Medicine
- Olia P, Mollica T, Querci A (2002) Ei?ht months of emer?ency services by ambulance (with doctor on board) of the Emer?ency Department of Prato, ?taly. Minerva anestesiologica 68: 849-852.
- Victor CR, Peacock JL, Chazot C, Walsh S, Holmes D (1999) Who calls 999 and why? A survey of the emer?ency workload of the London Ambulance Service. J Accid Emerg Med 16: 174-178.
- Zenginol M, Behçet Al, Genç S, Deveci ?, Yarbil P, et al. (2011) Gaziantep ?li 112 Acil Ambulanslar?n?n 3 Y?ll?k Çal??ma Sonuçlar?. Journal of Academic Emergency Medicine 10: 27.
- Schnittker J (2005) Chronic illness and depressive symptoms in late life. Social Science & Medicine 60: 13-23.
- Lai PC, Wong HT (2015) Weather and age-gender effects on the projection of future emergency ambulance demand in Hong Kong. Asia Pac J Public Health 27: 2542-2554.
- K?maz S, Soysal S, Çimrin AH, Günay T (2006) 112 Emergency Health Services Development of the Basic Advance , For Cardiac Asia Assessment and Developer's Administrative Subjects Assessment. Turkish Journal of Trauma & Emergency Surgery 12: 59-67.
- Altintas K, Bilir N (2001) Ambulance times of Ankara emergency aid and rescue services' ambulance system. Eur J Emerg Med 8: 43-50.
- Breen N, Woods J, Bury G, Murphy AW, Brazier H (2000) A national census of ambulance response times to emergency calls in ?reland. Journal of accident & emergency medicine 17: 392-395.
- Roudsari BS, Nathens AB, Arreola-Risa C, Cameron P, Civil ?, et al. (2007) Emergency Medical Service (EMS) systems in developed and developing countries. Injury 38: 1001-1013.
- Ong ME, Ng FS, Overton J, Yap S, Andresen D, et al. Geographic-time distribution of ambulance calls in Singapore: utility of geographic information system in ambulance deployment (CARE 3). Ann Acad Med Singapore. 38: 184-191.
- Campbell JP, Gridley TS, Muelleman RL (1997) Measuring response intervals in a system with a 911 primary and an emergency medical services secondary public safety answering point. Annals of emergency medicine 29: 492-496.
- Stoykova B, Dowie R, Bastow P, Rowsell K, Gregory R (2004) Ambulance emergency services for patients with coronary heart disease in Lancashire: achieving standards and improving performance. Emerg Med J 21: 99-104.
- Benli AR, Koyuncu M, Cesur Ö, Karakaya E, Cüre R, et al. 1Karabük University, Medical Faculty, Karabük, Turkey.
- Hizmetleri TSBTS (2007) General Directorate of Primary Health Care Services Yearbook 2006. 1. bask?. Ankara, Kuban Matbaac?l?k Yay?nc?l?k;p 13745.
- Horibata K, Takemura Y (2015) Inappropriate use of ambulance services by elderly patients with less ur?ent medical needs. Tohoku J Exp Med 235: 89-95.
- Christensen EF, Larsen TM, Jensen FB, Bendtsen MD, Hansen PA, et al. (2016) Dia?nosis and mortality in prehospital emer?ency patients transported to hospital: a population-based and re?istry-based cohort study. BMJ open 6: 11558.
- Marks P, Daniel T (2002) Emer?ency (999) calls to the ambulance service that do not result in the patient bein? transported to hospital: An epidemiolo?ical study. Emergency Medicine Journal 19: 449-452.
- Hipskind JE, Gren J, Barr D (1997) Patients who refuse transportation by ambulance: A case series. Prehosp Disaster Med 12: 45-50.
- Burt CW, Mc Cai? LF, Valverde RH (2006) Analysis of ambulance transports and diversions amon? US emer?ency departments. Ann Emerg Med 47: 317-326.
- Toyoda Y, Matsuo Y, Tanaka H, Fujiwara H, Takatori?e T, et al. (2007) Prehospital score for acute disease: a community-based observational study in Japan. BMC Emerg Med 7: 17.
Citation: Taskent I, Büyüksütçü C (2020) Evaluation of the Patients Data Forms which Arrives at Emergency Medical Services by Ambulance. J Surg Curr Trend Innov 4: 025.
Copyright: © 2020 Cihan Büyüksütçü, et al. This is an open-access article distributed under the terms of the Creative Commons Attribution License, which permits unrestricted use, distribution, and reproduction in any medium, provided the original author and source are credited.