Factors Associated with Change in Functional Performance among Wheelchair Users
*Corresponding Author(s):
Hassan Izzeddin SarsakDepartment Of Occupational Therapy, Batterjee Medical College, PO Box 6231 Jeddah 21442 KSA, Saudi Arabia
Email:hassan.sarsak@bmc.edu sasarsakhassan@gmail.com
Abstract
The main objective of this study was to explore demographics, wheelchair characteristics, and functional status indicators associated with changes in perceptions and functional performance of wheelchair users.
Nineteen wheelchair users were selected for this exploratory study. Utilizing Exhaustive Chi-Squared Automatic Interaction Detector (CHAID) analysis, seven models were generated to examine specific demographics, wheelchair characteristics, and functional status indicators associated with pretest to posttest change scores in perceptions and performance of everyday tasks over time of three target variables. Validation of the models generated by Exhaustive CHAID analyses was conducted through the n-fold cross-validation procedure. The Functioning Everyday with a Wheelchair (FEW), the FEW-Capacity (FEW-C), and the FEW-Performance (FEW-P) were the measures used in this study.
The means for the change score were larger for the FEW (1.08 ± 0.59) followed by the FEW-C (0.69 ± 0.63), and then the FEW-P (0.33 ± 0.45). Most of the factors identified in each model were derived from the pretest. Our study explored factors that were significantly associated with change scores of the FEW tools. Independence, number of physical assists, safety, and tasks related to Outdoor Mobility at pretest were the functional status indicators found to be of greatest importance and significantly associated with changes in perceptions and performance of everyday tasks over time in our models. For all analyses, the values of the Risk Estimate for the Risk Statistics and Cross-validation were close with relatively small differences, suggesting strong and reasonable confidence in the validity of the seven models.
This study may suggest specific focus areas for assessment and intervention and may highlight the importance of some factors that influence changes in functional performance among clients who have been referred for, and prescribed, a wheeled mobility device.
Keywords
BACKGROUND
Specific wheelchair characteristics (i.e., wheelchair type and design) are considered essential factors that can play a vital role in the wheelchair evaluation process. Differences in wheelchair type and design can lead to differences in a client’s performance of functional mobility skills. Choice of wheelchair may affect a client’s ability to be independent in a community setting. Research has shown that changes in the design of a wheelchair can result in positive changes in energy cost, joint kinematics and propulsion biomechanics [7]. For example, the high degree of adjustability of the Ultra-light Wheelchairs (UWC), namely the ability to adjust the seat height in relation to axle position as well as place the axle forward of the center of gravity of the user, has been shown to increase the mobility of the user by decreasing rolling resistance, increasing propulsion efficiency and smoothness, and preserving upper extremity integrity [8]. Cooper and his team also reported that the high degree of adjustability of the UWC can increase the mobility of the user and reduce the risk of secondary injury or disability [7,9,10].
Although these studies explored mobility characteristics and activity levels of wheelchair users, more research is needed to further assess the relationship between functional performance, wheelchair mobility, demographics, wheelchair characteristics, and indicators of function, namely, the critical assessment tasks associated with a clients’ abilities to carry out everyday tasks with their wheelchair. It is the dynamic interactions between these factors that pose the challenge for clinicians and wheelchair users as they decide on the best wheeled mobility interventions [11].
Decision analysis methods, such as Exhaustive Chi-Squared Automatic Interaction Detector (CHAID) are analytic strategies that provide a mechanism for examining dynamic interactions among several variables, such as those just described [12]. Decision analysis methods have been used in research such as assessment and intervention for Basic Activities of Daily Living (BADL) and Instrumental ADL (IADL) and to develop models to enhance stroke rehabilitation [13-15]. Despite the usefulness of decision analysis methods such as CHAID, few studies have applied these methods with wheelchair users. Allegretti utilized CHAID to conduct a secondary analysis of demographic and clinical data, from the Randomized Clinical Trial on Preventing Pressure Ulcers with Seat Cushions, to identify risk factors associated with acquiring/not acquiring a pressure ulcer in elderly long-term care residents, who were provided with custom fit wheelchairs and pressure-reducing cushions to prevent pressure ulcers [16]. CHAID analyses confirmed known risk factors such as musculoskeletal/neurological/psychiatric illnesses, history of pressure ulcer, moisture, and independence in transfer, immobility, and identified new risk factors (e.g., Braden Activity/Mobility score, and type of wheelchair propulsion), that are associated with pressure ulcer development. Furthermore, Allegretti concluded that the CHAID decision-making tree could help rehabilitation clinicians identify and take into consideration the different pressure ulcer risk factors when assessing new clients for wheeled mobility devices.
The specific aim of this study was to examine demographics, wheelchair characteristics, and functional status indicators associated with pretest to posttest change scores of three target variables. These target variables were the mean pretest to posttest change scores for (1) the self-report Functioning Everyday with a Wheelchair Beta Version 2.0 (FEW) tool, (2) the performance-based Functioning Everyday with a Wheelchair - Capacity (FEW-C) tool, and (3) the performance-based Functioning Everyday with a Wheelchair - Performance (FEW-P) tool.
By identifying the demographics, wheelchair characteristics, and functional status indicators significantly associated with changes in wheelchair function from pretest to posttest, we hope to identify the factors clinicians (i.e., occupational therapists) must address during the pretest assessment. Likewise, the factors are most strongly associated with (predict) changes in wheelchair function can provide guidance to clinicians about where to focus potential interventions to bring about change.
METHODS
Our study sample consisted of 19 wheelchair users with progressive or non-progressive conditions who needed a new wheeled mobility and seating device. Nine were male and 10 were female. The average participant was Caucasian, 53.1 (± 11.0) years old, and had used a wheelchair for 9.5 (± 11.3) years. Participants with multiple sclerosis comprised over one third of the sample (Table 1). At pretest, 16 of the wheelchairs were manual and 3 were power. The manual wheelchairs, on average, were 3.7 (± 2.5) years old and most of them had no seat functions. At posttest, all participants had power wheelchairs, and most of these wheelchairs were equipped with multiple seat functions (Table 2).
|
Demographics |
Mean (SD) [range] |
n |
|
Age (mean, SD) [range] |
53.1 (± 11.0) [36 -72] | |
|
Gender |
9 |
|
|
Race |
17 |
|
|
Years using a wheelchair (mean, SD) |
9.5 (± 11.3) [1-45] |
|
|
Age of current wheelchair (mean, SD) |
3.74 (± 2.5) [1-9] |
|
|
Number of wheelchairs owned currently |
11 |
|
|
Primary medical condition |
1 |
|
Characteristics |
Pretest |
Posttest |
|
Type of wheelchair |
|
|
|
Seat functions |
|
|
Table 2: Type of wheelchair and seat functions at pretest and posttest (n=19).
PROCEDURES
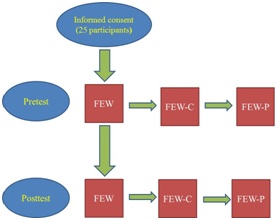
Figure 1: Flow diagram of the FEW, FEW-C, and FEW-P data collection.
N.B. FEW: the Functioning Everyday with a Wheelchair instrument (the self-report version);
FEW-C: FEW-Capacity (the clinic-version); FEW-P: FEW-Performance (the home-version)
INSTRUMENTS
FEW
|
Items/tasks |
|
Stability, Durability, Dependability |
|
Comfort Needs |
|
Health Needs |
|
Operate |
|
Reach |
|
Transfer |
|
Personal Care |
|
Indoor Mobility |
|
Outdoor Mobility |
|
Transportation |
FEW-C
FEW-P
FEW-C and FEW-P data: independence
|
Score |
Independence data |
|
3 |
No assists |
|
2 |
No physical assists; Occasional verbal and/or Visual assists |
|
1 |
Occasional physical assists; Continuous verbal and/or Visual assists |
|
0 |
Continuous physical assists; Total assistance |
DATA ANALYSIS
Exhaustive CHAID Analysis is used to determine associations between multiple independent predictor variables (categorical or continuous) and a single target outcome measure. One of the advantages of Exhaustive CHAID analysis is that it works for all types of variables and can generate a decision tree of the relationships between the target (dependent) variable and the related factors. The root is the target outcome and describes the target variable. The decision tree branches identify the demographics, wheelchair characteristics, and functional status indicators that are most strongly associated with the target variable and divide the tree into the most favorable functional outcomes on the left and the least favorable functional outcomes on the right. Exhaustive CHAID evaluates all the values of the potential predictor variables using the significance of a statistical test as a criterion for entering the model. The statistical test used depends on the measurement level of the target variable, and because all target variables in this study were continuous, an F test was used [24].
Exhaustive CHAID was used in this study because it is exploratory, and its thorough iterative process enhances the possibility of finding more variables (demographics, wheelchair characteristics, and functional status indicators) associated with more and less favorable outcomes of the target outcome (change scores for the FEW, FEW-C, and FEW-P). The strength of Exhaustive CHAID analysis is that it reduces researcher bias in identifying the final predictor variables and the cutoff scores of the predictor variables [25]. Given the small sample size in this study, validation of the models generated by Exhaustive CHAID analyses was conducted through the n-fold cross-validation procedure. The n-fold method is an established cross-validation method and is ideal for use with small sample sizes. The n-fold procedure involves random division of the sample into smaller subsamples from which the model is regenerated. The output of the cross-validation procedure is a table displaying the Risk Estimate and the Standard Deviation (SD) of the Risk Estimate for the Risk Statistics and Cross-validation. The closer the values of the Risk Estimate for the Risk Statistics and Cross-validation, the stronger the predictive value of the model [24].
To explain our findings, paired t-tests were used to examine differences between pretest and posttest perceptions of participants’ health status on an average day over the last three months and on the day of testing. We defined statistical significance as p < .05. Spearman’s rho correlation coefficients were then used to examine relationships between change in participants’ average health status over the past three months and day of testing and change in participants’ function on the FEW, FEW-C, and FEW-P. We defined statistical significance as p < .05 and with the Bonferroni adjustment statistical significance was p < .01 [24].
Exhaustive CHAID target variables
Exhaustive CHAID predictor variables
RESULTS
Descriptive statistics of change scores (FEW, FEW-C, FEW-P)
|
Tool |
|
Pretest |
Posttest |
|
Change score |
|
Range |
95% CI |
|
FEW |
|
1.35 ± 0.67 |
2.43 ± 0.36 |
|
1.08 ± 0.59 |
|
(0.22-2.22) |
[0.79, 1.36] |
|
FEW-C |
||||||||
|
Independence |
|
1.90 ± 0.74 |
2.59 ± 0.32 |
|
0.69 ± 0.63 |
|
(-0.13-2.33) |
[0.38, 0.99] |
|
Safety |
|
1.96 ± 0.73 |
2.68 ± 0.36 |
|
0.72 ± 0.84 |
|
(-0.33-3.00) |
[0.31, 1.12] |
|
Quality |
|
1.57 ± 0.69 |
2.55 ± 0.47 |
|
0.99 ± 0.77 |
|
(-0.11-2.78) |
[0.62, 1.36] |
|
FEW-P |
||||||||
|
Independence |
|
2.12 ± 0.67 |
2.45 ± 0.43 |
|
0.33 ± 0.45 |
|
(-0.24-1.34) |
[0.12, 0.55] |
|
Safety |
|
1.97 ± 0.63 |
2.37 ± 0.37 |
|
0.40 ± 0.61 |
|
(-0.44-1.78) |
[0.11, 0.70] |
|
Quality |
|
1.62 ± 0.60 |
2.26 ± 0.40 |
|
0.64 ± 0.55 |
|
(0.00-2.00) |
[0.38, 0.90] |
Table 5: Descriptives of change scores for the FEW, FEW-C, and FEW-P (N=19).
Note: Change score = Posttest minus pretest.
EXHAUSTIVE CHAID ANALYSES
FEW change score outcome
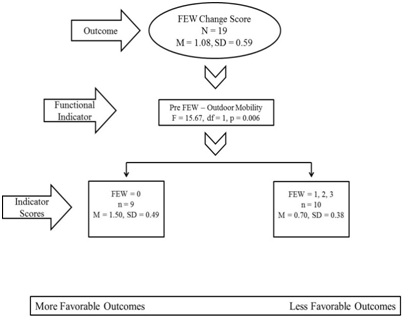 Figure 2: Exhaustive CHAID analysis of the FEW change score: Functional indicators associated with more and less favorable outcomes.
N.B. Pre = Pretest; FEW: the Functioning Everyday with a Wheelchair tool (the self-report version); (FEW: 0 = completely disagree; 3 = completely agree).
Table 6 outlines the results obtained from the n-fold cross validation procedure for the FEW change score model. As displayed in the table, the difference between the Risk Estimate for the Risk Statistics and Cross-validation was 0.01 suggesting reasonable confidence in the validity of the model.
FEW-C change score outcomes
|
|
|
Risk Statistics |
|
Cross-Validation |
|
Risk Estimate |
|
0.17 |
|
0.18 |
|
Standard deviation of Risk Estimate |
|
0.04 |
|
0.05 |
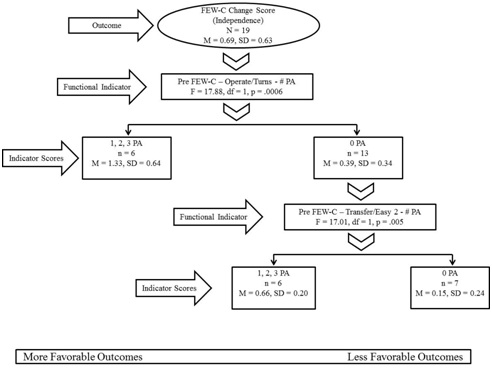 Figure 3: Exhaustive CHAID analysis of the FEW-C change score (Independence): Functional indicators associated with more and less favorable outcomes.
N.B. Pre = Pretest; FEW-C: the Functioning Everyday with a Wheelchair tool - FEW-Capacity (the clinic-version); # PA = Number of physical assists; Easy 2 = transfer back from identified surface to wheelchair (same height).
Table 7 outlines the results obtained from the n-fold cross validation procedure for the FEW-C Independence change score model. As displayed in the table, the difference between the Risk Estimate for the Risk Statistics and Cross-validation was 0.12 suggesting reasonable confidence in the validity of the model.
|
|
Risk Statistics |
Cross-Validation |
|
Risk Estimate |
0.14 |
0.02 |
|
Standard deviation of Risk Estimate |
0.05 |
0.01 |
Table 7: Cross-validation results for the FEW-C (independence) model.
 Figure 4: Exhaustive CHAID analysis of the FEW-C change score (Safety): Functional indicators associated with more and less favorable outcomes.
N.B. Pre = Pretest; FEW-C: the Functioning Everyday with a Wheelchair tool - FEW-Capacity (the clinic-version); (safety summary: 0 = severe risks; 3 = safe practices); (quality summary: 0 = unacceptable (standards not met; 3 = acceptable (standards met).
Table 8 outlines the results obtained from the n-fold cross validation procedure for the FEW-C Safety change score model. As displayed in the table, the difference between the Risk Estimate for the Risk Statistics and Cross-validation was 0.06 suggesting reasonable confidence in the validity of the model.
|
|
Risk Statistics |
Cross-Validation |
|
Risk Estimate |
0.22 |
0.16 |
|
Standard deviation of Risk Estimate |
0.09 |
0.08 |
Table 8: Cross-validation results for the FEW-C (safety) model.
For the FEW-C Quality change score model (Figure 5), the ability to perform the FEW-C Indoor Mobility task safely at pretest (i.e., safety summary score), was the functional indicator most strongly associated with the FEW-C Quality change score outcome (F = 22.02, p = .001), separating the sample into two significantly different subsamples: participants who were at severe risk (n = 6) and participants who had a potential risk, minor risk, or demonstrated safe practices (n = 13). For participants who had a potential risk, minor risk, or demonstrated safe practices the next strongest functional indicator was the ability to perform the FEW-C Outdoor Mobility task safely (i.e., safety summary score) at posttest (F = 10.70, p = .007). Exhaustive CHAID again divided the subsample into two significantly different subsamples: participants who demonstrated safe practices (n = 8) and participants who had severe risk, minor risk, or a potential risk (n = 5).
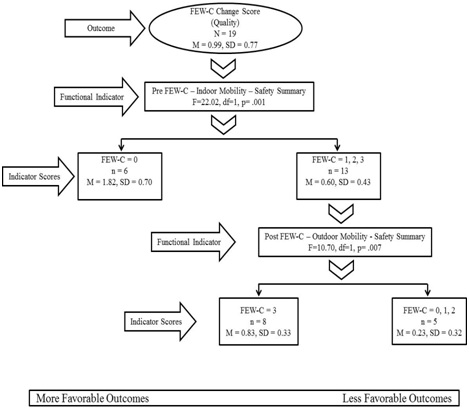 Figure 5: Exhaustive CHAID analysis of the FEW-C change score (Quality): Functional indicators associated with more and less favorable outcomes
N.B. Pre = Pretest; Post = Posttest; FEW-C: the Functioning Everyday with a Wheelchair tool – FEW-Capacity (the clinic-version); (safety summary: 0 = severe risks; 3 = safe practices).
Table 9 outlines the results obtained from the n-fold cross validation procedure for the FEW-C Quality change score model. As displayed in the table, the difference between the Risk Estimate for the Risk Statistics and Cross-validation was 0.05 suggesting reasonable confidence in the validity of the model.
|
|
Risk Statistics |
Cross-Validation |
|
Risk Estimate |
0.19 |
0.14 |
|
Standard deviation of Risk Estimate |
0.06 |
0.08 |
FEW-P change score outcomes
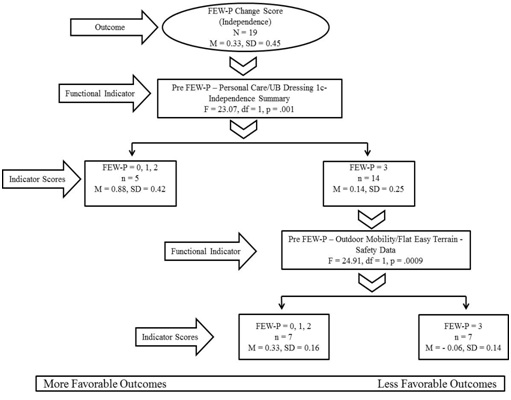 Figure 6: Exhaustive CHAID analysis of the FEW-P change score (Independence): Functional indicators associated with more and less favorable outcomes.
N.B. Pre = Pretest; FEW-P: the Functioning Everyday with a Wheelchair tool - FEW-Performance (the home-version); UB Dressing 1c: upper body dressing (takes off shirt/coat/jacket while seated in a wheelchair); (independence summary: 0 = total assistance; 3 = no assists); (safety data: 0 = severe risks; 3 = safe practices).
Table 10 outlines the results obtained from the n-fold cross validation procedure for the FEW-P Independence change score model. As displayed in the table, the difference between the Risk Estimate for the Risk Statistics and Cross-validation was 0.02 suggesting reasonable confidence in the validity of the model.
|
|
|
Risk Statistics |
Cross-Validation |
|
Risk Estimate |
|
0.05 |
0.07 |
|
Standard deviation of Risk Estimate |
|
0.02 |
0.02 |
For the FEW-P Safety change score model (Figure 7), the FEW Outdoor Mobility task at posttest was the functional indicator most strongly associated with FEW-P Safety change score outcome (F = 19.13, p = .001), separating the sample into two significantly different subsamples: participants who completely disagreed to mostly agreed that the size, fit, postural support and functional features of their wheelchair allowed them to get around outdoors as independently, safely, and efficiently as possible (n = 5) and participants who completely agreed that the size, fit, postural support and functional features of their wheelchair allowed them to get around outdoors as independently as possible (n = 14). For participants who completely agreed that their wheelchair allowed them to get around outdoors as independently as possible, the next strongest functional indicator was the FEW-C Health Needs task Quality score at posttest, more specifically the ability to adequately and efficiently elevate legs while seated in a wheelchair (F = 27.08, p = .001). Exhaustive CHAID again divided the subsample into two significantly different subsamples. Participants whose quality of performance was acceptable with improvement possible or acceptable with standards met (n = 9) and participants whose quality of performance was unacceptable with standards not met or with standards partially met (n = 5).
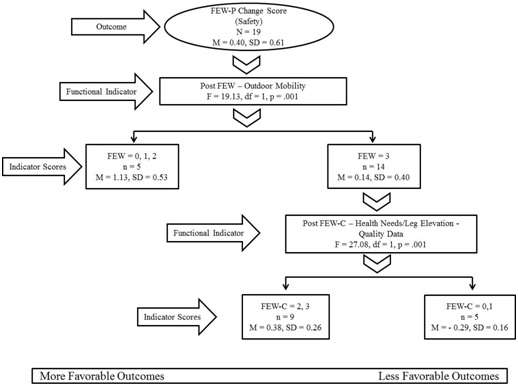 Figure 7: Exhaustive CHAID analysis of the FEW-P change score (Safety): Functional indicators associated with more and less favorable outcomes.
N.B. Post = Posttest; FEW: the Functioning Everyday with a Wheelchair tool (the self-report version); FEW-C: the Functioning Everyday with a Wheelchair tool - FEW-Capacity (the clinic-version); FEW-P: the Functioning Everyday with a Wheelchair tool - FEW-Performance (the home-version); (FEW: 0 = completely disagree; 3 = completely agree); (quality data: 0 = unacceptable (standards not met; 3 = acceptable (standards met).
Table 11 outlines the results obtained from the n-fold cross validation procedure for the FEW-P Safety change score model. As displayed in the table, the largest difference between the Risk Estimate for the Risk Statistics and Cross-validation was 0.03 suggesting reasonable confidence in the validity of the model.
|
|
Risk Statistics |
Cross-Validation |
|
Risk Estimate |
0.09 |
0.11 |
|
Standard deviation of Risk Estimate |
0.03 |
0.06 |
For the FEW-P Quality change score model (Figure 8), the presence of an arm support at pretest, more specifically the removable arm support, was the wheelchair characteristic variable most strongly associated with the FEW-P Quality change score outcome (F = 7.72, p = .01), separating the sample into two significantly different subsamples: participants whose wheelchairs did not have a removable arm support at pretest (n = 14) and participants whose wheelchair had a removable arm support at pretest (n = 5). For participants whose wheelchair did not have a removable arm support at pretest the next strongest functional indicator was independence performing the FEW-P Outdoor Mobility task at pretest, more specifically the number of physical assists needed to travel on flat easy terrain (F = 6.88, p = .02). Exhaustive CHAID again divided the subsample into two significantly different subsamples: participants who needed one, two, or three physical assists to travel on flat easy terrain (n = 9) and participants who traveled on flat easy terrain with no physical assists (n = 5).
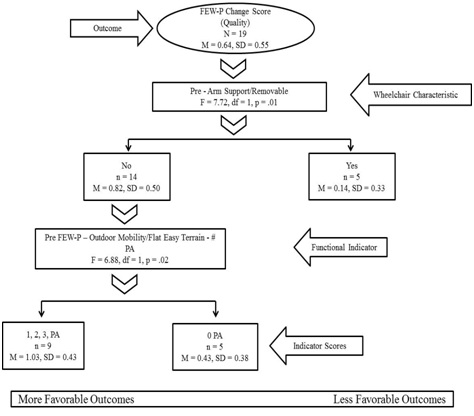 Figure 8: Exhaustive CHAID analysis of the FEW-P change score (Quality): Functional indicators and demographics associated with more and less favorable outcomes.
N.B. Demographic (Yes: with arm support/removable; No: without arm support/removable); Pre = Pretest; FEW-P: the Functioning Everyday with a Wheelchair tool - FEW-Performance (the home-version); # PA = Number of physical assists.
Table 12 outlines the results obtained from the n-fold cross validation procedure for the FEW-P Quality change score model. As displayed in the table, the largest difference between the Risk Estimate for the Risk Statistics and Cross-validation was 0.10 suggesting reasonable confidence in the validity of the model.
|
|
|
Risk Statistics |
|
Cross-Validation |
|
Risk Estimate |
|
0.13 |
|
0.03 |
|
Standard deviation of Risk Estimate |
|
0.04 |
|
0.02 |
Table 12: Cross-validation results for the FEW-P (quality) model. FEW-P: The Functioning Everyday with a Wheelchair tool - FEW-Performance (the home-version)
Table 13 summarizes the results from the seven Exhaustive CHAID models. Pre-post change variables, significant predictors, and more or less favorable outcomes are identified.|
Pre-post Change |
Significant Predictor(s) |
More Favorable |
Less Favorable |
|
FEW |
Pre FEW Outdoor Mobility |
0 (Completely disagree) |
1,2,3 |
|
FEW-C Independence |
Pre FEW-C operate/turn WC/Independence |
1,2,3 physical assists |
0 physical assists |
|
Pre FEW-C easy transfer/ind1 |
1,2,3 physical assists |
0 physical assists |
|
|
FEW-C Safety |
Pre FEW-C Indoor Mobility/Safety |
0 (severe risks) |
1,2,3 |
|
Pre FEW-C Personal care/quality2 |
3 (acceptable) |
0,1,2 |
|
|
FEW-C Quality |
Pre FEW-C Indoor Mobility/Safety |
0 (severe risks) |
1,2,3 |
|
Post Few-C Outdoor Mobility/Safety3 |
3 (safe practice) |
0,1,2 |
|
|
FEW-P Independence |
Pre FEW-P Upper Body Dressing/ Independence |
0,1,2 physical assists |
3 physical assists |
|
Pre Few-P Outdoor mobility/Safety4 |
0,1,2 |
3 (safe practice) |
|
|
FEW-P Safety |
Post FEW Outdoor Mobility |
0,1,2 |
3 (completely agree) |
|
Post FEW-C leg elevation/quality5 |
2,3 (3=completely acceptable) |
0,1 |
|
|
FEW-P Quality |
Removable arm support pre |
No |
Yes |
|
Pre FEW Outdoor Mobility /Independence6 |
1,2,3 physical assists |
0 physical assists |
Table 13: Summary of exhaustive CHAID models.
DIFFERENCES IN HEALTH STATUS BETWEEN PRETEST AND POSTTEST
|
Outcome |
Pretest |
Posttest |
95% CI |
t |
df |
p |
|
Average health |
59.24 ± 18.92 |
66.76 ± 16.20 |
[-14.93, -0.13] |
-2.16 |
16 |
0.04 |
|
Health today |
54.41 ± 20.30 |
66.76 ± 21.57 |
[-23.60, -1.11] |
-2.33 |
16 |
0.03 |
Table 14: Differences between pretest and posttest in average health and health today.
Note: Average health: participants’ health status on an average day over the last three months; Health today: participants’ health status on the day of testing; Number of participants (N=17)
RELATIONSHIPS BETWEEN CHANGE IN HEALTH STATUS AND CHANGE IN FUNCTION
DISCUSSION
Another interesting finding was that Outdoor Mobility was a significant predictor in five models which highlights the importance of this specific item and related tasks/skills (i.e., the ability to travel safely on flat easy terrain) in changes in functional performance of wheelchair users. This finding confirms the work of previous studies which highlighted the role of outdoor mobility and its related tasks/skills and reported that involvement in outdoor activities such as being active in the community help wheelchair users maintain wheelchair skills and are positively associated with their functional performance [26].
Our data also showed that the amount of change was larger for the FEW when compared to the FEW-C and FEW-P and it were the pretest scores that were driving the change. An explanation for that could be because the participants in Mills and Schmeler studies had come to a clinical setting to be evaluated for a new wheeled mobility and seating device, their perceptions of their function as indicated on the FEW may have been worse than their actual performance as indicated on the FEW-C and FEW-P [17,18]. These participants tended to underestimate their capabilities on the FEW self-report tools compared to their pretest performance, which is not unusual for individuals who are seeking interventions to obtain health services or a new product and/or equipment [18,27].
Furthermore, although participants’ perceived health status improved significantly at posttest, the results of Spearman’s rho correlation coefficients indicated that there were no significant relationships between change in participants’ perceived health status and change in participants’ function. This suggests that improvement in participants’ performance at posttest was not associated with their improved health status, but rather due to the effect of the new properly fitted wheelchairs provided by a qualified interdisciplinary team of clinicians.
For Independence predictor variables, worse independence scores and more physical assists needed to perform different tasks at pretest (Outdoor Mobility, Operate, Transfer, Personal Care) and posttest (Outdoor Mobility) were associated with larger change scores (more favorable outcomes) and that was consistent among the three models for the FEW, FEW-C, and FEW-P. For Safety predictor variables, worse safety scores while performing different tasks (Indoor Mobility, Outdoor Mobility) at pretest were associated with larger change scores (more favorable outcomes) and that was consistent among the two models for the FEW-C, and FEW-P. However, worse safety scores while performing the Outdoor Mobility task at posttest was associated with smaller change scores (less favorable outcomes) as indicated in the FEW-C Quality change score model. For Quality predictor variables, at both pretest and posttest, better quality scores were always associated with larger change scores (more favorable outcomes) as indicated in both the FEW-C Safety change score model --- Personal Care quality summary, and the FEW-P Safety change score model ---Health Needs/Leg Elevation quality data.
The utility of Exhaustive CHAID methods was evaluated by examining the validity of the factors identified in each analysis through the n-fold cross-validation procedure. Examining the factors identified in each analysis provides some support for the validity of the methods. For all analyses, the values of the Risk Estimate for the Risk Statistics and Cross-validation were fairly close with relatively small differences, providing strong and reasonable confidence in the validity of these models.
With Exhaustive CHAID, even though it is an iterative process, variables that had missing data such as the Transportation task did not enter any of the models. Also, even though no data were missing, surprisingly, no demographics were indicated and only one wheelchair characteristic was included in the Exhaustive CHAID analyses, namely, whether the participants had a removable arm support at pretest. This finding is not consistent with the current body of literature which reports that demographic variables such as age, race, employment status, and type of wheelchair can contribute to different functional performance outcomes [7-11,28]. This finding warrants further investigation to examine the dynamic interaction between the various demographics and wheelchair characteristics and change scores of the FEW, FEW-C, and FEW-P tools that measure functional performance of wheelchair users.
Clinically, the most prominent finding from our models suggests that independence, number of physical assists, safety, and tasks related to Outdoor Mobility at pretest are functional indicators of great importance for change in perceptions and performance in everyday tasks of wheelchair users. Therefore, if clinicians (i.e., occupational therapists) thoroughly assess these indicators which then can be targeted for intervention, perceptions and performance of wheelchair users may be developed and lead to improved everyday functioning. Another relevant clinical finding is that worse independence and safety scores and a greater number of physical assists needed to perform different tasks at pretest were associated with larger change scores (more favorable outcomes) which is considered a potential area for intervention that clinicians need to focus on when prescribing a new wheelchair.
STUDY LIMITATIONS AND FUTURE DIRECTIONS
CONCLUSION
REFERENCES
- Routhier F, Vincent C, Desrosiers J, Nadeau S (2003) Mobility of wheelchair users: A proposed performance assessment framework. Disabil Rehabil 25: 19-34.
- Rogers JC, Holm MB (1991) Task performance of older adults and low assistive technology devices. International Journal of Technology and Aging 4: 93-106.
- Brienza D, Kelsey S, Karg P, Allegretti A, Olson M, et al. (2010) A randomized clinical trial on preventing pressure ulcers with wheelchair seat cushions. J Am Geriatr Soc 58: 2308-2314.
- Smith C, McCreadie M, Unsworth J (1995). Prescribing wheelchairs: The opinions of wheelchair users and their carers. Clinical Rehabilitation 9: 74-80.
- Hoenig H, Landerman LR, Shipp KM, Pieper C, Pieper C, et al. (2005) A clinical trial of a rehabilitation expert clinician versus usual care for providing manual wheelchairs. J Am Geriatr Soc 53: 1712-1720.
- Karmarkar AM, Collins DM, Kelleher A, Cooper RA (2009) Satisfaction related to wheelchair use in older adults in both nursing homes and community dwelling. Disabil Rehabil Assist Technol 4: 337-343.
- Cooper RA, Boninger ML, Rentschler A (1999) Evaluation of selected ultralight manual wheelchairs using ANSI/RESNA standards. Arch Phys Med Rehabil 80: 462-467.
- Rogers H, Berman S, Fails D, Jaser J (2003) A comparison of functional mobility in standard vs. ultralight wheelchairs as measured by performance on a community obstacle course. Disabil Rehabil 25: 1083-1088.
- Cooper RA, Gonzalez J, Lawrence B, Renschler A, Boninger ML, et al. (1997) Performance of selected lightweight wheelchairs on ANSI/RESNA tests. American National Standards Institute-Rehabilitation Engineering and Assistive Technology Society of North America. Arch Phys Med Rehabil 78: 1138-1144.
- Cooper RA, Robertson RN, Lawrence B, Heil T, Albright SJ, et al. (1996) Life-cycle analysis of depot versus rehabilitation manual wheelchairs. J Rehabil Res Dev 33: 45-55.
- Oyster ML, Karmarkar AM, Patrick M, Read MS, Nicolini L, et al. (2011) Investigation of factors associated with manual wheelchair mobility in persons with spinal cord injury. Arch Phys Med Rehabil 92: 484-490.
- SPSS Incorporated (2001) Answer Tree 3.0 User's Guide. SPSS Incorporated, Chicago, USA. Pg no: 266.
- Huang YH, Wu CY, Lin KC, Hsieh YW, Snow WM, et al. (2013) Determinants of change in stroke-specific quality of life after distributed constraint-induced therapy. Am J Occup Ther 67: 54-63.
- Skidmore ER, Rogers JC, Chandler LS, Holm MB (2006) Developing empirical models to enhance stroke rehabilitation. Disabil Rehabil 28: 1027-1034.
- Skidmore ER, Rogers JC, Chandler LS, Holm MB (2006). Dynamic interactions between impairment and activity after stroke: Examining the utility of decision analysis methods. Clin Rehabil 20: 523-535.
- Allegretti ALC (2008) Factors associated with clinical decisions and pressure ulcer development in long term care residents. Doctoral Dissertation, University of Pittsburgh, Pennsylvania, USA.
- Mills TL (2003) Functioning Everyday with a Wheelchair (FEW): Development and Validation of Self-report and Performance-based Observation Instruments to Measure Functional Outcomes of Seating-mobility Interventions. University of Pittsburgh, Pennsylvania, USA. Pg no: 556.
- Schmeler M (2005) Development and Testing of a Clinical Outcome Measurement Tool to Assess Wheeled Mobility and Seating Interventions. Doctoral Dissertation, University of Pittsburgh, Pennsylvania, USA.
- Mills TL, Holm MB, Schmeler M (2007) Test-retest reliability and cross validation of the Functioning Everyday with a Wheelchair instrument. Assist Technol 19: 61-77.
- Mills T, Holm MB, Trefler E, Schmeler M, Fitzgerald S, et al. (2002) Development and consumer validation of the Functional Evaluation in a Wheelchair (FEW) instrument. Disabil Rehabil 24: 38-46.
- Holm MB, Rogers JC (1999) Functional assessment: The Performance Assessment of Self Care Skills (PASS). In: Hemphill-Pearson BJ (ed.). Assessment in Occupational Therapy Mental Health: An Integrative Approach. Slack, Thorofare, USA. Pg no: 431.
- Rogers JC, Holm MB (2014) Performance Assessment of Self-care Skills (PASS). University of Pittsburgh, Pennsylvania, USA.
- World Health Organization (2001) International Classification of Functioning, Disability and Health (ICF). WHO, Geneva, Switzerland.
- Field A (2009) Discovering Statistics Using SPSS. SAGE Publications, California, USA. Pg no: 821.
- Kass GV (1980) An exploratory technique for investigating large quantities of categorical data. Applied Statistics 29: 119-127.
- Kilkens OJ, Post MW, Dallmeijer AJ, van Asbeck FW, van der Woude LH (2005) Relationship between manual wheelchair skill performance and participation of persons with spinal cord injuries 1 year after discharge from inpatient rehabilitation. J Rehabil Res Dev 42: 65-74.
- Cress ME, Schechtman KB, Mulrow CD, Fiatarone MA, Gerety MB, et al. (1995) Relationship between physical performance and self-perceived physical function. J Am Geriatr Soc 43: 93-101.
- Cooper RA, Thorman T, Cooper R, Dvorznak MJ, Fitzgerald SG, et al. (2002) Driving characteristics of electric-powered wheelchair users: How far, fast, and often do people drive? Arch Phys Med Rehabil 83: 250-255.
- Kaye HS, Kang T, LaPlante MP (2002) Wheelchair Use in the United States. Pantsupeasy, Pleasanton, USA.
- National Spinal Cord Injury Statistical Center (2009) Spinal Cord Injury Statistics. NSCISC, Birmingham, Alabama.
Citation: Sarsak HI (2019) Factors Associated with Change in Functional Performance among Wheelchair Users. J Phys Med Rehabil Disabil 4: 028.
Copyright: © 2019 Hassan Izzeddin Sarsak , et al. This is an open-access article distributed under the terms of the Creative Commons Attribution License, which permits unrestricted use, distribution, and reproduction in any medium, provided the original author and source are credited.