Global Perspectives of Different Healthcare Systems and Health: Income, Education, Health Disparity, Health Behaviors and Public Health in China, Japan and USA
*Corresponding Author(s):
Tetsuji YamadaDepartment Of Economics, The State University Of New Jersey, Rutgers University, New Jersey, United States
Tel:+1 8562256025,
Email:ytetsuji@aol.com
Abstract
This research attempts to address the problems that arise when changing health policies, i.e. healthcare system, on health considering the effects of difference in income, educational level, and health behaviors on health and health disparity.
Objective
Methodology and data
Results
Conclusions/implications
Keywords
INTRODUCTION
The recent, steady increase in healthcare spending is a notable phenomenon in all countries. The phenomena in China [a national health insurance system], Japan [a universal health insurance system] and the US [a mixed health insurance system] are no exception. Despite an increasing Gross Domestic Product, the steady increase in total expenditures on health as a percentage of GDP for the past two decades is remarkably evident in table 3. A rapid upsurge in the share of public health expenditures to national total health expenditures in Japan is a far larger share than those in China and the US. Higher spending appeared to be largely driven by the universal healthcare structure and the cost-based fee-for-service healthcare system in Japan. For the US, the relatively small share of public health expenditures as percentage of total health expenditures is due to the mixed healthcare system with a swift shift from the traditional fee-for-service of cost based to the managed care structure. The low government healthcare expenditures are due to an early stage of the national health insurance system with the cost-based fee-for-service system in China. Despite a large increase in healthcare expenditures and longevity in China, Japan and the US, health disparity among people and among nations persists [1-3].
Surprisingly however, the healthcare expenditures per capita illustrate similar trends in China, Japan and the US in table 1. The large per capita expenditures of the US are due to the high cost of medical innovation with technology and higher healthcare prices without the government intervention in the healthcare industry. Under the national healthcare system in China, a small amount of per capita healthcare expenditures is anticipated in its future expansion.
|
Health Expenditures Per Capita (PPP Int'l $) |
Health Expenditures Per Capita (Current US $) |
|||||
|
Year |
United States |
Japan |
China |
United States |
Japan |
China |
|
1995 |
3788.31 |
1533.52 |
64.34 |
3788.31 |
2844.85 |
21.02 |
|
1996 |
3944.28 |
1567.23 |
76.68 |
3944.28 |
2455.15 |
26.32 |
|
1997 |
4116.25 |
1675.09 |
89.97 |
4116.25 |
2333.37 |
30.02 |
|
1998 |
4302.44 |
1724.97 |
104.89 |
4302.44 |
2195.84 |
35.4 |
|
1999 |
4521.69 |
1826.16 |
117.98 |
4521.69 |
2597.76 |
38.72 |
|
2000 |
4788.31 |
1973.95 |
133.25 |
4788.31 |
2838.6 |
43.63 |
|
2001 |
5140.23 |
2054.79 |
145.51 |
5140.23 |
2531.11 |
47.54 |
|
2002 |
5575.83 |
2137.32 |
168.27 |
5575.83 |
2450.73 |
54.47 |
|
2003 |
5995.08 |
2234.58 |
189.19 |
5995.08 |
2694.43 |
61.59 |
|
2004 |
6369.43 |
2359.95 |
208.47 |
6369.43 |
2927.43 |
70.62 |
|
2005 |
6471.03 |
2490.67 |
235.07 |
6471.03 |
2921.57 |
80.94 |
|
2006 |
7122.37 |
2604.02 |
263.57 |
7122.37 |
2791.22 |
94.05 |
|
2007 |
7511.96 |
2747.22 |
293.57 |
7511.96 |
2806.57 |
115.29 |
|
2008 |
7786.21 |
2879.79 |
346.84 |
7786.21 |
3255.56 |
157.68 |
|
2009 |
8023 |
3031.26 |
419.95 |
8023 |
3741.59 |
192.52 |
|
2010 |
8269.37 |
3232.16 |
450.34 |
8269.37 |
4110.46 |
220.08 |
|
2011 |
8523.89 |
3456.73 |
515.14 |
8523.89 |
4654.23 |
279.48 |
|
2012 |
8789.77 |
3621.58 |
588.36 |
8789.77 |
4748.92 |
328.66 |
|
2013 |
8987.9 |
3713.17 |
654.37 |
8987.9 |
3960.2 |
375.14 |
|
2014 |
9402.56 |
3726.68 |
730.52 |
9402.56 |
3702.95 |
418.73 |
|
2015 |
9499.79 |
4434.78 |
n.a. |
9499.79 |
3757.68 |
n.a. |
|
2016 |
9884.29 |
4520.21 |
n.a. |
9884.29 |
4239.5 |
n.a. |
Table 1:Health Expenditure Per Capita: US, Japan, and China.
Note: PPP stands for purchase power parity. The healthcare expenditures per capita illustrate similar trends in China, Japan and the US in table 1.
Sources:
http://wdi.worldbank.org/table/2.1
https://www.cdc.gov/hepatitis/statistics/incidencearchive.htms
http://data.worldbank.org/indicator/SP.DYN.IMRT.IN?name_desc=true
http://www.mhlw.go.jp/english/database/db-hw/populate/dl/03.pdf
https://www.cdc.gov/heartdisease/docs/consumered_heartdisease.pdf
https://data.oecd.org/healthstat/deaths-from-cancer.htm
http://www.stats.gov.cn/english/statisticaldata/AnnualData/
Increases in healthcare spending due to an aging society are an urgent issue to be resolved. The rapid increase of aging in three countries has seen a rise in the dependent elderly, population age 65 and over in table 2. This will especially cause a shortage of labor supply, a weakening of the national pension system, and expansion of the use for healthcare resources. Japan has almost 27% of its population age 65 and over in table 2. China demographically still has a young population structure and has had one for the past two decades. It has increased about 5 percentage points in China, while it is about 12 percentage points Japan. The US growth rate has been slow.
|
Population age 65 and above [over] in % of total |
Life Expectancy at Birth (in years) |
|||||
|
Year |
USA |
Japan |
China |
USA |
Japan |
China |
|
1995 |
12.593 |
14.393 |
5.851 |
75.8 |
79.5 |
69.9 |
|
1996 |
12.548 |
14.941 |
6.024 |
76.1 |
80.2 |
70.2 |
|
1997 |
12.492 |
15.498 |
6.184 |
76.5 |
80.4 |
70.5 |
|
1998 |
12.432 |
16.061 |
6.338 |
76.7 |
80.5 |
70.9 |
|
1999 |
12.372 |
16.622 |
6.492 |
76.7 |
80.6 |
71.3 |
|
2000 |
12.318 |
17.18 |
6.651 |
77 |
81 |
71.7 |
|
2001 |
12.296 |
17.703 |
6.83 |
77.2 |
81.4 |
72.2 |
|
2002 |
12.28 |
18.226 |
7.006 |
77.3 |
81.6 |
72.6 |
|
2003 |
12.275 |
18.755 |
7.178 |
77.5 |
81.2 |
73 |
|
2004 |
12.287 |
19.294 |
7.34 |
77.8 |
8.02 |
73.4 |
|
2005 |
12.321 |
19.847 |
7.492 |
77.8 |
81.9 |
73.8 |
|
2006 |
12.391 |
20.394 |
7.632 |
77.7 |
82.3 |
74 |
|
2007 |
12.485 |
20.958 |
7.771 |
78 |
82.5 |
74.3 |
|
2008 |
12.614 |
21.557 |
7.913 |
78 |
82.6 |
74.6 |
|
2009 |
12.789 |
22.215 |
8.069 |
78.4 |
82.9 |
74.8 |
|
2010 |
13.012 |
22.942 |
8.246 |
78.5 |
82.8 |
75 |
|
2011 |
13.291 |
23.587 |
8.446 |
78.7 |
82.6 |
75.2 |
|
2012 |
13.624 |
24.287 |
8.654 |
78.8 |
83.1 |
75.4 |
|
2013 |
13.997 |
25.009 |
8.889 |
78.7 |
83.3 |
75.6 |
|
2014 |
14.39 |
25.71 |
9.183 |
78.9 |
83.6 |
75.8 |
|
2015 |
14.786 |
26.342 |
9.551 |
78.8 |
83.8 |
75.9 |
|
2016 |
15.159 |
26.858 |
10.003 |
78.8 |
84 |
76 |
Table 2:Aging Population and Life Expectancy: US, Japan, and China.
Note: The rapid increase of aging in three countries has seen a rise in the dependent elderly, population age 65 and over in table 2.
Source:
http://data.worldbank.org/indicator/SP.POP.65UP.TO.ZS?name_desc=false
https://www.cdc.gov/nchs/data/databriefs/db88.pdf
https://www.cdc.gov/nchs/products/databriefs/db267.htm
http://data.worldbank.org/indicator/SP.DYN.LE00.IN
http://stats.oecd.org/viewhtml.aspx?datasetcode=HEALTH_STAT&lang=en#
http://apps.who.int/gho/data/node.country.country-CHN
http://www.stats.gov.cn/english/statisticaldata/AnnualData/
http://www.mhlw.go.jp/english/database/db-hw/populate/dl/03.pdf
In aging, people are affected by chronic disease, and aging causes a loss of health stock. The loss of health stock includes losing physical strength and durability, a fast health depreciation of health, and a resultant loss of immunity. Older people in the US are the most likely to report one or more chronic condition. There are 31.5% of Americans with multiple chronic conditions. In addition, 68% of US adults age 65 or older have at least two chronic conditions [4]. China has also had similar experiences. Diabetes has been increasing in China and leads to heart related diseases. About 533 out of every 100,000 residents died from chronic disease in China and chronic disease caused 86.6% of death by cardio-cerebrovascular disease, cancer, and chronic respiratory disease [5,6]. Wang et.al, also proved the aforementioned general evidence by the survey with 1480 people (59.4% women and 40.6% men living in a rural community) aged 60 and over in Shandong Province. The overall prevalence of chronic multimorbid disease is 90.5% [7]. It reveals a great prevalence of chronic conditions among the population in China.
Despite spending more on health care with advanced medical technology relative to China and Japan (Table 1), the US shows poor health outcomes with a relatively short life expectancy (Table 2). Healthcare expenditure in the US far exceeds that of China and Japan for the past decades (Table 1). Regarding the healthcare system, the US has a mixed health insurance system and the US people spend more money on healthcare than China with the National Health Insurance system (NHI) and Japan with the Universal Health Insurance system (UHI) in table 1. In contrast, China dedicates a relatively small share of public health expenditure to total healthcare expenditures compared with the US and Japan (Table 3).
|
Total Expenditures on Health as a % of GDP |
Public Health Expenditures as % of Total Health Expenditures |
|||||
|
Year |
United States |
Japan |
China |
United States |
Japan |
China |
|
1995 |
13.09 |
6.62 |
3.53 |
45.16 |
82.32 |
50.5 |
|
1996 |
13.04 |
6.46 |
3.79 |
45.16 |
82.32 |
46.59 |
|
1997 |
12.96 |
6.73 |
4.02 |
44.98 |
81.33 |
44.24 |
|
1998 |
12.99 |
7.01 |
4.33 |
43.71 |
80.65 |
41.81 |
|
1999 |
12.99 |
7.34 |
4.49 |
43.22 |
80.49 |
40.88 |
|
2000 |
13.07 |
7.53 |
4.6 |
43.26 |
80.81 |
38.28 |
|
2001 |
13.73 |
7.75 |
4.56 |
44.24 |
81.29 |
35.57 |
|
2002 |
14.55 |
7.85 |
4.79 |
44.15 |
81.05 |
35.83 |
|
2003 |
15.06 |
8 |
4.82 |
43.95 |
80.3 |
36.23 |
|
2004 |
15.14 |
8.03 |
4.72 |
44.25 |
80.56 |
37.97 |
|
2005 |
15.15 |
8.18 |
4.66 |
4.36 |
81.37 |
38.77 |
|
2006 |
15.27 |
8.19 |
4.52 |
45.07 |
80.5 |
40.65 |
|
2007 |
15.57 |
8.25 |
4.32 |
45.07 |
81.41 |
46.93 |
|
2008 |
16.02 |
8.6 |
4.59 |
45.98 |
81.35 |
49.95 |
|
2009 |
17 |
9.51 |
5.08 |
47.15 |
81.5 |
52.5 |
|
2010 |
17.02 |
9.58 |
4.89 |
47.48 |
82.08 |
54.31 |
|
2011 |
17.06 |
10.07 |
5.03 |
47.34 |
82.59 |
55.89 |
|
2012 |
17.02 |
10.17 |
5.26 |
47.26 |
82.7 |
55.96 |
|
2013 |
16.19 |
10.25 |
5.39 |
47.61 |
83.22 |
55.81 |
|
2014 |
17.14 |
10.23 |
5.55 |
48.3 |
83.56 |
55.79 |
|
2015 |
16.9 |
10.9 |
n.a. |
49.35 |
83.97 |
n.a. |
|
2016 |
17.2 |
10.9 |
n.a. |
49.13 |
84.11 |
n.a. |
Table 3: Health Expenditures: US, Japan and China.
Note: GDP stands for gross domestic product. A rapid upsurge in the share of public health expenditures to national total health expenditures in Japan is a far larger share than those in China and the US in table 3.
Sources:
http://wdi.worldbank.org/table/2.1
https://www.cdc.gov/hepatitis/statistics/incidencearchive.htm
http://data.worldbank.org/indicator/SP.DYN.IMRT.IN?name_desc=true
http://www.mhlw.go.jp/english/database/db-hw/populate/dl/03.pdf
http://data.worldbank.org/indicator/SP.DYN.LE00.IN
https://data.oecd.org/healthstat/deaths-from-cancer.htm
http://www.stats.gov.cn/english/statisticaldata/AnnualData/
http://www.mhlw.go.jp/english/database/db-hw/populate/dl/03.pdf
It is interesting to do cross-national comparisons to evaluate the performance of the US, Japanese, and Chinese healthcare systems, and to assess health behaviors and health outcomes among different health insurance programs, especially issues related to health disparity. But little is known about how the free-competitive economic system has sustained health and produced income disparity. Under the free-competitive economic system, the socio-economic system has generating an expansion of socio-economic disparity with economic development. The economic disparity, in turn, causes and/or creates health disparity in different healthcare systems [8].
Objectives of this study are threefold. (1) How is it possible to develop a sustainable health with in different healthcare scheme? (2) What are influential factors of health behaviors, i.e. preventive care in different healthcare systems among the US, Japan, and China? (3) How can we explain health disparity among people? A cross-national research is needed to better understand the relationship between healthcare systems, health behaviors, and socio-economic factors, as well as other health determinants such as healthy lifestyles and health literacy. It is imperative to profile health, to sustain good health, and to mitigate ever-increasing health disparities among countries and their population.
BACKGROUND
USA Healthcare System
Health Maintenance Organization (HMO) is a managed health insurance and the premium of HMO is a “capitation-base premium”. There is a set fee for each enrollee, and the HMO receives a single annual amount for each enrollee regardless of the amount of care provided. Providers or management groups are responsible for providing health services to a specific group of enrollees in exchange for a set annual fee for each enrollee. The HMO is the restriction of access to providers by offering a network system. Enrollees must use a group of designated providers who are in the network system. Consumers pay a co-payment in addition to the premium paid. Co-payment levels may vary among plans ($10~$30 for example). All healthcare services are coordinated by a designated Primary Care Physician (PCP). A PCP acts as a gatekeeper before a patient visits a specialist. HMOs don’t offer coverage for care from out-of-network healthcare providers. A preauthorization is required for a special treatment.
Preferred Provider Organization (PPO) plans are one of the most popular managed-care plans. The PPO plans generally allow visits to in-network physician and healthcare providers without a referral from a primary care physician to visit a specialist. A co-payment of about $10 - $30 is required for services. Visiting an out-of-network provider will include a higher fee (co-insurance) and a separate deductible. The PPO is an arrangement in which a group of health providers agree to provide services to a defined group of patients at an agreed rate for each service.
Blue Cross and Blue Shield (BCBS) is a federation of 36 separate United States health insurance organizations and companies, providing health insurance in the United States to more than 106 million people. The BCBS is an independent licensee of the national association offering insurance plans within defined regions under one or both association’s brands, since the Blue Cross (BC) is hospital service insurance and the Blue Shield (BS) is physician service insurance. A patient pays “a co-insurance” of 20% ~ 50%. The system is financed through retrospective fee-for-service insurance reimbursement which is cost-based. Unlike the managed health insurance, there is no constraint to receive services from any physicians or hospitals without network system.
Medicare and Medicaid
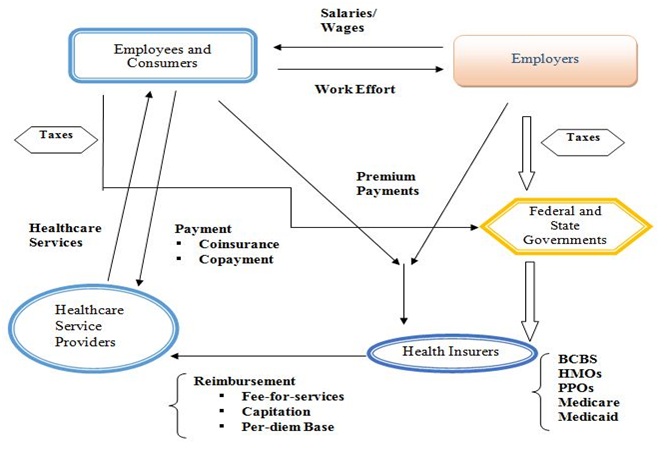
Chart 1: Healthcare Services and Insurance Markets in the USA.
[Mixed Health Insurance System]
Note: The above figure presents health care services and insurance markets with the employer-provided health insurance. Employers and employees typically share premiums. Health insurance premiums are a tax-free benefit to the employee. Medicaid is the federal share of the combined state-federal program. Beneficiaries pay no premium and the direct consumer payments are minimal.
Japan Healthcare System
For the employee health insurance, a health insurance premium is a minimum of $53 year (assuming $1=110 Japanese yen as of September 2017) and the maximum cap of $1,097. The tax rate slides as the income level goes up. The health insurance costs are shared with an employee and an employer by 50% each. The premium also depends on the number of family members. For the national health insurance, the number of family members is multiplied by $29 with sliding adjustment by annual income level. The healthcare expenditures of the UHI are shared by patients (12%), employees (28%), employers (22%), national government (26%) and local governments (12%) in 2016 [11]. Medical and healthcare costs are responsible for the following percent: age of 6 and under [20%], age of 7~69 [50%], age of 70~74 (20%) and age of 75~ (10%). If a person of age 70 and over is a full-time worker, he or she needs to pay 30% of medical and healthcare costs. For example, assuming the medical and healthcare costs are $10,000 and the income of patient is $8,300 per month, a patient’s actual responsibility with maximum limitation, which depends on the patient income level, is $2,541.80 {=$2,526 (income classification level)+[$10,000-$8420,000(social insurance block level)]x0.01(1% of weight)} [11].
The Japanese government has been implementing a price control on pharmaceutical drugs. The price control unquestionably affects the level of pharmaceutical drug innovation by Japanese pharmaceutical firms. On the other hand, the price control prevents a rapid increase in drug disbursement and pharmaceutical expenditures. This in turn this lowers the cost of healthcare expenditures under the Universal Health Insurance (UHI) system. The Ministry of Health, Labor, and Welfare of Japan is responsible for pharmaceutical regulation. A total of 12,423 pharmaceutical drugs (11,242 of generic drugs and 1, 181 brand-name drugs) are approved and listed under the UHI system [12].
In Japan, long-term care consists of four types of public institutional and privately qualified providers and they have different functions and objectives: (1) long-term healthcare facility, (2) long-term welfare care facility, (3) long-term less intensive care facility, and (4) community-based formal homecare services (Chart 2). The national and state level governments fund and subsidize the operating costs for long-term care services by the aforementioned facilities (1), (2) and (3). The elderly in the long-term care facilities are responsible for daily expenses; the costs are determined by their annual income. The community-based formal homecare services include doctor visits, nurse visits, home-help visits, bathing, meals, laundry services, house cleaning, equipment provisions and counseling [13].
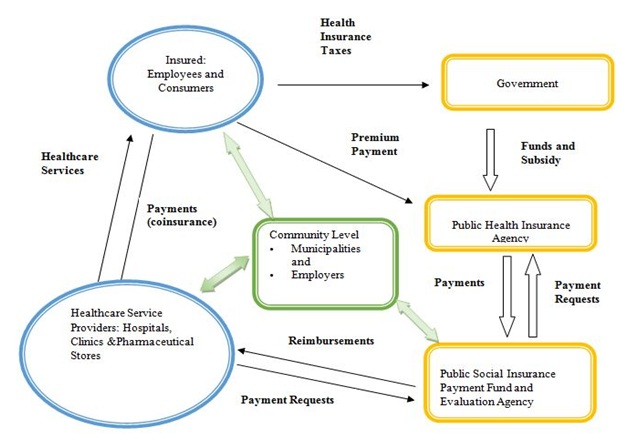
Chart 2: Flowchart of Healthcare System in Japan.
[Universal Health Insurance System]
China Healthcare System
The reimbursement rate is also different between major cities, counties, and villages. The State Council made major strides in establishing basic medical insurance to reduce out of pocket payments and increase accessibility and equity of health services. Publicly financed health insurance is the primary coverage source for most people, but private coverage provided by for-profit commercial insurance companies is still available to higher-income individuals and employers [14].
There are three primary forms of public insurance. Urban Employment Basic Medical Insurance [UEBMI], Urban Resident Basic Medical Insurance [URBMI] and the Rural New Cooperative Medical Scheme [RNCMS]. Private insurance also exists from for-profit companies and is primarily utilized by wealthier individuals to cover services not provided under public insurance. The UEBMI is financed mainly from employee and employer payroll taxes, with minimal government funding, and participation is mandatory for employees in urban areas. The urban resident basic medical insurance, which is voluntary at the household level, is utilized by self-employed individuals, children, students, and elderly adults. Both urban employment-based and urban resident basic medical insurance are administered by the Ministry of Human Resources and Social Security and run by local authorities. The URBMI is administered mainly by the National Health and Family Planning Commission and run by local authorities, is also voluntary at the household level representing a coverage rate of 98.9 percent of rural residents in 2014. The RNCMS is for urban resident basic insurance and the new cooperative medical scheme is financed mainly by government, with minimal individual premium contributions [15].
Coordination between tiers is weak between the different levels of healthcare provision, with each increasing tier offering more advanced and complex services at higher out of pocket costs. To help bridge the gap in coverage, cost, and quality of care between the rural and urban areas, China introduced a government-run voluntary insurance program known as the New Rural Cooperative Medical Scheme. Complementary private health insurance is purchased to cover deductibles, copayments, and other cost-sharing, as well as coverage gaps, in publicly financed health insurance, which serves as the primary coverage source for most people. Purchased primarily by higher-income individuals and by employers for their workers, private insurance often enables people to receive a better quality of care and higher reimbursement, to patients as some health services are very expensive or are not covered by public insurance. Growth in private coverage has been rapid, with some foreign insurance companies recently entering the market [16].
Over the past couple of decades, China has experimented with several different methods for financing their healthcare system. In 2014, China spent approximately 5.6% of its GDP on healthcare (Table 4). 30% of healthcare expenses were financed by the central government or local governments, 36% were funded by publicly financed health insurance, private insurance, or third-party donations, and 34% was funded by out of pocket payments. Social-insurance expenditures, government spending, and out of pocket payments are the main sources of financing for healthcare in China [15].
|
Variables |
Coefficient |
Standard Error |
P>|t| |
95% Conf. Interval |
|
Independent variables |
||||
|
Predisposing factor |
||||
|
· Ageing |
-0.003 |
0.001 |
0.045 |
-0.01~0.00 |
|
· Education |
-0.015 |
0.006 |
0.0017 |
0.01~0.02 |
|
Enabling factor |
||||
|
· Government health insurance |
0.747 |
0.159 |
0 |
0.43~1.06 |
|
· Rural health insurance |
0.224 |
0.144 |
1.12 |
-0.05~0.50 |
|
· Commercial health insurance |
0.002 |
0.15 |
0.989 |
-0.29~0.29 |
|
· Urban employee basic health insurance |
0.441 |
0.155 |
0.005 |
0.13~0.74 |
|
· Urban residential basic health insurance |
0.321 |
0.163 |
0.05 |
0.01~0.64 |
|
Reinforcing factor |
||||
|
· Chinese dietary government guidance |
0.096 |
0.058 |
0.103 |
-0.01~0.06 |
|
· Living in urban |
-0.255 |
0.088 |
0.004 |
-0.4~-0.1 |
|
Socio-Economic and health Behavioral factors |
||||
|
· Activity |
-0.029 |
0.046 |
0.531 |
-0.12~0.06 |
|
· Health status |
-0.059 |
0.027 |
0.034 |
-0.1~-0.00 |
|
· Income |
1.40E-07 |
1.10E-06 |
0.903 |
2e-06~2e-06 |
|
· Sedentary activities |
0.035 |
0.028 |
0.211 |
-0.01~0.90 |
|
Constant |
1.146 |
0.283 |
0 |
0.58~0.17 |
|
Number of observations |
646 |
|||
|
F[13,632] |
5.3 |
|||
|
Prob>F |
0 |
|||
|
R-squared |
0.0984 |
|||
|
Adjusted R-squared |
0.0798 |
|||
Publicly financed insurance covers primary care, specialist care, emergency department visits, hospital, mental health care, as well as prescription drugs and traditional medicine. A few dental services and optometry services are covered, but mostly such services are paid for completely out-of-pocket. Additionally, home care and hospice care are often not included either. Local health authorities define the benefit packages. Preventive services such as immunization and disease screening are included in a separate public-health benefit package funded by central and local governments. Coverage is person-specific; there are no family or household benefit arrangements. When it comes to cost-sharing and out-of-pocket spending, Inpatient and outpatient care including prescription drugs, are subject to different deductibles, coinsurance, and reimbursement ceilings (Chart 3). There are no annual caps on out-of-pocket spending [17].
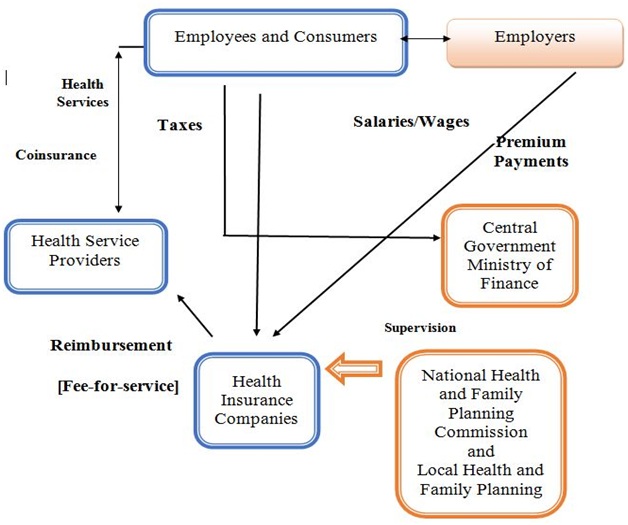
Chart 3: Flowchart of Healthcare Services in China.
[National Health Insurances System]
How do we integrate healthcare to have better health outcomes to improve effectiveness, efficiency, accessibility, and equity?
The following is the brief discussion about “effectiveness, efficiency, accessibility and equity” to sustain health and healthcare system. For (Figure 1), an integrated healthcare system consists of a high degree of collaboration and communication among health professionals and a framework of healthcare services. This integrated framework should include the accessibility, the efficiency and the effectiveness of healthcare services. The primary goals of healthcare integration are (a) to challenge an ever-increasing rise in healthcare costs; (b) to provide instruments to restrain unnecessary service utilization; (c) to produce cost efficient healthcare delivery; and (d) to yield cost effective healthcare services as shown effective in (2) and (4) in “4-Quality of care,” and efficiency (3) in “5-Efficiency” in figure 1. The benefits of an integrated healthcare approach extend to patients, caregivers, providers, and the larger health care system. Thus, there are four components that dictate the quality of a healthcare system: cost effectiveness, efficiency of healthcare services, accessibility, and equity.
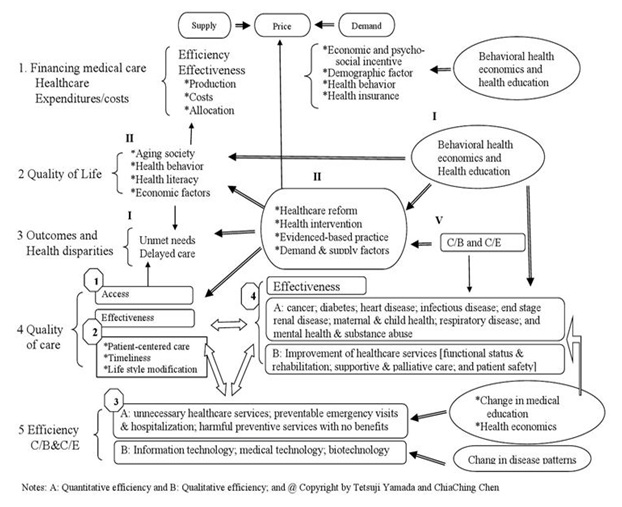
Figure 1: Behavioral Health Economics and Integration of Healthcare.
Effectiveness of care, (2) and (4), in “4-Quality of care” in figure 1 is organized into ten clinical areas: cancer, diabetes, heart disease, infectious disease, end stage renal disease, maternal and child health, respiratory disease, disparity in access, the disparity in quality, and disparity in health outcomes. The US healthcare system is largely fragmented into different organizations. Thus, the integrated system is of fundamental importance. Figure 1 presents an integration of healthcare while accounting for behavioral health economic features. Furthermore, there are three healthcare services in (B) in Effectiveness section (4): functional status preservation and rehabilitation; supportive and palliative care; and patient safety.
Efficiency as illustrated in (A) of (3) of “5-Efficiency” in Figure 1, represents quantitative efficiency, such as unnecessary healthcare services; preventable emergency visits and hospitalization; and harmful preventive services with no benefits. This study also notes that information technology; medical technology; and biotechnology are other types of vehicles which increase qualitative efficiency. For the cost-effective point of view, efficiency includes the overuse of healthcare services, preventable emergency visits and excess hospitalization, and harmful preventive services where the benefits have not materialized.
Accessibility causes disparities in healthcare access and outcomes, which can be found in (1) in "4-quality of care” and “3-Outcomes and Health Disparities" in figure 1. Disparity in health among the population and disparity of outcomes remain a significant issue. Disparities caused by external factors in healthcare are related to financial barriers, the usual source of healthcare, and health insurance status that often cause unmet needs and delayed healthcare. As a result, quality of access of external factors stems from financial barriers [e.g. out-of-pocket expenses]; unable to get or delayed in getting needed healthcare services; usual and specific source of healthcare; and health insurance status. For internal factors in “4 Quality of care” in 4, the supply side of healthcare is: patient-centered care; timeliness of healthcare; and lifestyle modification in (2) and are sources of health disparities. If services are available and there is an adequate supply of services, then the opportunity to obtain healthcare exists. Accessibility also depends on financial, organizational, and social or cultural barriers that limit the utilization of services. Utilization is also dependent on the affordability, physical accessibility and acceptability of services in figure 1.
Health equity is affected by two significant aspects as a minimum: (1) an individual’s ability to produce or sustain his or her health and (2) accessibility of healthcare services [18,19]. Accessibility of healthcare services, for example the relationship between a healthcare provider and a patient, is a vital factor that affects individual health equity. Financial and time costs are factors that have an influence on the amount of healthcare service used [20]. Accessibility of healthcare services is defined as an availability of private and public health insurance, and the ability to obtain and use health and healthcare knowledge, and other socio-economic and demographic characteristics. Differences in these factors create and enlarge the gap of health disparity [21].
METHOD
Empirical Framework and a Model
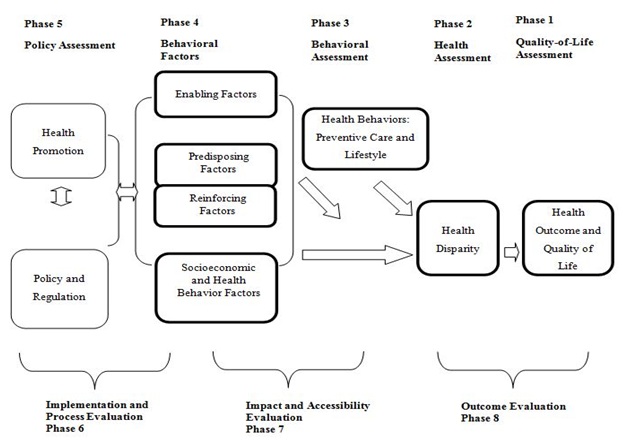
Figure 2: Application of PRECEDE-PROCEED model to examine health behaviors [preventive care and lifestyle], health disparity and health outcomes.
Note: 1. Green & Kreuter, Health Promotional Planning, 4th ed., Mayfield, 2005.2. Glanz, Rimer, Lowis, Health Behavior and Health Education, 3rd ed., Jessey-Bass, 2002 @ Copyright by Tetsuji Yamada and ChiaChing Chen
“Predisposing factors” involve the personal motivations to change behavior. These motivations are based on subjective knowledge, awareness, personal attitudes, values, attitudes, beliefs, perceived values, perceived needs, perceptions, religion, ethnicity, cultural background, etc.
“Reinforcing factors” encompass the different types of feedback and rewards pertaining to good health behaviors and healthy life style. Reinforcing factors facilitate a person’s motivation for behavioral change and can be altered through direct communication. For example, the intensity of communication with parents and friends, peer pressure, enactment of regulations, rules or laws, are related to reinforcing factors. For government policy and regulation as a measure, this study has considered taxes, income equality, social security, and the burden of healthcare expenditures.
A model for health promotion should include three types of factors which are related to decision-making behavior: predisposing, reinforcing, and enabling factors. The conceptual model for a comparative health behavioral analysis is an application of the extended PP model on the effectiveness in different health insurance systems (a national health insurance system in China; a universal health insurance in Japan, and a mixed health insurance system in the United States), on preventative breast cancer behavior, and on assessing health disparity and outcomes by considering predisposing, enabling, and reinforcing factors. The basic structural model for this empirical analysis is: HBi=β0+β1PRi+β2ENi+β3REi+β4SEi+e….. (Equation 1).
Equation 1 represents the relationship between the health behavioral changes of women “i” for a preventive care and the decision-making behavior a woman faces, as seen in (Figure 3). The term “e” is an unobserved error, assumed to satisfy E [e| PR, EN, RE, SE]=0. Enabling (EN), Predisposing (PR), Reinforcing (RE), and Socio-Economic (SE) factors will influence Health Behaviors (HB, i.e. preventive care for breast cancer). Similarly, health behaviors are incorporated in the extended PP model in order to observe decision-making health behavior and influential determinants [20,21]. In summary, multivariable regression analyses will be performed in order to evaluate the effectiveness of breast cancer prevention which is related to health outcomes and health disparity. A bivariate probit model is used by controlling for socio-economic, demographic and healthcare financing factors to investigate health outcomes by different healthcare programs in China, Japan and the USA.
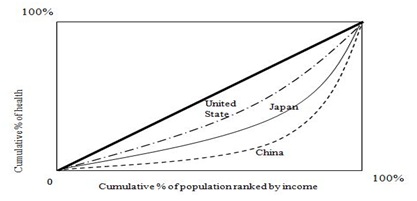
Figure 3: Concentration curves: Health and Income.
Various components, as well as the amount of time invested in health within the family/individual, in?uence a woman’s health status. The education level, income, health literacy level, and cultural aspects are associated with health behavior. Years of education represents the health capital which is related to the health knowledge that would lead them to raise health stock. Income is an important determinant of the health of women, as higher income implies a higher stock of health.
Optimizing the health of populations is a critical issue in the United States and worldwide. It is a complex problem that requires collaboration among diverse sectors: healthcare providers, government and its policymakers, education, media, and communities, to publicize the health of people. Socioeconomic disparities are deeply associated with mental and physical health outcomes. For physical and environmental domains, this study employs Grossman’s concept [18,19] about the separable impact of the education and income on women’s health in health capital factors. This study assumes that health is measurable and interpretable as a ?ow per unit of time because women need heterogeneous healthcare. Individual healthcare needs are attributed to the physical and environmental domains that are related to preventive healthcare.
Data
The BRFSS conducts telephone-based surveys and interviewers, who have experience conducting telephone surveys with additional training, collect data from randomly selected adults in a household and manages state health departments which conduct interviewers. The state departments sample disproportionately from strata that correspond to sub-state regions to provide adequate sample sizes. The sample records use a disproportionate stratified sample design with a probability sample of all households. The high-density and medium-density strata contain telephone numbers that are expected to belong mostly to households. The data are then transmitted to the CDC for editing, processing, weighting, and analysis. Many questions are taken from established national surveys, such as the National Health Interview Survey or the National Health and Nutrition Examination Survey.
For the Chinese data, it comes from the China Economic, Population, Nutrition, and Health Survey 2011 Adult Questionnaire (about 30 thousand samples) [CEPNH]. The data survey was designed to cover public health risk factors, health outcomes, demographic and social factors at the individual, household and community levels. The data includes limited clinical information, drinking, smoking, physical activities, dietary intake, individual health-related data, living arrangement, use of health services, marriage, age, activities of daily living, occupation, income nutritional status, occupation, etc. The CEPNH sample was randomly selected and captured economic, health and demographic circumstances in eight provinces: Liaoning, Shandong, Henan, Jiangsu, Hubei, Hunan, Guizhou, and Guangxi from the north to the south in China. The data collection process was a multistage, random cluster process to draw the sample in each of the provinces. Ages ranges from 8 to 98 years old. The CEPNH contains the ability to capture heterogeneity of population and documents socio-economic, behavioral and health status variation/changes.
For the Japanese data, the Japanese Study of Aging and Retirement (JSTAR), the Global Centers of Excellence (COE) Survey (about 5.5 thousand samples) conducted in 2011 by Osaka University in Japan were used. JSTAR 2011-1st-wave-3-cities or/and JSTAR 2011-2nd-wave-3-cities is the current study has been using the following variables/factors: social aspects, economic aspects, demographic aspects health and mental aspects, behavioral aspects, and environmental aspects. We just need the following additional information, illness history [experiences] and preventive care/health screening experiences to evaluate health behaviors. We evaluate breast cancer preventive behaviors of adult women and their life style/health in Japan.
The JSTAR was designed and carried out jointly by the Research Institute of Economy, Trade, and Industry and Hitotsubashi University in Japan, and the University of Tokyo. The JSTAR is a globally comparable data survey of the elderly, which is similar to the Health and Retirement Study (HRS) in the United States. The design of JSTAR is also similar to the Survey of Health, Ageing and Retirement in Europe (SHARE), and the English Longitudinal Study of Ageing (ELSA). The 2011 wave was conducted in September and October and collected data on individual living circumstances of 4,500 persons between 50 and 80 years in three municipalities: Hiroshima city in Hiroshima prefecture, Chofu city in Tokyo, and Tondabayashi in Osaka.
The survey has two units of observation: individual and household. A household is a single individual or individual with his/her spouse, whichever is applicable. Unlike the HRS, the JSTAR only interviews one respondent per household but the survey includes several questions to the respondent about the spouse. The JSTAR covers a wide range of information including: income, wealth, working status, family structure, relationship with family members and neighborhood, capacity of memory and cognitive, health conditions, medical care, and nursing care.
RESULTS
Empirical Results
|
Life expectancy [health] |
Concentration index |
Standard errors |
|
China |
0.0159b |
0.041 |
|
Japan |
0.0085b |
0.042 |
|
United States |
0.0065b |
0.043 |
T-statistics by standard error: standard errors of the concentration index using formula/covariance method. a, b, and c represent statistically significant levels of 99% level (a), 95% level (b), and 90% level (c) for a two-tailed test.
|
Variables |
Min. |
Max. |
Mean |
# of Observation |
|
Dependent variable |
1 |
3 |
0.25 |
2867 |
|
Independent variables Predisposing factor |
||||
|
• Ageing [Age variable is an aging process of socio cultural maturity] unit of value is years. |
18.03 |
98.94 |
52.28 |
44246 |
|
• Know about Chinese dietary guidelines (0=no, 1 =yes) Enabling factor |
0 |
1 |
0.114 |
50446 |
|
• Education, years of education |
0 |
18 |
7.786 |
39929 |
|
• Government health insurance [0=no and 1=yes] |
0 |
1 |
0.731 |
36966 |
|
• Rural health insurance [0=no and 1=yes] |
0 |
1 |
0.611 |
38035 |
|
• Commercial health insurance [0=no and 1=yes] |
0 |
1 |
0.039 |
37955 |
|
• Urban employee basic health insurance [0=no and 1=yes] |
0 |
1 |
0.211 |
37978 |
|
• Urban residential basic health insurance [0=no and 1=yes] |
0 |
1 |
0.143 |
37967 |
|
Reinforcing factor |
||||
|
• Chinese dietary government guidance [1= a person does not know and 2= person knows the guidance] |
1 |
2 |
1.885 |
50446 |
|
• Living in urban [0=no and 1=yes] |
0 |
1 |
0.412 |
39963 |
|
Socio-Economic and health Behavioral factors |
||||
|
• Activity: activities of preferences indicators [martial arts; gymnastics/dancing/acrobatics; track and field/swimming; soccer/basketball/tennis; badminton/volleyball; and ping pong/tai chi] [1=dislike very much ~ 5=like very much] |
6 |
30 |
16.18 |
39929 |
|
• Health status [1=very bad, 2=bad, 3=fair, 4=good, and 5 very good) |
1 |
5 |
3.508 |
26377 |
|
• Income [total annual individual income, yuan] |
-1e+5 |
6e+5 |
29846 |
29846 |
|
• Sedentary activities [7 sedentary activities: TV watching, videotapes, watching movies/videos online, video games, surfing internet, participation in chat rooms, and playing computer games |
0 |
7 |
1.327 |
48707 |
|
Variables |
Min. |
Max. |
Mean |
# of Obs. |
|
Dependent variable |
||||
|
· Brest cancer prevention [1=yes, otherwise=0] |
1 |
2 |
0.327 |
2634 |
|
Independent variables |
||||
|
Predisposing factor |
||||
|
· Ageing [Age variable is an aging process of socio-cultural maturity] The unit value is years. |
22 |
78 |
51.89 |
2634 |
|
· Education [Number of years]. |
9 |
19 |
11.995 |
2634 |
|
· Risk taker: 0~18 [0=highest risk and 18=most risk averse] |
0 |
18 |
14.053 |
2634 |
|
Enabling factor |
||||
|
· Private employment HI: Private employment health insurance [1=yes and 0=no] |
0 |
1 |
0.365 |
2634 |
|
· Government employment HI: Government employment health insurance [1=yes and 0=no] |
0 |
1 |
0.045 |
2634 |
|
· Self-employed HI: Self-employed health insurance [1=yes and 0=no] |
0 |
1 |
0.112 |
2634 |
|
· Out-of-pocket: Out-of-pocket costs per outpatient visit [1=less than $10, 2=$10-$20, 3=$20-#30, 4=$30-$40, 5=$40-$50, and 6=$50 and more] |
1 |
6 |
1.723 |
2634 |
|
Reinforcing factor |
||||
|
· Marital status 1=yes married and 0=no |
0 |
1 |
0.784 |
2634 |
|
· Health checkup by local municipality: Health checkup organized by local municipality: 1=yes and 0=no |
0 |
1 |
0.278 |
2634 |
|
· Health checkup by employer: Health checkup organized by your employer: 1=yes and 0=no. |
0 |
0 |
0.345 |
2634 |
|
Socio-Economic and health Behavioral factors |
||||
|
· Anxieties: I have anxieties about my health. [1=strongly ~ 5=least anxiety of health] |
1 |
5 |
2.885 |
2634 |
|
· Stress: I have feeling stressed lately. [1=strongest stress ~ 5=least stress] |
1 |
5 |
2.749 |
2634 |
|
· Income [Approximately how much is the annual earned income of you before taxes, including bonuses and business income? [1=none; 2= less than 1million yen; 3=1millin~2million yen; 4=2million yen~4million yen; 5=4million yen~6million yen; 6=6million yen~8million yen; 7=8million yen~10million yen; 8=10million yen~12million yen; 9=12million yen~14million yen; and 10=14million yen and more.] |
1 |
10 |
2.312 |
2634 |
|
· Smoke status: [0=I never smoke; 1=I used to smoke but I quit; 2=I hardly smoke; 3=I occasionally smoke; 4= I smoke about 1~4 cigarettes per day; 5=I smoke 6~10 cigarettes per day; 6=I smoke 11~20 cigarettes per day; 7=I smoke 21~30 cigarettes per day; 8=I smoke 31~40 cigarettes per day; 9=I smoke 41cigarettes more per day |
0 |
9 |
0.694 |
2634 |
|
· Exercise: How often do you exercise? [ 1=almost every day; 2=a few times a week; 3=about once a week; 4=about once a month; and 5=don’t exercise at all.] |
1 |
5 |
4.029 |
2634 |
|
· Alcohol drink: Do you drink alcoholic beverages? [1=don’t drink at all; 2=hardly drink few times a month or less; 3=drink sometimes (a few times a week); 4=a can of beer (12oz)or its equivalent; 5=3 cans of beer (12oz x 3) or its equivalent; 6=5 cans of beer (12oz x 5) or its equivalent] |
1 |
6 |
2.082 |
2634 |
|
Variables |
Min. |
Max. |
Mean |
# of Observation |
|
Dependent variable |
||||
|
· Brest cancer prevention (1=no, 2=yes) |
1 |
2 |
1.179 |
29959 |
|
Independent variables |
||||
|
Predisposing factor |
||||
|
· Ageing [Age variable is an aging process of socio-cultural maturity] 13 levels of age categories: 1=18-24; 2=25-29; 3=30=34; 4=35-39; 5=40-44; 6=45-49; 7=50-54; 8=55-59; 9=60-64; 10=65-69; 11=70-74; 12=75-79; 13=80 and over]. |
1 |
13 |
7.603 |
287321 |
|
· Education [What is the highest grade or years of school completed? 1= kindergarten or less; 2= grad 1 through 8; 3=9-11; 4=12-; 5= college 1 year to 3 years; 6= college 4 years or more]. |
1 |
6 |
4.853 |
289201 |
|
· Race: |
||||
|
Race-White =1 otherwise=0; |
0 |
1 |
0.781 |
290498 |
|
Race Hispanic=1, otherwise =0; |
0 |
1 |
0.076 |
290498 |
|
Race-African American=1, otherwise=0; |
0 |
1 |
0.081 |
290498 |
|
Other=1, otherwise=0. |
0 |
1 |
0.062 |
290498 |
|
Enabling factor |
||||
|
· Age 18-64 with healthcare coverage by health insurance, 0=no and i=yes. |
0 |
1 |
0.554 |
290498 |
|
· Medical bill [Currently have medical bills, 1=no and 2=yes] |
1 |
2 |
0.611 |
207440 |
|
· Medical costs [Could not get medicine because of costs, 1=yes with problem otherwise=0] |
0 |
1 |
0.081 |
207553 |
|
Reinforcing factor |
||||
|
· Marital status 1=no and 2=yes |
1 |
2 |
1.817 |
280442 |
|
· Metropolitan status [1=in the center city of an MSA; 2=outside the center city of an MSA but inside the county containing the center city; 3=inside a suburban county of the MSA; 4=in an MSA that has no center city; and 5=not in an MSA.] |
1 |
5 |
2.921 |
222402 |
|
Socio-Economic and health Behavioral factors |
||||
|
· Poor health [number of days of mental and physical health, not good, for the past month] |
0 |
30 |
5.271 |
248663 |
|
· Income [Your annual household income from all sources: 1=less than $10,000; 2=less than 15k; 3= less than 20k; 4=less than 25k; 5=less than 35k; 6=less than 50k; 7=less than 75k; 8=75k and more.] |
1 |
8 |
5.586 |
242228 |
|
· Alcohol: number of drinking days per month 0~30 days. |
0 |
30 |
4.557 |
281209 |
|
· Smokeless tobacco: Use of smokeless tobacco products [1=everyday; 2=some days; 3=not at all] |
1 |
3 |
2.949 |
282457 |
|
· Salt intake: watching sodium or salt intake [1=yes and 2=no] |
1 |
2 |
1.422 |
128150 |
Table 7: Descriptive statistics of variables used in the present study [the US].
|
Variables |
Coefficients |
Standard Error |
P>Z |
95% Conf. Interval |
|
Independent variables |
||||
|
Predisposing factor |
||||
|
· Aging |
0.137 |
0.028 |
0 |
0.08~0.19 |
|
· Education |
-0.123 |
0.061 |
0.043 |
-0.24~-0.01 |
|
· Race |
||||
|
Race-White |
2.271 |
1.007 |
0.024 |
0.29~4.24 |
|
Race-African American |
2.426 |
1.015 |
0.017 |
0.43~0.41 |
|
Race Hispanic [reference] |
--- |
--- |
--- |
--- |
|
Other |
2.179 |
1.047 |
0.017 |
0.12~4.23 |
|
Enabling factor |
||||
|
· Age 18-64 with healthcare insurance coverage |
0.386 |
0.153 |
0.012 |
0.08~0.68 |
|
· Medical bill |
-0.263 |
0.125 |
0.037 |
-0.51~-0.01 |
|
· Medical costs |
-0.026 |
0.17 |
0.875 |
-0.36~-0.31 |
|
Reinforcing factor |
||||
|
· Marital status |
-0.253 |
0.128 |
0.05 |
-0.5~-0.00 |
|
· Metropolitan status |
-0.048 |
0.033 |
0.154 |
-0.11~0.01 |
|
Socio-Economic and health Behavioral factors |
||||
|
· Poor health |
-0.001 |
0.007 |
0.818 |
-0.02~0.01 |
|
· Income |
-0.108 |
0.032 |
0.001 |
-0.2~-0.1 |
|
· Alcohol |
-0.042 |
0.017 |
0.014 |
-0.1~-0.0 |
|
· Smokeless tobacco |
0.167 |
0.487 |
0.731 |
-0.78~1.12 |
|
· Salt intake |
-0.108 |
0.122 |
0.736 |
-0.34~0.13 |
|
Number of observations |
12225 |
|||
|
LR chi-square (21) |
211.7 |
|||
|
Prob>Chi square |
0 |
|||
|
R-squared |
0.064 |
|||
|
Log likelihood |
-1549.18 |
|||
|
Variables |
Coefficient |
Standard Error |
P>Z |
95% Conf. Interval |
|
Independent variables |
||||
|
Predisposing factor |
||||
|
· Ageing |
0.016 |
0.004 |
0.001 |
0.00~0.02 |
|
· Education |
0.128 |
0.029 |
0 |
0.07~0.18 |
|
· Risk taker |
0.006 |
0.013 |
0.612 |
-0.01~0.03 |
|
Enabling factor |
||||
|
· Private employment HI |
0.193 |
0.127 |
0.131 |
-0.5~0.44 |
|
· Government employment HI |
0.92 |
0.237 |
0 |
0.45~1.38 |
|
· Self-employed HI |
-0.014 |
0.161 |
0.927 |
-0.33~0.30 |
|
· Out-of-pocket |
0.016 |
0.036 |
0.651 |
-0.05~0.08 |
|
Reinforcing factor |
||||
|
· Marital status |
0.594 |
0.122 |
0 |
0.35~0.83 |
|
· Health checkup by local municipality |
1.526 |
0.109 |
0 |
1.31~1.74 |
|
· Health checkup by employer |
1.035 |
0.115 |
0 |
0.80~1.26 |
|
Socio-Economic and health Behavioral factors |
||||
|
· Anxieties |
-0.09 |
0.054 |
0.098 |
-0.19~0.01 |
|
· Stress |
-0.18 |
0.062 |
0.004 |
-0.3~-0.1 |
|
· Income |
0.061 |
0.039 |
0.121 |
-0.01~0.13 |
|
· Smoke status |
-0.167 |
0.036 |
0 |
-0.01~0.13 |
|
· Exercise |
-0.114 |
0.033 |
0.001 |
-0.2~-0.10 |
|
· Alcohol drink |
-0.025 |
0.043 |
0.554 |
-0.11~0.05 |
|
Number of observations |
2634 |
|||
|
LR chi-square (21) |
462.96 |
|||
|
Prob>Chi square |
0 |
|||
|
R-squared |
0.1389 |
|||
|
Log likelihood |
-1434.5 |
|||
Interestingly, the Chinese Government’s health policy of oriented guidance of health insurance is working to mitigate a rapid increase in healthcare expenditures. Women with government health insurance, urban employee health insurance, or urban residential health insurance tend to take breast cancer examinations at less costly places such as clinics and other facilities. Table 4 also demonstrates the fact that women who live in urban areas generally take breast cancer examinations at hospitals.
In the US, evidence shows that the aging process is related to socio-cultural maturity, with experiences influencing health behaviors and women’s value of health. A healthier, longer life span with an increase in life expectancy needs to sustain a healthy stock of body with breast cancer prevention [17]. This sustainable health durability is quality of life. Unlike China and Japan, there are different races in the US. Their socio demographic and cultural backgrounds also influence women’s health behaviors. The variable “race” undoubtedly demonstrates the different health behaviors between races. White and African American women are more likely to engage in breast cancer prevention than Hispanic women.
The US health care system is a mixed healthcare service of delivery and financing. Since the implementation of the Affordable Care Act, the uninsured population has declined from about 45 million people in 2013 to 28 million people in early 2017. The variable, age 18-64, in “Enabling Factors” shows that the result is statistically significant and insured women are more likely to engage in breast cancer prevention behavior than the uninsured women. The negative sign of “marital status” in “Reinforcing Factors” is theoretically correct. In general, married women have healthier behaviors than single individuals because of their spouses also care for their health.
Furthermore, the negative, statistically significant income coefficient of the US women in table 8 differs from the respective coefficient from China and Japan. Women with high income are less likely to engage in breast cancer prevention because of their more valuable time in monetary terms. Commonly, a rational individual woman will choose her health utility which is derived through her prevention behaviors. The women allocate discretionary labor income and earnings to purchase healthcare services in the US mixed healthcare system. Thus, an increase in income raises an accessibility of healthcare services. As a result, consumption of healthcare services increases. The negative effect tends to discourage woman’s preventive healthcare activities because of the high opportunity cost. The aforementioned potential and logical applications also demonstrates the evidence among Japanese women in table 9.
For Japanese women, the primary parameter of interest in this study is the influence of educational attainment as a health literacy indicator, in addition to the effect of income on health behavior, i.e. breast cancer prevention. Education increases both health literacy to have a sustainable healthy life as well as human capital, i.e. labor productivity. The Japanese evidence demonstrates this line of argument in table 9 as the Chinese women show the similar evidence in table 4.
The key parameter of “Enabling Factors” is health insurance. Women with government health insurance are more likely engage in breast cancer prevention. The government health insurance provides undeniably better health insurance coverage compared to “self-employed” or “private employment” health insurance coverage under the universal health insurance system in Japan. The coefficient of government health insurance is the only statistically and positively significant outcomes among the three types of health insurances. There are common outcomes among women in the three countries. Women with mental health problems, smoking behavior, alcohol intake, and physical weakness have a tendency to avoid utilizing cancer prevention services.
Health and Income Disparity
|
Infant mortality [health] |
Concentration index |
Standard errors |
|
China |
-0.2666c |
0.066 |
|
Japan |
-0.1241c |
0.059 |
|
United states |
-0.0487c |
0.052 |
Concentration Index: Increase in Income per
DISCUSSION AND POLICY IMPLICATIONS
The rapid surge in national health care expenditures is a mounting burden on the governments of China, Japan and the US and its citizens. In addition, there are income and health disparities within and among the countries. This study addresses and evaluates behaviors of preventive care of women in different countries and under different healthcare systems (the national health insurance system in China, the universal health insurance system in Japan, and the mixed health insurance system in the US). The study identifies the importance of educational attainment for health behaviors as well as income earnings. Age-standardized breast cancer incidence and mortality rates have risen rapidly in China during the past 2 to 3 decades, making it the leading cancer among women [28]. The onset of the average age of breast cancer has recently become younger in China, Japan, and the US. Breast cancer is the number one leading cause of death among women in Japan, the 6th in China, and the 5th in the US.
The study proposes a diagrammatic presentation to describe how formal and informal health education is imperative to maintain a sustainable healthy life with increases in health stock. (Figure 5) presents the influences of health education on health disparity and on government healthcare spending.
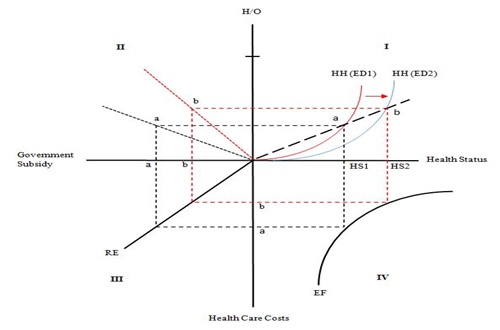
Figure 5: Influence of Health Education on Health and Health Status with a Decreasein Govement Health Spendings.
Assumption of Figure 5:
The assumptions are that society consists of two identical individuals. An individual’s preference and consumption does not affect other utility functions. The individual preferences are not necessarily homothetic. The individual function is homogeneous of degree 0 in income and prices. The relative prices of goods and services affect their consumption combination through changes in production mix. The general increase in cost level does not change the consumption bundle because the relative prices remain constant. Both individuals consume health goods, services, and a composite good. Both individuals produce health service goods and a composite good. Both individuals’ health status changes by income level. The efficient production set is non-linear, and their capital labor ratios are different. Specifically, health goods are relatively more capital intensive than the composite good. Finally, there are no externalities in consumption and production.
Brief explanation of Figure 5:
The relative price of both goods raises HH (ED1) such that the unique price ratio of goods H and Q equals the marginal rate of substitution. For the EE curve in Quadrant IV, there are two ways to assess efficiency: efficient resource allocation and efficiency of technological development of delivery of healthcare services. An increase in health education attainment makes a shift in the HH line from ED1 to ED2 and raises health status from HS1 to HS2 along the health status axis. The health educational effect goes from quadrant IV through quadrant III. An increase in health status reduces healthcare costs from “a” to “b” on the vertical axis of healthcare costs. The chain reaction of this influence reduces the government subsidy for an individual from “a” to “b” on the horizontal axis of government subsidy in quadrant III.
Our empirical study shows educational attainment in a formal and informal form. The Chinese dietary government guidance, for example, generally raises women’s health knowledge and skill, as well as the promotion of breast cancer prevention. However, primary preventative care has received little attention in China, partly because of an insufficient knowledge of risk factors for breast cancer among Chinese women [24]. Although the US has the mixed healthcare financing and delivery system, there is a primary care doctor system which has a large influence on health behaviors in general. China and Japan do not have a primary physician system. It would be prudent to implement a primary physician approach to get informal health education from the primary physician who encourages patients to engage in preventive behaviors.
Another noteworthy finding about health disparity is that the concentration index study shows that income, health, and health disparity are generally exogenously determined. However, income influences health status and has a significant effect on health disparity. Health in China is disproportionately large and distributed towards the right on the horizontal axis as the form of cumulative % of population ranked by income. This result is different from Japan and the US. Improper income distribution with health exists among low income populations. However, it should be noted that China has been experiencing a rapid increase in life expectancy for the past decade. Thus, income level affects health and then health affects human stock, which is related to human productivity. If this process is disconnected, the proper process is terminated, and the result would be greater income disparity among individuals within a country and among countries in the world.
Health disparity not only stems from formal and informal health education, which are deeply interconnected to health literacy, but also from income, access to healthcare services, and a nation’s healthcare system, etc. Findings for China, Japan, and the US reveal that different types of health insurance under the different healthcare systems have a great impact on preventive health behaviors. The government financed/organized healthcare financing have a more effective influence in China and Japan than in the US. The study also discloses that risky health behaviors (addiction, alcohol intake, and smoking) and mental health aspects are negatively associated with preventive healthcare behaviors. Mental aspects are partially triggered by the globalized economy and its competitive market environment. As a result, individuals suffer from stress, depression, anxiety, and loneliness.
Managed healthcare with a capitation-based system dominates the mixed healthcare system in the US while China, with the national healthcare system, and Japan, with the universal healthcare system, implement the cost-based fee-for-service healthcare system. Moving from the cost-based fee-for-service system to the capitation system is a viable option to mitigate ever-increasing healthcare spending and to have a sustainable welfare program.
CONCLUSION
The study is limited in that the Chinese data does not clearly state a variable for “breast cancer prevention”, the observation size is reduced by large missing values, and shows a very significant amount of negative income which we are not familiar with. The study is implemented with our very limited knowledge of China’s healthcare financing and delivery systems. We separated women from men in order to examine women’s preventive health behaviors by focusing on breast cancer. Ina behavior study such as this it might be better to include more than a one-term cross sectional evaluation data, since this study focuses on a three-country comparison analysis on health and healthcare under different healthcare systems with different socio-cultural aspects. A development of human capital, i.e. health stock, will reduce government healthcare spending. Despite these limitations, this study has identified some issues and has made contributions to the existing literature regarding differing healthcare systems, differing health and health behavior, health and income disparity, and health and education. Insurance coverage is an important factor to increase the health and longevity of the population. Future studies would improve and scrutinize the complex nature of the various aspects of health and income disparities that influence health and income disparities in different healthcare systems in socio-culturally different countries. Managed healthcare financing is an effective alternative to curb ever-increasing healthcare costs.
ACKNOWLEDGEMENT
We are grateful to Michael Grossman and would like to thank Ling Cai Yuan and Artin Haghshenas for their research assistance at Rutgers University, the State University of New Jersey, USA. The data used are supported by the Global Centers of Excellence Program, ISER, and Osaka University. We acknowledge the research support provided by the Research Council of Rutgers University (#2-02243 and #2-02089), the State University of New Jersey, United States. The early version of the manuscript was presented at the Beijing Forum, Peking University in November 2017. Any credits, analyses, interpretations, conclusions and the views expressed in this paper are those of the authors, and do not necessarily reflect those of the institutions.
AUTHOR CONTRIBUTION
Chia Ching Chen and Tetsuji Yamada conceived the idea of this research and designed the framework. Weihong Zeng evaluated the healthcare system of China, Japan and the USA drafted the manuscript. Tetsuji Yamada and Barret Levine analyzed the data and implemented econometric analyses. Chia Ching Chen approved the final manuscript. John Carter managed model and econometric method.
CONFLICTS OF INTEREST
The authors declare no conflict of interest. The founding institution had no role in the design of the study; in the collection, analyses, or interpretation of data; in the writing of the manuscript, and in the decision to publish the results.
REFERENCES
- Stephen B, Tsukasa N, Sistrom, Gilson M (2008) Improving Economic Equity and Health: The Case of Postwar Japan. American Journal of Public Health 98: 589-594.
- Braveman PA, Kumanyika S, Fielding J, Laveist T, Borrell LN, et al. (2011) Health Disparities and Health Equity: The Issue is Justice. American Journal of Public Health 101: 149-155.
- Zheng X, Song X, Chen G, You Y, Ren Q, et al. (2011) Health Inequalities during 20 Years of Rapid Economic Development in China (1980-2000): A Mortality Analysis. Biomed Environ Sci 24: 329-334.
- Gerteis J, Izrael D, Deitz D, LeRoy L, Ricciardi R, et al. (2014) Multiple Chronic Conditions Chartbook: 2010 MEPS Data. Agency for Healthcare Research and Quality U.S. Department of Health and Human Services, Maryland, USA. Pg No: 1-52.
- Xinhuanet (2015) Chronic Disease on Rise in China: Health Survey. XINHUANET, China.
- People’s Daily Online (2016) Nearly 300 Million Chinese People Suffering From Chronic Diseases, People’s Daily Online, China.
- Wang R, Yan Z, Liang Y, Tan EC, Cai C, et al. (2015) Prevalence and Patterns of Chronic Disease Pairs and Multimorbidity among Older Chinese Adults Living in a Rural Area. PLoS One 10: 1-15.
- McGrail KM, van Doorslaer E, Ross NA, Sanmartin C (2009) Income Related Health Disparities in Canada and the United states: A Decomposition Analysis. Am J Public Health 99: 1856-1863.
- Chen CC, Yamada T, Smith J, Chiu IM (2011) Improving Children’s Healthcare through State Health Insurance Programs: an Emerging Need. Health Policy 99: 72-82.
- National Institute of Population and Social Security Research (2014) Social Security in Japan. National Institute of Population and Social Security Research, Tokyo, Japan.
- Ministry of Health, Labor and Welfare (2017) Japanese Health Insurance System: About medical insurance in our country. Ministry of Health, Labor and Welfare, Tokyo, Japan.
- Yamada T, Chen CC, Yamada T, Chiu IM, Worrall JD (2010) Pharmaceutical Price Control Policy, Pharmaceutical Innovation, and Health Durability. The Open Pharmacoeconomics & Health Economics Journal 2: 34-46.
- Japanese Nursing Association (2016) Nursing in Japan. Japanese Nursing Association, Tokyo, Japan. Pg No: 1-20.
- Blumenthal D, Hsiao W (2015) Lessons from the East-China’s Rapidly Evolving Health Care System. N Engl J Med 372: 1281-1285.
- Fang H (2016) The Chinese Health Care System. The Commonwealth Fund, New York, USA.
- Meng Q, Yang H, Wen C, Qiang S, Xiaoyun L (2015) Health System’s in Transition: People’s Republic of China Health System Review. World Health Organization, USA. Pg No: 1-246.
- World Bank Group (2016) Deepening Health Reform in China: Building High-Quality and Value-Based Service Delivery Policy Summary. World Bank Group, Washington, DC, USA.
- Grossman M (1972) The Demand for Health: A Theoretical and Empirical Investigation. Columbia University Press, New York, USA.
- Grossman M (2000) The Human Capital Model. Handbook of Health Economics 347-408.
- Draper DA, Ginsburg PB (2007) Healthcare Cost and Access Challenges Persist Issue Brief Cent Stud Health Syst Change 114: 1-6.
- Oliver A, Sorenson C (2008) On equity in the English National Health Service. Harvard Health Policy Review 8: 100-107.
- Green LW, Kreuter MW (1992) CDC’s Planned Approach to Community Health as an Application of PRECEED and an Inspiration for PROCEED. Journal of Health Education 23: 140-147.
- Green LW, Kreuter MW (2005) Health Program Planning: An Educational and Ecological Approach. (4th edn.), McGraw-Hill Education, New York, USA.
- Yamada T, Chen CC, Yamada T (2005) Economic Evaluation of Relapse Prevention for Substance Users: Treatment Settings and Health Care Policy, in Björn Lindgren, Michael Grossman (ed.) Substance Use: Individual Behaviour, Social Interactions, Markets and Politics (Advances in Health Economics and Health Services Research, Volume 16) Emerald Group Publishing Limited 16: 431-450.
- Kakwani NC, Wagstaff A, Van Doorslaer E (1997) Socioeconomic Inequalities in Health: Mmeasurement, Computation, and Statistical Inference. Journal of Econometrics 77: 87-103.
- Yamada T, Chen CC, Naddelo JJ, Harris JR3rd (2015) Changing Healthcare Policies: Implications for Income, Education, and Health Disparity. Front Public Health 3: 195.
- Ling RE, Liu F, Lu XQ, Wang W (2011) Emerging Issues in Public Health: A Perspective on China’s Healthcare System. Public Health 125: 9-14.
- Lee H, Li JY, Fan JH, Li J, Huang R, et al. (2014) Risk factors for breast cancer among Chinese women: a 10-year nationwide multicenter cross-sectional study. J Epidemiol 24: 67-76.
Citation: Yamada T, Chen CC, Zeng W, Levine B, Carter JM (2018) Global Perspectives of Different Healthcare Systems and Health: Income, Education, Health Disparity, Health Behaviors and Public Health in China, Japan and USA. J Community Med Public Health Care 5: 039.
Copyright: © 2018 Tetsuji Yamada, et al. This is an open-access article distributed under the terms of the Creative Commons Attribution License, which permits unrestricted use, distribution, and reproduction in any medium, provided the original author and source are credited.