Higher Fibrinogen Levels among Patient with End-Stage Kidney Disease Post Initiation of Peritoneal Dialysis: Cardiovascular Risk Attenuation
*Corresponding Author(s):
Issa Al SalmiThe Renal Medicine Department, The Royal Hospital, Muscat, Oman, Oman Medical Specialty Board, Muscat, Oman
Tel:96892709000,
Email:isa@ausdoctors.net
Abstract
Background
Defects in both coagulation initiation and fibrinolysis have been identified in Chronic Kidney Disease (CKD) patients and patients on dialysis may have higher rates of Cardiovascular Disease (CVD) events.
Objectives
This study evaluates the fibrinogen indices in patient on peritoneal dialysis. We analyze cardiovascular risk factors and their relationship with serum Fibrinogen.
Methods
This is an observational study conducted at the Royal Hospital, Muscat, Oman. All demographic, clinical and laboratory data were collected prospectively by computerized medical records system called alshifaa for patients on Peritoneal Dialysis (PD) following at Renal Medicine Department and evaluated monthly for their peritoneal dialysis management from 2011 to 2017.
Results
Total of 64 PD patients were included in this study, of which 48.4% were male. The mean (SD) of age was 46.4 (1.1) years. Three quarters of total patients (74.6%) on PD had high level of fibrinogen (> 4.2mg). The mean (SD) of age and weight for patients with high fibrinogen level was 48.7(20.7) year and66.8kg, respectively. Hyperfibrinogenemia was associated with chronic diseases, of which 77%, 75% and 86% of patients with high serum fibrinogen were diabetic, hypertensive, and with cardiac disease, respectively. There were45%,93.6%%, 42.6%% and 28.3%% of total patients on PD having high blood glucose, hypoalbuminemia, hyperphosphatemia, and high cholesterol level, respectively had high Fibrinogen level.
Conclusion
PD patients have high serum fibrinogen level. Fibrinogen level increase with aging, overweight and the present of chronic diseases. The continuous nature of PD, with the long-term concomitant exposure to glucose-based dialysate, can create significant metabolic derangements including high fibrinogen level. The high level is associated with major cardiovascular risk factors. Hence, there is a need for stringent management strategies to control various risk factors to improve the cardiac morbidity and mortality among peritoneal dialysis patients.
Keywords
Cardiovascular disease; End stage kidney disease; Fibrinogen, Peritoneal dialysis; Renal replacement therapy
INTRODUCTION
Cardiovascular Disease (CVD) is the leading cause of morbidity and mortality among Chronic Kidney Disease (CKD) patients [1]. The statistics are staggering with nearly half of all people with End-Stage Kidney Disease (ESKD) will develop CVD, and cardiac deaths account for approximately 40% of all mortality in these individuals. The presence of traditional cardiac risk factors, such as diabetes mellitus, hypertension, dyslipidemia, and advanced age certainly contribute to CVD among ESKD patients.
Other possible mediators may lie within the inflammation-coagulation axis as suggested by the presence of nontraditional cardiac risk factors such as C-Reactive Protein (CRP) and activation of the coagulation cascade. Defects in both coagulation initiation and fibrinolysis have been identified in CKD patients [2,3]. The tissue-factor pathway has been found to be up regulated in CKD patients, suggesting that events taking place during clot initiation may mediate the prothrombotic state. At the same time, altered fibrin clot structure leading to increased resistance to fibrinolysis has also been demonstrated both in diabetic patients and in CKD patients requiring dialysis. Patients with diabetes tend to produce denser clots that are less porous and more resistant to fibrinolysis [4,5].
Peritoneal dialysis is an important strategy of the renal replacement therapy for ESKD patients. However, PD patients may have higher rates of CVD events and mortality. The continuous nature of PD, with the long-term concomitant exposure to glucose-based dialysate, can create significant metabolic derangements such as hyperinsulinemia, dyslipidemia, and metabolic syndrome, which are important because of the known links between metabolic syndrome, endothelial dysfunction, inflammation, and a prothrombotic tendency. Those metabolic derangements should therefore create a more prothrombotic environment than is seen in patients receiving hemodialysis. Researchers have found that patients on PD have higher risk for the development of lipid abnormalities and high insulin level. In the uremic state, the inflammatory response is characterized by an obvious presence of pro-inflammatory cytokines. By the following, this presence implies activation of the acute phase proteins such as C-Reactive Protein (CRP) [5].
The health system in Oman is quite goods is highly recognized by World Health Organization and other various agencies [6,7]. Through the last four decades, a sharp progression in the prevalence of people progressing to ESKD and demanding Renal Replacement Therapy (RRT) has been noticed in Oman [8-12]. The incidence of patients with kidney disease in Oman who received RRT during 1983 was very low (21 Per Million Populations (PMP) and has been gradually increasing (75 PMP in 2001 and 120 PMP in 2013) [13].
In this study, we aim to evaluate the fibrinogen indices in patient on peritoneal dialysis. We analyze the fibrinogen and cardiovascular risk factors and their relationship with the other markers of inflammation.
METHODS
This is a longitudinal observational study of patients on Peritoneal Dialysis (PD) following at Renal Medicine Department. All clinical and laboratory data are collected prospectively by computerized medical records system called alshifaa. All patients monthly as part of their PD follow up and investigations during the period from 1st of January 2010 to the end of December 2017 were included in the study. Patients’ data including standard physical examination clinical, radiological and laboratory evaluation were downloaded from the system for all peritoneal dialysis patients. However, we did not include patients who were on PD for less than 3 months. Laboratory investigation and blood pressure measurement collected pre peritoneal dialysis and post starting of PD for a period between three months to one year. The ages and genders of the dialysis patients were recorded. The heights and weights (dry weights) of the patients were determined by using calibrated height/weight scales. The body mass index of each patient was calculated using the formula weight/(height)2 and it classified to three categories, underweight(<18kg/m2), normal weight (18-24.9kg/m2)and overweight (>25kg/m2).
All patients included in the study had blood pressure measured. Serum albumin, glucose, serum cholesterol, triglycerides were measured by quantitative kinetic spectrophotometric method using a computerized autoanalyzer AXION (Menheim Boehringer, Germany) and reagents from Boehring diagnostics. The level of Parathyroid Hormone (PTH) in plasma was measured by RIA method. Urinalysis obtained as well. Data about Peritoneal membranes types were collected too.
Systolic (SBP) divided to Normal systolic (<120mmHg), pre hypertension (120-139mmHg), stage1 hypertension (140-159 mmHg), stage 2 hypertension(≥160 mmHg) and diastolic BP (mmHg) divided to normal (less than 80mmHg), pre hypertension (80-89mmHg), stage 1 hypertension (90-99mmHg), stage 2 hypertension ( ≥100).
Serum Hemoglobin level was divided into three categories: less than (10g/dl), (10-13g/dl) and (>13g/dl). Serum Hematocrit level divided into normal (35-45%) and abnormal level. Serum cholesterol level divided to normal level (5mmoL/L) level, border line cholesterol level (5.2-6.1mmol/l) high cholesterol (6.2-6.6mmol/l/l).Serum Triglyceride level divided to normal level (1.7mmol.L), border line (1.7-2.2mmol/L) and high level (>2.2mmol/L).
Serum albumin level classified to low ((<35g/L), normal level (35g/dl) and high (>48g/L). Serum phosphate level classified to low (<0.75mmol/l), normal level (0.75-1.5mmol/L) and high level (>1.5mmol/L). Parathyroid Hormone (PTH) level divided to <65pg/ml, 65pg/ml and above 65pg/ml. Serum cholesterol classified to Normal (5mmol/l), borderline (5.1-6.1 MMOL/L) and high(> 6.2-6.6 MMOL/L)and triglycerides classified to Normal (1.7mmol/l).
Urine analysis included specific gravity (High > 1.03, Low < 1.02 and Normal (1.02-1.03), urine PH (Acidic < 7, normal 7 and alkaline > 7) and present of leucocytes (White Cell Count (WCC), nitrites, blood, ketones, protein and glucose and bilirubin in urine. Fibrinogen testing was performed with a Sysmex CA-1500 analyzer (Dade Behring Thrombin Reagent, Germany) and plasma that was obtained from blood samples in citrated tubes that were centrifuged at 4000rpm for 15 minutes. Each value expressed as the mean ±SD. P values less than 0.05 considered statistically significant. All statistical calculations performed with the STATA 16 software (version 16.0, STATA Inc, Chicago, Illinois, USA).
RESULTS
Total of 64 patients on peritoneal dialysis therapy were included in this study, of which 48.4% of them were male and 51.7% were female. Their ages ranged between 13 and 80 years, the mean (SD) of the age was 46.4 (1.1) years. The mean (SD) of BMI was 25.4 (6.9), 45.3% of patients had normal weight (18-24.9kg/m2), 15.6% of patients were under weight (<18kg/m2) and 39% of them had overweight (> 25kg/m2).
There were 15(64) patients on continues ambulatory peritoneal dialysis (CAPD) and 49(64) on Automated Peritoneal Dialysis (APD). Total time spent on PD was calculated per years there were 21.9% of total patients spent more than five years, 70.3% of them were on PD from three to five years and 7.8% were on PD for one to three years. The majority (40.4%) of patients have high average membrane, followed by Low Average, low and high membrane-transporter, with a percentage of 38.5%, 11.5%, and 9.6%, respectively, as shown in table 1.
|
Variables |
Mean (%) |
|
Gender |
Male: 48.4% Female: 51.7% |
|
Age/Year |
46.4 (1.1) |
|
Height /cm |
157cm (10.6) |
|
Weight/kg |
63.8 (20.3) |
|
BMI(kg/m2) |
25.4 (6.9) |
|
PD Modality |
1.CAPD: 15(64) 23.4% 2. APD : 49(64) 76.6% |
|
Type of | Membrane |
1. Low Average : 38.5% 2. Low 11.5% 3. High 9.6% 4. High average 40.4% |
Table 1: Illustrate the general demographic and participants characteristics.
Three quarters of total patients (74.6%) on PD had high level of fibrinogen (> 4.2mg), while 25.4% of them had normal level of serum fibrinogen (1.5-4.2mg). As given on table 2, the mean age for patients with hyperfibrinogenemia was 48.7 years and the mean weight was 66.8 kg There were 31 (64) of patients were diabetic, 56(64) suffered from high blood pressure and 29 (64) patients had coronary artery disease. Total of 24(31) of diabetic patients, 42(56) of hypertensive patients and 25(29) patients with cardiac disease were having high serum fibrinogen level, figure 1.Table 2 gives information about Peritoneal Equilibrium Test (PET) details for participants. Total of 40.4% patients had High average membrane, 38.5% had low average membrane, 11.5% of them had low transport membrane and 9.6% their membrane was high. 75% of them had high fibrinogen level, of which, 30.7% of patients had high average membrane and 25% had Low average transport membrane.
|
Variable |
Normal level Fibrinogen (1.5-4.2mg). |
High level Fibrinogen (> 4.2mg) |
|
Percentage % |
25.4% |
74.6% |
|
Age/year |
39.8 (21.7) 2.4(1.2) |
48.7 (20.7) 2.9( 1) |
|
Height/ cm |
155.5 (13.1) |
157.6 (9.9) |
|
Weight/kg |
54.3(17.4) |
66.8(20.5) |
|
Body Mass Index (BMI) kg/m2 25.4(6.9) Under Weight: 10(15.6%) Normal weight: 30(46.9%) Over weight: 24(37.5%) |
5 8 4 |
5 22 20 |
|
Diabetic Mellitus Yes: 31(48.4%) No: 33(51.6%) |
7 10 |
24 23 |
|
Hypertension YES: 39(87.5%) NO: 8(12.5%) |
14 3 |
42 5 |
|
Cardiac Disease Yes: 29(45.3%) NO: 35(54.7%) |
4 13 |
25 22 |
|
Residual Renal Function Yes: 44(68.8%) NO: 20(31.2 %) |
8 9 |
36 11 |
|
Type of Peritoneal Membrane: 1. Low Average: 20 (38.5%) 2. Low: 6 (11.5%) 3. High: 5 (9.6%) 4. High average: 21(40.4%) |
7 1 0 5 |
13 5 5 16 |
Table 2: Shows the various demographic and participants characteristics with relationship to serum Fibrinogen level.
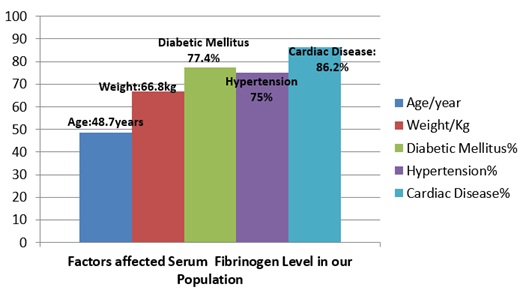 Figure 1: show the role of age, weight and chronic diseases on Hyperfibrinogenemia.
Blood pressure recorded with relationship to serum fibrinogen level pre- and post-initiation of PD is shown in table 3. The mean (SD) of SBP pre PD was 145(21.2) and it improved to 134 (12.8) post initiation on PD. The mean (SD) DBP was 82(14.6) and improved to 77(9.3) on PD. There were 71.9% of total patients’ pre PD had high fibrinogen level and the percentage had slight increase post initiation by 1.5%.
|
Variables |
Normal Fibrinogen (1.5-4.2mg). |
High Fibrinogen ( > 4.2mg) |
||
|
Pre PD |
Post PD |
Pre PD |
Post PD |
|
|
Systolic BP (mmHg) Mean systolic BP 145(21.2)Mean diastolic BP 82(14.6) 1. Systolic Normal ( Pre PD:9.4%, Post PD:10.9% 2. Pre hypertension(120-139) Pre PD:15.6%, Post PD:45.3% 3. Stage 1Hypertension(140-159) Pre PD:37.5%, Post PD:40.6% 4.Stage 2 Hypertension(≥160) Pre PD:37.5%, Post PD:3.2% |
18(64)
3 6 3 6 |
17(64)
2 9 5 1 |
46(64)
3 4 21 18 |
47(64)
5 20 21 1 |
|
Diastolic BP(mmHg) Mean systolic BP134 (12.8)Mean diastolic BP 77(9.3) 1.Normal (less than 80): Pre PD:40.6%, Post PD:40.6% 2. Prehypertension (80-89) Pre PD:21.9%, Post PD:42.1% 3. Stage 1 Hypertension (90-99) Pre PD:20.3%, Post PD:14.1% 4. Stage 2 Hypertension ( ≥100) Pre PD:17.2%, Post PD:3.2% |
18(64)
8 3 2 5 |
21(64)
5 10 3 1 |
46(64)
18 11 11 6 |
43(64)
21 17 6 1 |
Table 3: Shows the mean (SD) for systolic and diastolic BP and distribution of participants for various hypertension stages before and a year after starting peritoneal dialysis with correlation with serum fibrinogen level.
Table 4 shows the relationship between serum fibrinogen level and various blood investigations with their categories at the periods of pre- and post-initiation of PD. It includes the relationship between serum Fibrinogen level and blood glucose, serum Hematocrit, serum Hemoglobin, serum cholesterol level &Triglycerides, serum Albumin, phosphate and parathyroid levels. High Fibrinogen level increased post PD with serum glucose, serum Hemoglobin, serum parathyroid hormone and serum cholesterol, and decreased with serum Triglyceride level, however, there was no difference on high fibrinogen level pre and post PD with relationship to other laboratory results. Number of patients having high serum Fibrinogen with relation to serum glucose had increased post PD by 4.7%, pre initiation the percentage was 71.9% and its increased to 76.6% post PD, while the percentage with serum Hemoglobin increased by 1.6% and by 1.5% with serum parathyroid hormone and serum. On other hand, the percentage of high fibrinogen level with relationship with serum Triglyceride had decreased by 12.5% as shown on figure 2.
|
Variables
|
Normal Fibrinogen Level (1.5-4.2mg) |
High Fibrinogen Level (> 4.2mg) |
|||||||||
|
Pre PD |
Post PD |
Pre PD |
Post PD |
||||||||
|
Serum glucose mmol /l Pre PD: 7.4 (4.6) Post PD: 6.5 ( 2.4) |
18(64)
11 7 |
15(64)
11 4 |
46(64)
29 17 |
49(64)
27 22 |
|||||||
|
Normal (3-6.9) |
Pre PD |
Post PD |
|||||||||
|
62.5% |
59.4% |
||||||||||
|
High (≥7) |
37.5% |
40.6% |
|||||||||
|
Hematocrit % Pre PD: 31.3 (6) Post PD: 33.4 (5.5) |
17(64)
5 12 |
17(64)
7 10 |
47(64)
12 35 |
47(64)
21 26 |
|||||||
|
Normal (35-45%) |
Pre PD |
Post PD |
|||||||||
|
26.6% |
43.7% |
||||||||||
|
Abnormal |
73.4% |
56.3% |
|||||||||
|
Hemoglobin g/dl Pre PD: 10.3 (1.8) Post PD :11 (1.3) |
19(64)
8 9 2 |
18(64)
2 15 1 |
45(64)
21 21 3 |
46(64)
7 35 4 |
|||||||
|
1. |
Pre PD |
Post PD |
|||||||||
|
45.3% |
14.1% |
||||||||||
|
2. 10-13 g/dl |
46.6% |
78.1% |
|||||||||
|
3. > 13 g/dl |
7.8% |
7.8% |
|||||||||
|
Serum total Cholesterol mmol/L Pre PD: 4.5% (1.5) Post PD: 4.7( 1.4) |
12(64)
9 3 0 |
11(64)
8 2 1 |
52(64)
31 11 10 |
53(64)
24 14 15 |
|||||||
|
Normal (5mmol/l) |
Pre D |
Post PD |
|||||||||
|
62.5% |
50% |
||||||||||
|
Borderline 5.1-6.1mmol/l |
21.9% |
25% |
|||||||||
|
High > 6.2-6.6 mmol/l |
15.6% |
25% |
|||||||||
|
Triglycerides mmol/l Pre PD: 1.6 (0.7) Post PD: 1.7( 0.9) |
8(64)
6 2 0 |
16(64)
11 5 0 |
56(64)
29 16 12 |
48(64)
27 9 12 |
|||||||
|
Normal (1.7mmol/l) |
Pre PD |
Post PD |
|||||||||
|
54.7% |
59.4% |
||||||||||
|
Borderline 1.7-2.2 mmol/l |
28.1 |
21.8 |
|||||||||
|
High > 2.2 mmol/l |
17.2% |
18.8% |
|||||||||
|
Serum Albumin g/l Pre PD: 31(5.6) Post PD: 29.3(4.5) |
17(64)
10 7 |
17(64)
12 5 |
47(64)
29 18 |
47(64)
44 3 |
|||||||
|
Low < 35g/L |
Pre PD |
Post PD |
|||||||||
|
60.9% |
87.5% |
||||||||||
|
Normal 35-48g/dl |
39.1% |
12.5 |
|||||||||
|
Serum Phosphate mmol/l Pre PD: 1.5 (0.6) Post PD: 1.8(0.5) |
17(64)
6 11 |
17(64)
8 9 |
47(64)
18 29 |
47(64)
27 20 |
|||||||
|
Normal 0.75-1.5mmol/l |
Pre PD |
Post PD |
|||||||||
|
37.5% |
54.7% |
||||||||||
|
High > 1.5 |
62.5% |
45.3% |
|||||||||
|
Serum Parathyroid Hormone (PTH) pg/ml Pre PD :57.9( 48.1) Post PD: 59.5 ( 56.9) |
18(64)
11 0 7 |
17(64)
10 0 12 |
46(64)
31 3 12 |
47(64)
35 2 10 |
|||||||
|
<65pg/ml |
Pre PD |
Post PD |
|||||||||
|
65.6% |
70.3% |
||||||||||
|
65pg/ml |
4.7% |
3.1% |
|||||||||
|
> 65 pg/ml |
29.7% |
26.6% |
|||||||||
Table 4: shows the mean (SD) and percentages of categorization of various Laboratory tests before and a year after starting peritoneal dialysis with correlation to serum Fibrinogen Level.
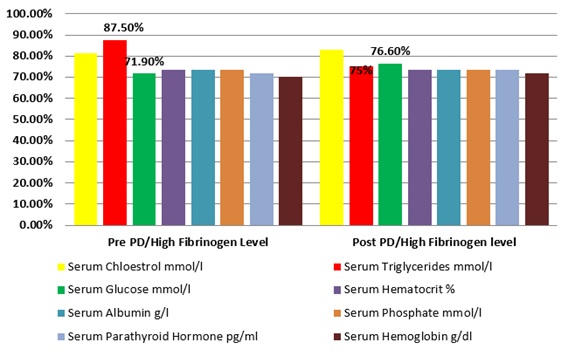 Figure 2: shows the percentages of various Laboratory tests before and a year after starting peritoneal dialysis with correlation to serum Fibrinogen Level.
Table 5 showed the urine analysis test reported pre and post initiation on PD with relationship to serum fibrinogen level. The test included specific gravity, urine PH, and present of leucocytes White Cell Count (WCC), nitrites, blood, ketones, protein and glucose and bilirubin in urine. Urine analysis test was done for 41(64) patients pre-PD and 31(64) patients post PD due to loss of residual renal function for some patients before and during study period. The percentage of fibrinogen level had increased post PD with relationship to most of urine analysis test with the rage between 1.5% and 5%.
|
Variables |
Normal Fibrinogen |
High Fibrinogen |
||
|
Pre PD |
Post PD |
Pre PD |
Post PD |
|
|
Specific gravity in urine |
6(41) |
4(31) |
35(41) |
27(31) |
|
Pre PD: 1.4 (0.5) Post PD: 1.3 (0.4) |
||||
|
1. Lowre PD:0%, Post PD:74.2%% |
0 |
3 |
0 |
20 |
|
2. Normal (1.02-1.03): Pre PD:63.4%, Post PD:25.8% |
5 |
1 |
21 |
7 |
|
3. High (> 1.03): Pre PD:36.6%, Post PD:0% |
1 |
0 |
14 |
0 |
|
PH Urine |
7(41) |
4(31) |
34(41) |
27(31) |
|
Pre PD: 2.4 (1.5) |
||||
|
Post PD:2.1 (0.8) |
||||
|
1. Normal (7): Pre PD:41.5%, Post PD:22.6% |
4 |
1 |
13 |
6 |
|
2. Acidic (<7): Pre PD:58.5%, Post PD:45.2% |
3 |
0 |
21 |
14 |
|
3. Alkaline (> 7): Pre PD:0%, Post PD:32.2% |
0 |
3 |
0 |
7 |
|
Leucocytes in Urine |
24(41) |
4(31) |
17(41) |
27(31) |
|
Pre PD: 1 (0.2) Post PD:2.1 (0.8) |
||||
|
1. Pre PD (negative): 60% Pre PD (positive): 62.5% |
5 |
2 |
2 |
17 |
|
2.Pre PD (positive): 40% Post PD (positive):37.5% |
19 |
2 |
15 |
11 |
|
Nitrites in Urine |
6(41) |
5(31) |
35(41) |
25 (31) |
|
Pre PD: 1 (0.2) Post PD: 1.1(0.3) |
||||
|
1. -Pre PD (negative ): 95.1% -Post PD (negative): 91.4 % |
6 |
5 |
33 |
22 |
|
2. - Pre PD (positive) :4.9% - Post PD (positive):8.6% |
0 |
0 |
2 |
3 |
|
Protein in Urine (mg/dl). |
6(41) |
4(31) |
35(41) |
27(31) |
|
Pre PD: 2 (0.2) Post PD: 1.9 (0.3) |
||||
|
1. Pre PD (negative ):4.8% Post PD (negative): 4.8% |
0 |
0 |
2 |
4 |
|
2. Pre PD (positive): 95.2% Post PD (positive ): 95.2% |
6 |
4 |
33 |
23 |
|
Glucose in urine |
7(41) |
4(31) |
34(41) |
25(31) |
|
Pre PD:1.6 (0.5) Post PD: 1.6 (0.5) |
||||
|
1. Pre PD (negative):41.5 % Post PD (negative):40.6 % |
4 |
1 |
13 |
12 |
|
2. Pre PD ( positive): 58.5 % Post PD (positive): 59.4 % |
3 |
3 |
21 |
15 |
|
Bilirubin in Urine |
6(41) |
4(31) |
35(41) |
27(31) |
|
1. Pre PD (negative): 100% Post PD (negative): 99% |
6 |
4 |
35 |
26 |
|
2. Pre PD (positive): 0% Post PD (positive):1% |
0 |
0 |
0 |
1 |
|
Blood in Urine |
6(41) |
4(31) |
35(41) |
27(31) |
|
Pre PD: 2(0.2) Post PD: 1.8(0.4) |
||||
|
1. Pre PD (negative ) 2.4% Post PD (negative): 21.9 % |
0 |
2 |
1 |
4 |
|
2. Pre PD (positive) 97.6 % Post PD (positive):78.1 % |
6 |
2 |
34 |
23 |
Table 5: Shows the mean (SD) and percentages of Urine analysis test before and a year after starting peritoneal dialysis with correlation to serum Fibrinogen Level.
Note: Numbers of patients produce urine post PD decreased because some of those patients were already on HD before PD.
DISCUSSION
This study evaluated fibrinogen level and its relationship to various clinical & laboratory investigation before and after one year of PD therapy. Present study has more female than male, with young age and were overweight. It showed that, high percentage of patients on PD had high level of serum fibrinogen. The study found a good relationship between hyperfibrinogenemia and aging, present of chronic diseases and various laboratory investigations such as hematocrit level, serum total cholesterol, triglycerides level and serum glucose. (Figures 1 and 2). The presence of cardiac risk factors such as diabetes mellitus, hypertension, dyslipidemia, and advanced age certainly contribute to CVD among ESKD patients. High fibrinogen serum level further fuels the Cardiovascular Disease (CVD) as the leading cause of morbidity and mortality among Chronic Kidney Disease (CKD) patients including PD patients. The participants mean age was 46.4 (1.1) years which is similar to an Iranian PD patients’ age, where their mean age was 46 years [14] and it is very close to Saudi PD patients in a study done at King Khalid University Hospital [15]. This is the same results as we have shown in our previous study which done to evaluate glucose load on PD population [16]. The mean BMI for our patients was 25.4 (6.9), of which 45.3% of patients had normal weight, 15.6% of patients were under weight and 39% of them had overweight. An Indian study [17], conducted in 2014 found that of the 328 PD patients, 47 (14.3%) were underweight, 171 (52.1%) were normal weight, 53 (16.2%) were overweight, and 57 (17.4%) were obese at commencement of PD therapy with mean BMI: 21.9±3.8kg/m2) for 20.0±14.3 months. Another study done in Hong Kong for 274 PD patient, mean BMI was 21.97±3.23 kg/m2; 37 (13.5%) were underweight and 35 (12.8%) were obese [18].
The present study found that fibrinogen level is increasing with advancing participants’ age and body weight. Normal serum fibrinogen level was associated with patients mean age 39.8 years, while hyperfibrinogenemia was seen on patients mean age 48.7 years. There are some evidence supported our finding and suggesting that, the age factor play a major role on fibrinogen level not only for patients with chronic kidney disease, but also for healthy middle age and elderly persons [19-21]. The Centre for Cardiovascular Genetics in London had used data from Northwick Park Heart Study II of 3052 healthy middle-aged men (mean 56 years of age, range 49-69 years), with 5 annual measures of CHD risk factors, ageing effects were tested for plasma fibrinogen, cholesterol and triglycerides, reported that fibrinogen levels increased with age (p<0.0001) [20]. Another old study done in 1994by Hager et al. in 116 participants, living on their own and rating themselves as healthy, fibrinogen increased by 26mg/dL and decade, and after exclusion of persons with pathological laboratory findings and risk factors, fibrinogen still rose by 25 mg/d per decade, thereby reaching concentrations above 320mg/dL in 81% of those older than 65 years. Vincenzo Sepe 2005 [22] studied the plasma fibrinogen and dialysis and found that there are factors such as age, infections, cause of end-stage kidney disease associated with rising plasma fibrinogen.
Increase on body weight has a role in the rise of serum fibrinogen level, where patients with a mean weight of 54.3 kg, had normal level of fibrinogen, while patients with a mean weight of 66.8kg reported high fibrinogen level. Some studies supported our finding [23-25], but some of them have another opinion in this regard [26-29]. One of the studies supported our finding is by Ditschuneit 1995 study [23], which investigated fibrinogen levels in obesity before and after weight reduction. It found that among obese but otherwise healthy patients with overweight problems, the fibrinogen level correlated with the body mass index, the waist circumference, the hip circumference and the waist to hip ratio. After weight reduction, the level of fibrinogen was lower and in patients with extreme overweight and high fibrinogen levels, who reduced their BMI by 7.4±1.24 kg/m2, the weight loss correlated with the decrease in fibrinogen [23]. Pardina et al. reported a significant decrease in fibrinogen level in severely obese patients after bariatric surgery [24]. The study of Beata Brzezin [26], which done in outpatient obesity clinic in Krakow, Poland had different finding regarding the relation of reduction of obesity and stabilization of serum fibrinogen level. It enrolled 29 apparently healthy, obese patients (17 female and 12 male, age range 20-72 years), and their BMI≥30kg/m2, were studied before and after 3-month low-fat diet reported that, there were 5.8% decreases in systolic and 9% in diastolic blood pressure, 12.6% in total cholesterol, 13.4% in low density lipoprotein cholesterol, 15.3% in asparagine, and 16.3% in ALT levels but the level of fibrinogen increased after the follow-up by 15.8% and they suggested that an increase in fibrinogen levels in their study may be was associated with a small number of participants and relatively short observation.
It is a well-known that fibrinogen level is commonly high on chronic diseases such as DM, HTN, CKD pre & post dialysis stages and hyperfibrinogenemia is associated with cardiovascular diseases [27-34]. Our study finding supported the previous studies, where many diabetic, hypertensive and cardiac patients reported high fibrinogen level. The study of Sachin 2012 [35], which done in India, reported that patients with type 2 diabetes mellitus had a high prevalence of hyperfibrinogenemia and the level of fibrinogen were independently associated with hemoglobin A1c values, which suggests that fibrinogen may be involved in the increased cardiovascular risk of patients with type 2 diabetes mellitus. Harsoor [36], stated that those patients who had hypertension showed higher plasma fibrinogen levels than normotensives, but this difference was not significant. On other hand, the study of Majeed [37], which is a prospective, hospital-based, non-randomized study was conducted for a period of 18-month showed that there was no association between fibrinogen level and hypertension in their population. Moreover, Harmankaya2015 [38], did a study to compare the cardiovascular risk factors that might be associated with inflammation, atherosclerosis and metabolic syndrome between 50 patients on HD and 50 patients on peritoneal dialysis who had been receiving dialysis therapy for at least one year were included in the study and found that in patients with diabetes mellitus (n=17) who were undergoing renal replacement therapy, LDL-cholesterol and fibrinogen levels were significantly higher than in patients without diabetes mellitus who were undergoing renal replacement therapy (p=0.001 and 0.004, respectively).
This study reported that 74.6% of total patients on PD had high level of fibrinogen (? 4.2mg).We suggested the reason for that could be the usage of PD fluid which contain high glucose content and many patients used at least two to three glucose concentration (1.36%, 2.27% and 3.86%). Moreover, the possibility of glucose reabsorption is higher on this group especially for patients having high transport membrane and our study reported 40.4% of total patients had HA membrane; meanwhile, glucose reabsorption can increase risk of infection and inflammatory marker on these group.
In our study, we did not investigate the serum Fibrinogen level in hemodialysis population to compare the difference with peritoneal dialysis patients; however, there are some studies reported higher fibrinogen level with PD than hemodialysis [21,33]. Goldwasser [21], concluded that plasma fibrinogen level is markedly greater in peritoneal dialysis than hemodialysis patients with an approximate difference of 100mg/dL [2.9mumol/L]. Study of Broph et al. [5], enrolled 50 age-, race-, and sex-matched subjects 10 control subjects, 20 HD patients, and 20 PD patients, the measurements included platelet function, platelet receptor distribution, and coagulation dynamics by thromboelastography and Hemodyne hemostasis assay (Hemodyne, Richmond, VA, USA), reported that, compared with patients receiving HD, patients on PD had greater concentrations of fibrinogen (p=0.0325), which corresponded with platelet hyper function as measured by platelet contractile force (PCF)and clot elastic modulus (CEM) (p=0.003 and 0.017 respectively, compared with values in HD patients).They found that the PCF was 70% greater, and the CEM was 50% greater in the PD group than in the HD group, reflecting abnormally strong clot formation and the PD group also tended to have faster clot propagation, as reflected in the kinetics time. Prinsen et al. study [33], hypothesized that fibrinogen synthesis in PD is increased as part of a coordinated response of liver derived proteins such as occurs in the nephrotic syndrome. In Cortés-López [39] study concluded that, the elevation of fibrinogen is associated with increased risk of peritonitis in K/DOQI stage V kidney patients who receive replacement therapy for peritoneal dialysis.
The present study showed a positive correlation between serum Fibrinogen level and abnormities of some parameters such as Hematocrit level, serum total cholesterol, triglycerides level and serum glucose level in our PD population. The fibrinogen level is increasing with decrease on the Hematocrit level and it increase with increase on serum total cholesterol, triglycerides level and serum glucose. A few studies supported our finding [40-42]. Tomura et al. [40], did a study to investigate whether there are differences in the risk of CVD between HD and CAPD patients, found that FBG and coagulation factor II (FVIIc) were significantly elevated in CAPD patients compared with controls or HD patients andPAI-1 activities was significantly higher on CAPD patients than controls or HD patients. The study of Fortes et al. [41], found a positive correlation between HbA1c and hyperfibrinogenemia (r =0.4437, p < 0.0005) and the peritoneal dialysis is related to the worst level of glycemic, suggesting the glucose content in the dialysis solution is the main determinant. Martins et al. [42], evaluated Insulin Resistance (IR) in nondiabetic patients receiving PD and analyzed the association between IR and systemic inflammation biomarkers by performing a cross-sectional study on ambulatory dialysis: Patients receiving PD demonstrate a state of IR that is associated with high circulating levels of fibrinogen. This suggests that hyperfibrinogenemia may be involved in the pathogenesis of IR in this setting.
The number of subjects included in this study is small to evaluate and future studies should include other factors affected fibrinogen level on PD population. It is recommended to do such study in a bigger number of patients to emphasis to our finding.
CONCLUSION
The observation that serum fibrinogen level on PD patients was affected by aging, increase on bodyweight and present of chronic diseases reinforce the significant collaboration between increase on Fibrinogen level and cardiovascular diseases & disturbances of major CVD risk factors-based laboratory results.
Peritoneal dialysis patients have high chance to have hyperfibrinogenemia and platelet hyper function due to high exposure to glucose. It is recommended to reduce glucose utilization among PD patient and avoid unnecessary use of hypertonic solution, control of blood pressure and blood glucose, maintain normal body weight, improve nutritional intake and prevent infection on this group. In future studies need to add other factors which may cause disturbance on serum fibrinogen level.
Assessment and evaluation for CKD patients on general and for patients on peritoneal dialysis in particular should be done regularly to prevent the factors which enhance on serum fibrinogen disturbances. Other multidisciplinary team should be involved on the care for this group of patients, such as Endocrinologist, Nephrology dietitian, Clinical pharmacist and Social workers. Alternatives for PD fluid glucose should be used on PD patients such as Icodextrain fluid (Extraneal) and Nutraneal (amino acid) beside glucose solution to reduce exposure to glucose.
PD Therapy prescription based on type of membrane can reduce glucose absorption among PD patients. Patients with high and high average transport, for example, should be kept on Automated PD therapy (APD) where short dwell time, while patients with low and low average transport membrane should be kept on CAPD therapy where long dwell time. PET test need to be do yearly for all patients on PD as a routine and post infection or reduce on UF to identify the type of peritoneal membrane.
Patients’ compliance has a big role in control blood pressure and maintains normal fluid status, subsequently, reduce absorption of glucose. Patients, who maintain a good body weight and have accepted blood pressure reading usually, do not require hypertonic solution. It is recommended to instruct for whose patients regularly about their diet control and adhere to their treatments.
Good selection of PD candidate can limit the complications of this option later on. Strategy of PD first option is one of the important factors on PD successful. Dependence of PD after failure of other replacement therapy options usually is not effective compared with if used as first option, Furthermore, Patients having some Residual Renal Function (RRF) usually, have better PD adequacy and more quality of life compared with anuric patients who require intensive PD prescription and consume more high glucose solution,therefore, there are on higher risk for inflammations cardiovascular diseases.
COMPLIANCE WITH ETHICAL STANDARDS
Disclosure of potential conflicts of interest
The study was approved by the Scientific Research Committee at the Royal Hospital, Muscat, Oman and certify that the study was performed in accordance with the ethical standards as laid down in the 1964 Declaration of Helsinki and its later amendments ethical standards. https://mohcsr.gov.om/my-researches/
Informed consent
Each participant was freely given, informed consent to participate in the study.
Availability of data and material
Data of this paper is not available publicly but can be requested from the corresponding author in a reasonable time.
Funding
No funding available for both authors.
Conflict of interest
Authors declare no conflict of interest.
Acknowledgment
We would like to thank our patients and all the staff responsible for the delivery of patients’ care.
REFERENCES
- Levey AS, Eckardt KU, Tsukamoto Y, Levin A, Coresh J, et al. (2005) Definition and classification of chronic kidney disease: A position statement from Kidney Disease: Improving Global Outcomes (KDIGO). Kidney Int 67: 2089-2100.
- Madhusudhan T, Kerlin BA, Isermann B (2016) The emerging role of coagulation proteases in kidney disease. Nat Rev Nephrol 12: 94-109.
- Huang MJ, Wei RB, Wang Y, Su TY, Di P, et al. (2017) Blood coagulation system in patients with chronic kidney disease: a prospective observational study. BMJ Open 7: 014294.
- Jalal DI, Chonchol M, Targher G (2010) Disorders of hemostasis associated with chronic kidney disease. Semin Thromb Hemost 36: 34-40.
- Brophy DF, Carl DE, Mohammed BM, Song J, Martin EJ, et al. (2014) Differences in coagulation between hemodialysis and peritoneal dialysis. Perit Dial Int 34: 33-40.
- Al Salimi I, Hannawi S (2016) The World Health Report -Health systems Empowering Citizens and Improving Performance. Research on Humanities and Social Sciences 6: 6.
- Al Salimi I, Hannawi S (2018) Health Workforce in the Sultanate of Oman: Improving performance and the Health System. J Int Med Pat Care 1: 101.
- Al Alawi IH, Al Salmi I, Al Mawali A, Sayer JA (2017) Kidney Disease in Oman: a View of the Current and Future Landscapes. Iran J Kidney Dis 11: 263-270.
- Al MajarfiA, Al Salmi I, Metry AM, Al Ismaili F, Hola A, et al. (2018) Epidemiology of Patients at Initial Treatment with Hemodialysis. ARC Journal of Nephrology 3: 6-12.
- Al Rahbi F, Al Salmi I (2017) Commercial Kidney Transplantation: Attitude, Knowledge, Perception, and Experience of Recipients. Kidney Int Rep 2: 626-633.
- Al Salmi I, Metry AM, Al Ismaili F, Hola A, Al Riyami M, et al. (2018) Transplant tourism and invasive fungal infection. Int J Infect Dis 69: 120-129.
- AlshaailiK, Al Salmi I, Metry AM, Al Ismail F, Hola A, et al. (2018) The Epidemiology of Hemolytic Uremic Syndrome: Clinical Presentation, Laboratory Findings, Management and Outcomes. Int J Hematol Blo Dis 3: 1-6.
- Al Ismaili F, Al Salmi I, Al Maimani Y, Metry AM, Al Marhoobi H, et al. (2016) Epidemiological Transition of End-Stage Kidney Disease in Oman. Kidney Int Rep 2: 27-35.
- Najafi I, Alatab S, Atabak S, Majelan NN, Sanadgol H, et al. (2014) Seventeen years' experience of peritoneal dialysis in Iran: first official report of the Iranian peritoneal dialysis registry. Perit Dial Int 34: 636-642.
- Al Wakeel JS, Al Ghonaim MA, Aldohayan A, Usama S, Al Obaili S, et al. (2018) Appraising the outcome and complications of peritoneal dialysis patients in self-care peritoneal dialysis and assisted peritoneal dialysis: A 5-year review of a single Saudi center. Saudi J Kidney Dis Transpl 29: 71-80.
- Prasad N, Sinha A, Gupta A, Sharma RK, Bhadauria D, et al. (2014) Effect of body mass index on outcomes of peritoneal dialysis patients in India. Perit Dial Int 34: 399-408.
- Kiran VR, Zhu TY, Yip T, Lui SL, Lo WK (2014) Body mass index and mortality risk in Asian peritoneal dialysis patients in Hong Kong-impact of diabetes and cardiovascular disease status. Perit Dial Int 34: 390-398.
- Drenos F, Miller GJ, Humphries SE (2007) Increase of Plasma Fibrinogen Levels and Variability with Age in a Sample of Middle Aged Healthy Men. Ann Hum Genet 71: 43-53.
- Hager K, Felicetti M, Seefried G, Platt D (1994) Fibrinogen and aging. Aging (Milano) 6: 133-138.
- Goldwasser P, Feldman JG, Emiru M, Barth RH (2004) Effect of dialysis modality on plasma fibrinogen concentration: a meta-analysis. Am J Kidney Dis 44: 941-949.
- Sepe V, Libetta C, Adamo G, Soccio G, Giuliano MG, et al. (2005) Plasma fibrinogen and dialysis. American journal of kidney diseases: National Kidney Foundation 45: 787-788.
- Ditschuneit HH, Flechtner-Mors M, Adler G (1995) Fibrinogen in obesity before and after weight reduction. Obes Res 3: 43-48.
- Pardina E, Ferrer R, Rivero J, Baena-Fustegueras JA, Lecube A, et al. (2012) Alterations in the common pathway of coagulation during weight loss induced by gastric bypass in severely obese patients. Obesity (Silver Spring) 20: 1048-1056.
- Garanty-Bogacka B, Syrenicz M, Goral J, Krupa B, Syrenicz J, et al. (2011) Changes in inflammatory biomarkers after successful lifestyle intervention in obese children. Endokrynol Pol 62: 499-505.
- Brzezinska-Kolarz B, Kolarz M, Walach A, Undas A (2014) Weight Reduction Is Associated With Increased Plasma Fibrin Clot Lysis. Clin Appl Thromb Hemost 20: 832-837.
- Belalcazar LM, Ballantyne CM, Lang W, Haffner SM, Rushing J, et al. (2011) Metabolic factors, adipose tissue, and plasminogen activator inhibitor-1 levels in type 2 diabetes: Findings from the look AHEAD study. Arterioscler Thromb Vasc Biol 31: 1689-1695.
- Fayh APT, Lopes AL, da Silva AMV, Reischak-Oliveira A, Friedman R (2013) Effects of 5 % weight loss through diet or diet plus exercise on cardiovascular parameters of obese: a randomized clinical trial. Eur J Nutr 52: 1443-1450.
- Folsom AR, Qamhieh HT, Wing RR, Jeffery RW, Stinson VL, et al. (1993) Impact of weight loss on plasminogen activator inhibitor (PAI-1), factor VII, and other hemostatic factors in moderately overweight adults. Arterioscler Thromb 13: 162-169.
- Zhang J, Chen C, Zhou Q, Zheng S, Lv Y, et al. (2017) Elevated serum fibrinogen level is an independent risk factor for IgA nephropathy. Oncotarget 8: 99125-99135.
- Wang H, Zheng C, Lu Y, Jiang Q, Yin R, et al. (2017) Urinary Fibrinogen as a Predictor of Progression of CKD. Clin J Am Soc Nephrol 12: 1922-1929.
- Goicoechea M, de Vinuesa SG, Gómez-Campderá F, Aragoncillo I, Verdalles U, et al. (2008) Serum fibrinogen levels are an independent predictor of mortality in patients with Chronic Kidney Disease (CKD) stages 3 and 4. Kidney Int Suppl 111: 67-70.
- Prinsen BHCMT, Rabelink TJ, Beutler JJ, Kaysen GA, De Boer J, et al. (2003) Increased albumin and fibrinogen synthesis rate in patients with chronic renal failure. Kidney Int 64: 1495-1504.
- Giordano M, Feo PD, Lucidi P, dePascale E, Giordano G, et al. (2001) Increased Albumin and Fibrinogen Synthesis in Hemodialysis Patients with Normal Nutritional Status. J Am Soc Nephrol 12: 349-354.
- Bembde AS (2012) A study of plasma fibrinogen level in type-2 diabetes mellitus and its relation to glycemic control. Indian J Hematol Blood Transfus 28: 105-108.
- Harsoor S, Kinagi A, Ananta A (2014) Correlation of plasma fibrinogen with blood pressure , bmi, lipid profile and glycemic status in type II DM. JEvol Med Den Sci 3: 14615-14627.
- Majeed ARA, Maqbool R, Rashid W, Ahmed M, Gulzar U (2016) Serum fibrinogen levels and its relation to. HIJSS 3: 72-75.
- Harmankaya O, Akalin N, Akay H, Okuturlar Y, Erturk K, et al. (2015) Comparison of risk factors for cardiovascular disease in hemodialysis and peritoneal dialysis patients. Clinics (Sao Paulo) 70: 601-605.
- Cortés-López LA,González-Castillo DE, Elizalde-Barrera CI, Flores-Alcántar G (2013) Increased Fibrinogen as Marker of Peritonitis Risk in Patients with Chronic Renal Disease Stage 5 K/ DOQI in Substitutive Treatment of Renal Function with Peritoneal Dialysis. Med Int Mex 29: 581-586.
- Tomura S, Nakamura Y, Doi M, Ando R, Ida T, et al. (1996) Fibrinogen, coagulation factor VII, tissue plasminogen activator, plasminogen activator inhibitor-1, and lipid as cardiovascular risk factors in chronic hemodialysis and continuous ambulatory peritoneal dialysis patients. Am J Kidney Dis 27: 848-854.
- Fortes PC, Mendes JG, Sesiuk K, Marcondes LB, Aita CAM, et al. (2010) Glycemic and lipidic profile in diabetic patients undergoing dialysis. Arq Bras Endocrinol Metab 54: 793-800.
- Martins C, do Nascimento MM, Pecoits-Filho R, Leinig C, Gonçalves LF, et al. (2007) Insulin resistance is associated with circulating fibrinogen levels in nondiabetic patients receiving peritoneal dialysis. J Ren Nutr 17: 132-137.
Citation: Al Rahbi N, Al Salmi I, Hannawi S, Baqi SA, Al Rahbi F (2021) Higher Fibrinogen Levels among Patient with End-Stage Kidney Disease Post Initiation of Peritoneal Dialysis: Cardiovascular Risk Attenuation. J Nephrol Renal Ther 7: 043.
Copyright: © 2021 Nadiya Al Rahbi, et al. This is an open-access article distributed under the terms of the Creative Commons Attribution License, which permits unrestricted use, distribution, and reproduction in any medium, provided the original author and source are credited.