Investigating the Dynamic Biophysical Properties of a Tunable Hydrogel for 3D Cell Culture
*Corresponding Author(s):
John HuangThewell Bioscience, New Jersey, United States
Tel:+1 9738554955,
Abstract
The hydrogel-based 3D cell culture model more accurately depicts the in vivo cellular microenvironment than traditional 2D cell culture systems. It enables cells to develop, operate and produce feedback like they would in living organisms. However, current animal-derived hydrogel systems struggle with the batch to batch inconsistencies and undefined compounds. While the final properties of most hydrogel systems are known to significantly depend on several key factors, such as culture media, cell densities, and supplemental compounds, a thorough study on the biophysical properties of current hydrogel-based 3D cell culture products remains unexplored. Here, we characterized the dynamic mechanical properties of a xeno-free, tunable hydrogel system, VitroGel, in response to variations in ionic molecule concentration and cell culture media composition, as well as supplementation with glucose. We also characterized the hydrogel molecular diffusion properties at different concentrations and formation states. Glioblastoma cancer cells (U87MG) were cultured in 3D hydrogels to evaluate the cellular interactions in response to the varying hydrogel conditions. The data indicate that the VitroGel system has the defined and adjustable biophysical properties necessary to support drug screening, toxicology assays, tissue engineering, regenerative medicine and other biomedical applications.
INTRODUCTION
In recent years, Three-dimensional (3D) cell culture systems have grown in popularity because they more accurately depict the in vivo cellular microenvironment than traditional 2D systems [1,2]. In 2D cultures, cells sense their surroundings via dynamic leading-edge filopodia [1]. However, it is now well known that cells also extrude actin-rich apical and basal protrusions, such as invadopodia and podosomes, to sense and respond to the environment in 3D. The ability of 3D culture systems to induce cellular differentiation, morphological changes, and functional feedback, similar to cells in living organisms, allows for efficient modeling of cellular behaviors under physiological-like states [1-3]. Hydrogels play a critical role in 3D cell culture systems. The high water-content matrix structure provides a tissue-like environment that permits the examination of different cellular characteristics in 3D.
Many organic hydrogels, e.g. collagen and Matrigel, have been used to establish native microenvironments for 3D cell cultures. Despite the advantages of their native functional characteristics, these hydrogel matrices are overly sensitive to temperature or pH, making 3D cell culture unnecessarily strenuous [2]. Matrices developed from animal tissue yield unwanted components and undefined compounds in cultures and struggle with batch-to-batch consistency [2,4]. For these reasons, the properties of organic hydrogel systems are often hard to characterize. However, cellular behaviors in 3D microenvironments are heavily influenced by biophysical hydrogel properties such as stiffness, density, porosity, molecular diffusion, ligand binding and composition [5-7]. A more thorough examination is needed to evaluate the biophysical properties of current 3D cell culture hydrogels. Unlike natural-derived organic hydrogels, synthetic hydrogels, which have more well-defined molecular structures and chemical interactions, offer a more feasible and consistent platform to study biophysical and biochemical hydrogel properties [8-12].
In this study, we used a xeno-free, tunable hydrogel system (VitroGel) to characterize hydrogel rheological properties in response to variations in ionic molecules, cell culture media composition and supplementation with glucose and serum. By investigating the relationship between hydrogel concentrations and ionic solutions ratios, we sought to elucidate the effects of ionic regulation of hydrogel formation and final elastic modulus. We tested rheological properties at different stages of hydrogel formation and stabilization, including the dynamic shear-thinning and recovering process, to exam the capabilities of hydrogel injection. Additionally, the molecular diffusion properties at different hydrogel concentrations and formation states were characterized with phenol red, trypan blue, Bovine Serum Albumin (BSA), and Immunoglobin G (IgG). Finally, cellular behaviors in hydrogels modified with different functional ligand were evaluated using glioblastoma cancer cells (U87MG) and bone marrow stromal cells (OP9) [1,13-16]. This study illustrates a fundamental understanding of the biophysical properties of an ion responding hydrogel system. Furthermore, we provide guided manipulations of the operating processes and culture conditions that demonstrate the usefulness of this hydrogel for a variety of biomedical applications [17-21].
MATERIALS AND METHODS
Hydrogel Preparation
Effects of ionic molecules
To prepare the ionic molecule induced hydrogel, the VitroGel 3D hydrogel solution (TheWell Bioscience, NJ) was used to mix with either CaCl2 (0.15 - 1mg/ml) or NaCl (2 - 10mg/ml) solution at 1:1 (v/v) ratio. We selected the 8mg/mL NaCl solution, which is about the concentration of Na+ in PBS and other common cell culture media, to examine the effects of mixing ratios on gel formation and strength. The mixing ratios of the hydrogel solution and NaCl were set from 4:1 to 1:1 ratio (v/v).
Furthermore, four classic media – DMEM, DMEM/F12, RPMI and PBS (calcium and magnesium free, VWR and PA) were selected to study the hydrogel formation in response to different ionic concentrations in the media. The hydrogel was prepared using mixing ratios at 4:1, 3:1, 2:1, and 1:1 (hydrogel solution: medium, v/v).
Effects of hydrogel concentration
DMEM and RPMI were further used to prepare samples at different hydrogel concentrations. Two ratios were defined here: 1) Dilution ratio (the ratio between hydrogel solution and DI water), and 2) Mixing ratio (the ratio between the diluted hydrogel solution and cell culture medium) were adjusted for hydrogel preparation. We prepared two groups of samples. Group 1: The hydrogel solution was diluted with DI water at 1:1, 1:2, 1:3 and 1:4 ratios (hydrogel solution: DI water, v/v) before mixing with the medium. The DMEM hydrogel samples were prepared by mixing the diluted hydrogel solution with DMEM at a 4:1 (v/v) ratio. The RPMI hydrogel samples were prepared by mixing the diluted hydrogel solution with RPMI at a 1:1 (v/v) ratio. Group 2: The 1:3 and 1:4 diluted hydrogel solutions were used in this group because of their unstable hydrogel formation process in DMEM. Instead of using the fixed 4:1 mixing ratio (diluted hydrogel solution: DMEM, v/v), samples in this group were prepared by using mixing ratios of 4:1, 3:1, 2:1 and 1:1 (diluted hydrogel solution: DMEM, v/v).
Effects of the dilution solution
While using DI water to adjust the concentration of the hydrogel solution, the mixing ratio of the diluted hydrogel solution and cell media needs to be manipulated accordingly to ensure a stable hydrogel formation process, thereby increasing the experiment operation complexity. Therefore, we also evaluate the influence of ionic dilution solutions (VitroGel Dilution Solution, TheWell bioscience, NJ), which can use at a fixed mixing ratio (4:1 v/v) with cell medium after changing the concentration of the hydrogel solution. Both type 1 (with glucose) and type 2 (without glucose) dilution solutions were used for this evaluation. The samples were prepared at 1:1, 1:2 and 1:3 dilution (v/v) ratios and then mixed with cell culture medium at one fixed ratio (4:1, v/v). Three classic cell culture media, DMEM, DMEM/F-12, and RPMI were used in this test.
Rheological properties test
Hydrogel rheological properties are typically characterized by examining two processes: hydrogel formation and hydrogel stabilization. For the process of hydrogel formation, samples were tested after mixing the hydrogel solution with cross linking solutions such as CaCl2 solution, NaCl solution or cell culture medium (DMEM, DMEM F12, RPMI or PBS). Thirty-minute single-frequency oscillation time sweeps were performed using a Malvern Kinexus Pro+ dynamic rheometer (Malvern Panalytical, UK) at a 0.1% controlled shear rate model, with a 20mm parallel-plate rough surface geometry. Around 30 min after the initial hydrogel formation process, the hydrogel stabilization process was initiated by adding additional cell culture medium on top of the hydrogel. To test the rheological properties of stable hydrogel, 1200 µl samples were prepared in a 35 mm petri dish; 30 min later, 1200 µl of the selected medium was added to the gel surface and the plate was incubated at 37ºC overnight to allow for hydrogel solidification. To test the process of hydrogel stabilization over time, samples were incubated for 30 min, 1 hour, 2 hours, 4 hours 6 hours, and 24 hours. The samples were cooled to room temperature 15 min before testing. The cover medium was gently removed before testing.
Shear thinning test
Repeated amplitude sweep (shear-thinning and recovery) tests were performed using a Malvern Kinexus Pro+ dynamic rheometer (Malvern Panalytical, UK) with 20 mm parallel-plate rough surface geometry. A 190 µl VitroGel sample (1:0 dilution and 4:1 mixing) was added onto the lower plate with a 0.5 mm gap setup. After loading the sample, the edge of the sample was covered with ultra-low viscosity silicone fluid (viscosity of 5cSt @ 25C, Clearco, USA) to prevent drying. The time sweep testing was performed at 1 Hz, 0.1% shear strain for 30 min at room temperature, followed by shearing using the amplitude sweep with 0.1 to 500% shear strain for 4 min. After the first amplitude sweep, the sample was immediately tested with another time sweep test for 10 min that was followed with the second amplitude sweep test. The sequence contained three cycles of time sweeps and amplitude sweeps.
Molecular diffusion test
The diffusion test was performed with particle solutions containing the following different molecular weights: Phenol Red (354.4 g/mol), Trypan Blue (960.8g/mol), Bovine Serum Albumin (BSA, 66,463g/mol) and IgG (150,000 g/mol). The hydrogel samples were prepared at 1:0, 1:1 and 1:2 dilution ratio (hydrogel solution: dilution solution, v/v) and 4:1 mixing ratio (diluted hydrogel solution: DMEM). The resulting hydrogel (100 µl) was added in a 24-well plate insert with an 8.0 µm PET membrane. To test the diffusion rate after the hydrogel formation process, 500 µl of particle solution was added on top of the hydrogel 30 min after adding the hydrogel to the insert. The insert was then placed in a 24 well plate with 1 ml DMEM in each well. To test the diffusion rate after the hydrogel stabilization process, the hydrogel in the insert was covered with 500 µl DMEM and placed in a 24 well plate filled with 1ml DMEM for overnight incubation. The following day, the cover medium was removed carefully and replaced with the particle solution. The concentration of diffusing molecules was measured at 30 min, 1 hr, 2 hrs, 4 hrs, 6 hrs, and 24 hrs by using DeNovix DS-11 Spectrophotometer (DeNovix, DE).
3D cell culture
U-87 MG glioblastoma cell line was maintained in 2D using Alpha MEM (α MEM) supplemented with 10% fetal bovine serum, 1X Pen Strep and 1X Amphotericin B. The cells were passaged when cultures reached 80% confluence. The cells were embedded within the hydrogel (unmodified and modified with the RGD integrin-binding ligand) according to manufacture protocols. Briefly, the hydrogel solution was diluted with type 1 dilution solution at a 1:3 (v/v) ratio and then mixed with cell suspension (5 x 10⁵ cells/ml with 50% FBS) at a 4:1 (v/v) ratio. The final FBS concentration in the cell-hydrogel mixture was 10%. A 75 µl mixture was added to a 96 well plate. After 20 min of the hydrogel formation process, 75 µl cell culture medium was added to cover the top of the hydrogel. The cells were incubated in a 5% CO2 incubator at 37ºC. The cover medium was changed every other day. Images were taken using Image Xpress high-content analysis system (Molecular Devices, CA).
RESULTS AND DISCUSSION
Rheological properties of hydrogel with different ionic molecules
Calcium chloride samples
The hydrogel samples were prepared with solutions containing a range of 0.15 to 1 mg/ml CaCl2. At high Ca2+ concentrations (1mg/ml and 0.5 mg/ml), an accelerated solidification process, within 10 seconds, resulted in chunky hydrogels (Figures 1a and 1b). This rapid gel formation leads to a loss of the critically important continuous hydrogel structure. Therefore, the rapid, discontinuous hydrogel formation process induced high concentrations of Ca2+ proved impractical for cell culture application, wherein hydrogels must be transferred from the mixing tube to the cell culture plate. At 0.15 to 0.4 mg/ml CaCl2 concentrations, the graph shows an initial curve representing an increase in elasticity during the first 500 seconds of gel formation (Figure 1c). The hydrogel formed with 0.4 mg/ml CaCl2 had an initial data point over 20 Pa, indicating a fast hydrogel cross linking process immediately upon mixing. The curves of hydrogels with lower CaCl2 concentrations, 0.15, 0.2, and 0.3 mg/mL, show longer progressions, indicative of a slower hydrogel formation process. This is especially evident with hydrogels formed with 0.15 and 0.2 mg/ml CaCl2. The slower gel formation process allows for more time for the hydrogel mixture preparation and transfer into the petri dish.
The elastic modulus (G’) was also evaluated after hydrogel stabilization (Figure 1d). The G’ of hydrogels with 0.4mg/ml, 0.3 mg/ml, 0.2 mg/ml and 0.15 mg/ml CaCl2 were 1270 Pa, 2090 Pa, 116 Pa and 1.67 Pa respectively. The hydrogel with 0.3 mg/ml CaCl2 had a higher G’ than that with 0.4 mg/ml. According to the hydrogel formation process data in figure 1c, initial hydrogel cross linking rate is inversely correlated with hydrogel strength. Conversely, hydrogels with low ionic concentrations (0.2 mg/ml and 0.15 mg/ml) display low G’ after stabilization. Moreover, the slow formation process associated with these two hydrogels with lower ionic concentrations (Figure 1c) is indicative of an insufficient number of ionic molecules necessary to saturate the hydrogel cross linking. Taken together, these results suggest an optimal balance between the hydrogel and Ca2+ ions is required to form a stable hydrogel with high G’. This balance should allow for a smooth initialization of hydrogel formation and saturated cross linking of the final hydrogel matrix.
Sodium chloride samples
We further tested the role of ion concentration during hydrogel formation by examining the effects of major cations on gel formation and final gel strength. To compare with Ca2+, NaCl was utilized as a hydrogel crosslinker. The results reported here confirm that, in addition to Ca2+, Na+ ions can play an important role in hydrogel matrix formation (Figures 1e and 1f). Relative to Ca2+, Na+ ionic concentration has a higher threshold for initiating hydrogel crosslinking. Figure 1e demonstrates that gel formation proved difficult at the Na+ ionic concentration of 4 mg/ml. Conversely, NaCl concentrations higher than 6 mg/ml yielded an elastic modulus curve that increased over time. Hydrogel formation in the presence of 8 mg/ml NaCl showed a steep curve of the elastic modulus that began within 400 seconds and continued upward at a linear rate. Interestingly, NaCl concentrations higher than 8 mg/ml produced a rapid initial hydrogel formation. For example, at 9 mg/ml, G’ reached over 50 Pa immediately upon mixing of the solutions and was greater than 100 Pa within 60 seconds. Next, we measured the effect of Na+ concentration on G’ after hydrogel stabilization. Figure 1f shows that Na+ concentration is positively correlated with increasing final gel strength. High concentrations of Na+ are sufficient to saturate the matrix, thereby aiding gel formation. Gels with an insufficient amount of Na+ remain mostly liquid (e.g. 4 mg/ml sample with only 1.38 Pa final gel strength).
Besides ionic molecule concentrations, another factor that regulates hydrogel formation is the mixing ratio of the hydrogel solution and crosslink solution. To study this factor, the hydrogel was mixed with 8mg/ml NaCl solution at different mixing ratios (hydrogel: NaCl at 4:1, 3:1, 2:1 and 1:1, v/v). As the proportion of ionic solution in the mixture increased, i.e. from 4:1 to 1:1 mixing ratio, the process of the hydrogel formation was accelerated (Figure 1g) as shown by a gradual increase in elastic modulus. Conversely, increased ionic solution proportions yielded decreased hydrogel concentrations in the mixture, which was correlated with the final G’ after hydrogel stabilization. Figure 1h shows hydrogel strength (G’) after overnight stabilization. The G’ increases from 880 Pa with a 1:1 mixing ratio to 1400 Pa with a 2:1 mixing ratio and, finally, to 1780 Pa with a 3:1 mixing ratio. Therefore, the mixing ratio is positively correlated with final gel strength. However, this trend seems to have a limit. Interestingly, the hydrogel with a 4:1 mixing ratio, which has a higher proportion of the hydrogel solution (80% vs 75%), was found to have a lower G’ than the 3:1 hydrogel. Based on the hydrogel formation curve, the 4:1 mixing hydrogel shows a very slow initial hydrogel formation (G’< 5 Pa during 30 min measurement), suggestive of an unsaturated hydrogel crosslink due to a low proportion of ionic solution (Figure 1g). To manipulate the hydrogel formation process and modulate the final gel strength, the ratio of hydrogel solution to ionic solution needs to carefully consider.
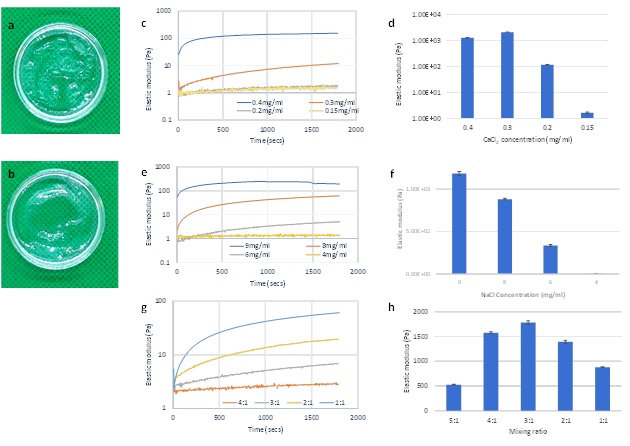 Figure 1: Rheological properties of hydrogels prepared with CaCl2 and NaCl solutions. (a) Chunky gel prepared with 1mg/ml CaCl2 (b) and 0.5mg/ml CaCl2. (c) G’ during formation process and after stabilization (d) of hydrogels prepared with various concentrations of CaCl2. (e) G’ during formation process and after stabilization (f) of hydrogels prepared with various concentrations of NaCl. (g) G’ during formation process and after stabilization (h) of hydrogels prepared with 8mg/ml of NaCl at different mixing ratios (hydrogel: NaCl solution, v/v).
Rheological properties of hydrogels with different cell culture media
After establishing the role and importance of Ca2+ and Na+ in hydrogel formation and polymerization, we further tested rheological hydrogel properties in response to four classic cell culture media - DMEM, DMEM/F12, RPMI, and PBS (Calcium and Magnesium free). The four media have similar concentrations of Na+ and different Ca2+ concentrations as follows: DMEM (~0.002 mol/L) > DMEM/F12 (~0.001 mol/L) > RPMI (~0.0005 mol/L) > PBS (0mol/L). As such, we anticipate these four media will have different influences on the hydrogel formation process and final gel strength after stabilization. Also, we analyzed the effects of different hydrogel solution and the cell culture media mixing ratios [4:1 to 1:1 ratio (v/v)].
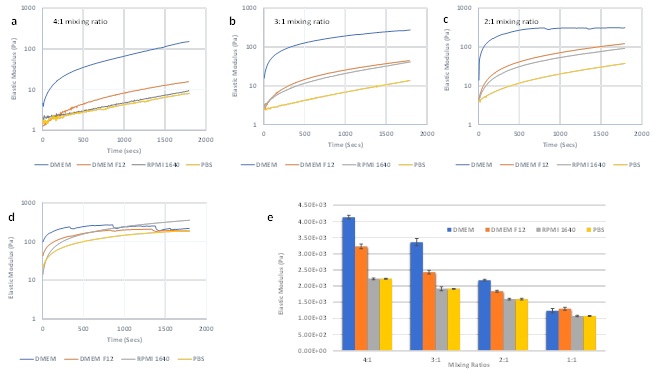 Figure 2: Rheological properties of hydrogels prepared with different mixing ratios by using DMEM, DMEM/F-12, RPMI and PBS. (a-d) G’ of the process of hydrogel formation with the 4 different media at 4:1 (a) 3:1 (b) 2:1 (c) and 1:1 (d) mixing ratios. (e) G’ after stabilization of hydrogels prepared with the different mixing ratios and different media.
Figure 2a-d shows the effects of varying the mixing ratios of four media on G’ during the hydrogel formation process. In each condition, the hydrogel cross linking occurred upon mixing as evidenced by the G’ curves increasing over time. The hydrogel formation speed is maximal with DMEM, followed by DMEM/F-12, RPMI, and PBS. As expected, DMEM, which contains the highest concentration of Ca2+, yielded the fastest hydrogel formation as shown by having the highest G’ value at both time 0 and the first 15 min measurement. However, the graphs of the 2:1 and 1:1 mixing ratios (Figures 2c and 2d) exhibit dips of the hydrogel curves with DMEM DMEM/F12 (at 1:1 v/v), which indicate a non-continuous matrix structure formation during the cross linking process. As the proportions of the cell media increased from a 4:1 to 1:1 ratio, high ionic molecular concentrations in DMEM and DMEM/F-12 caused fast aggregation of the hydrogel matrix, thereby disrupting the uniformity of the integral hydrogel matrix. On the other hand, the hydrogels with RPMI and PBS show a more smoothly increasing G’ curve at the 2:1 and 1:1 mixing ratios compared to those at the 4:1 ratio. Therefore, with a fixed concentration of hydrogel solution, the optimal mixing ratio for hydrogel formation needs to be adjusted according to the media used.
Figure 2e shows the elastic modulus after hydrogel stabilization. In each mixing ratio, DMEM produced the highest G’ (except 1:1 ratio, which had non-uniform hydrogel), following by DMEM/F-12, RPMI and, PBS. Conversely, for each medium tested, the final G’ decreased as the mixing ratio was reduced from 4:1 to 1:1, corresponding with a reduction in the proportion of the hydrogel solution in the mixture. According to the results from the NaCl experiments, if the ionic concentration is sufficient to saturate the hydrogel crosslink, the final G’ after hydrogel stabilization corresponds to the hydrogel solution concentration.
Modulation of final hydrogel strength is critical for 3D cell culture hydrogel systems to meet the requirements of different tissue types [10,22]. For 3D cell culture, Instead of adjusting the mixing ratio between the hydrogel solution and cell culture medium to fine-tune G’, using a fixed mixing ratio between the hydrogel solution and cell medium with a pre-adjusted hydrogel concentration is a more practical way to determine cell seeding numbers and growth factor concentrations. Therefore, we further explored the relationship between the concentration of the hydrogel solution and the final hydrogel G’ using a fixed mixing ratio with pre-adjusted hydrogel concentrations. Two types of media (DMEM and RPMI) were selected to represent different ionic concentrations. The fixed 4:1 mixing ratio was used for DMEM and 1:1 mixing ratio was used for RPMI since the gel formation at these ratios were smooth. The hydrogel solution was pre-adjusted via dilution with DI water at 1:1, 1:2, 1:3, and 1:4 dilution ratios (hydrogel solution: DI water, v/v) before being mixed with the cell culture medium.
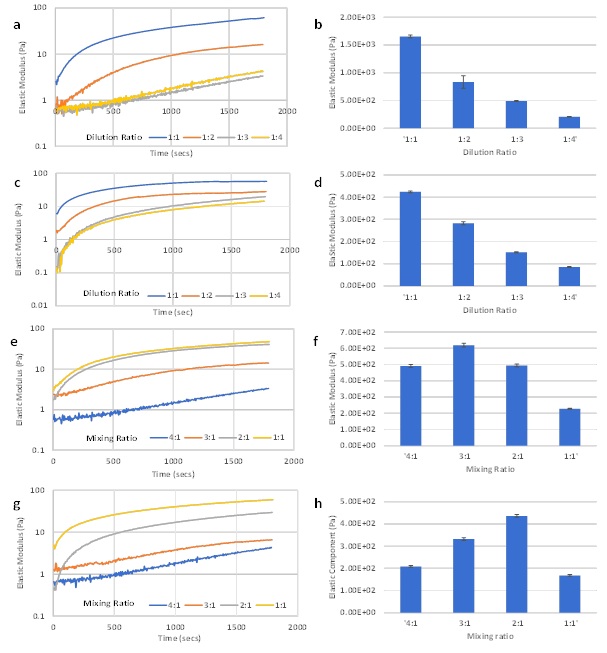 Figure 3: Rheological properties of hydrogels diluted with DI water at different dilution ratios (1:1, 1:2, 1:3 and 1:4 – hydrogel: DI water). (a) G’ during hydrogel formation of 1:1 to 1:4 diluted DMEM hydrogel at fixed 4:1 mixing ratio, (b) G’ after hydrogel stabilization of 1:1 to 1:4 diluted DMEM hydrogel at fixed 4:1 mixing ratio, (c) G’ during hydrogel formation of 1:1 to 1:4 diluted RPMI hydrogel at fixed 1:1 mixing ratio, (d) G’ after hydrogel stabilization of 1:1 to 1:4 diluted RPMI hydrogel at fixed 1:1 mixing ratio, (e) G’ during hydrogel formation of 1:3 diluted DMEM hydrogel at 4:1 to 1:1 mixing ratio, (f) G’ after hydrogel stabilization of 1:3 diluted DMEM hydrogel at fixed 4:1 to 1:1 mixing ratio, (g) G’ during hydrogel formation of 1:4 diluted DMEM hydrogel at 4:1 to 1:1 mixing ratio, (h) G’ after hydrogel stabilization of 1:4 diluted DMEM hydrogel at fixed 4:1 to 1:1 mixing ratio.
Figures 3a and 3c shows a temporal increase during the hydrogel formation process in G’ of hydrogels with DMEM and RPMI. As expected, hydrogel concentration was positively correlated with G’ during the hydrogel formation process (Figures 3a and 3c), as well as after hydrogel stabilization (Figures 3b and 3d). The exponential increase of G’ happened in all concentrations of the RPMI hydrogel but was only observed DMEM hydrogels with 1:1 and 1:2 dilution ratios. The gradual progressions and smooth curves indicate stable hydrogel formation. However, the 1:3 and 1:4 diluted DMEM hydrogels showed slow increase in G’ and reached less than 10 Pa after the 30 min experiment. The results indicate that, at low hydrogel concentrations, a higher proportion of ionic molecules in the mixture stabilize the hydrogel (the RPMI hydrogel at 1:1 mixing ratio vs. DMEM hydrogel at 4:1 mixing ratio). To further evaluate this, we selected hydrogel solution at 1:3 and 1:4 dilutions with DI water and mixed them with DMEM at 4:1, 3:1, 2:1 and 1:1 mixing ratios (Figures 3e-3h). As the proportion of DMEM increased, the hydrogel G’ during formation increased in both dilutions (Figures 3e and 3g). After hydrogel stabilization, the mixing ratios that led to the highest of G’ at 1:3 and 1:4 dilutions were 3:1 and 2:1, respectively (Figures 3f and 3h). Considering the hydrogel formation process presented here, a good threshold could be the condition in which G’ can reach over 10 Pa during the first 30 min. Therefore, if the hydrogel can pass this threshold, a higher proportion of hydrogel solution in the mixture will yield a higher G’ value after stabilization. Based on the studies above, using DI water to adjust the hydrogel solution concentration requires a concomitant adjustment of the mixing ratio of diluted hydrogel solution and cell media to ensure stable hydrogel formation. This protocol may need further adjustment when using hydrogels for cell culture, especially for experiments requiring fixed cell seeding numbers. Therefore, we also evaluated the influence of ionic dilution solutions (VitroGel Dilution Solution), which can maintain a fixed mixing ratio (4:1 v/v) with the cell medium after adjusting the hydrogel solution with different dilution ratios. In addition, type 1 (with glucose) and type 2 (without glucose) dilution solutions were used to evaluate the effect of glucose on hydrogel formation. Figure 4a compares the type 1 and type 2 dilution solutions to DI water during hydrogel formation with a 1:3 dilution ratio and a 4:1 mixing ratio of DMEM. The results show the advantages of the dilution solution over DI water in accelerating hydrogel formation. The G’ curves of threshold within 500s of the hydrogel formation process. The exponential increase of G’ during hydrogel formation was also present when we tested different dilution ratios (Figure 4b for type 1 and Figure 4c for type 2). By using dilution solutions, the concentrations of hydrogel solution can be adjusted and subsequently mixed with different types of cell culture media at a fixed 4:1 mixing ratio. Figures 4d and 4e shows hydrogel formation of samples diluted with type 1 and type 2 dilution solutions respectively, at 1:3 dilution ratios. The sample was mixed with different cell culture media (DMEM, DMEM/F12, and RPM1) at the fixed 4:1 mixing ratio. Figure 4f shows the G’ after hydrogel stabilization. With the dilution solution, the final G’ is solely controlled by hydrogel solution concentration, showing the trend of 1:1 > 1:2 > 1:3 dilutions. The results show that both dilution solutions work well with different cell culture media at the fixed 4:1 mixing ratio.
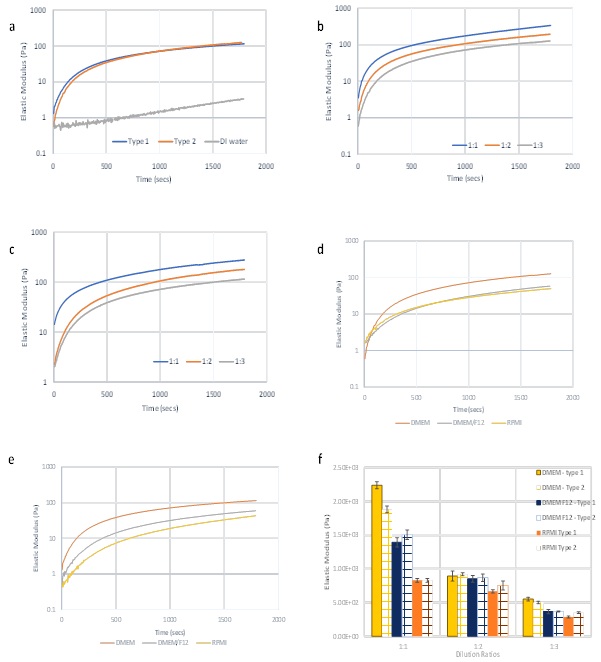 Figure 4: Rheological properties of hydrogels prepared with dilution solutions. (a) Gel formation curves of samples diluted with type 1, type 2 and DI water (1:3 dilution ratios) and mixed with DMEM (4:1 mixing ratio). (b) Gel formation graphs of samples diluted with type 1 dilution solution and (c) type 2 dilution solutions at 1:1, 1:2 and 1:3 dilution ratios and 4:1 mixing ratio with DMEM. (d) G’ of stable hydrogel that prepared with type 1 and type 2 dilution solutions at 1:1 to 1:3 dilution ratios and mixed at the fixed 4:1 mixing ratio with different cell culture media. (e) Gel formation curves of samples diluted with type 1 and (f) type 2 (1:3 dilution ratio) and mixed with DMEM, DMEM/F12 and RPMI (4:1 mixing ratio).
To better understand hydrogel stabilization over time, hydrogel samples with 1:0 to 1:3 dilution ratios and 24 hours after adding cover medium. G’ was tested at the end of each time point to quantify the hydrogel stabilization process. Upon gel solidification, clear gel-liquid phase separation was visible between the hydrogel and cover medium. The gel strength was quantified during the incubation time and the resulting graphs show a gradual increase over time (Figure 5).
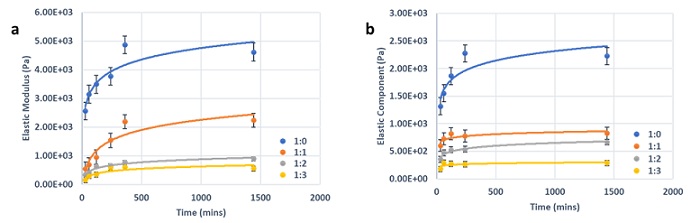 Figure 5: The gel strength was quantified during the incubation time and the resulting graphs show a gradual increase over time.
For DMEM hydrogels, samples reached their respective stable G’ after 6 hours of incubation (Figure 5a) and RPMsI hydrogels reached a stable G’ after 4 hours (Figure 5b). Since ionic concentration (Ca2+ and Na+) is lower in RPMI compared to DMEM, the hydrogel reaches its stable point faster. Overall, DMEM hydrogels have a higher G’ than RPMI hydrogels, likely due to a higher ionic concentration and longer cross linking process during stabilization.
The VitroGel system has unique shear-thinning and rapid recovery rheological properties, which allow for easy pipetting of hydrogel-cell mixtures for cell culture applications and injectable for animal studies. Figure 6 shows the G’ of a DMEM hydrogel under repeated amplitude sweep tests, which allows for the evaluation of dynamic rheological properties. The hydrogel structure was disturbed (decrease of G’) by quickly increasing the shear strain from 0.1% to 500%. Right after the amplitude sweep, a time sweep test with 0.1% shear strain was applied to evaluate the recovery of the G’. Figure 6 shows that more than 60% of G’ was recovered instantly after the 500% shear strain force ceased, and almost 100% of G’ recovered during the 10 min time sweep test. The shear-thinning and rapid recovery properties are repeatable by showing similar G’ patterns during the three amplitude sweep testing circles. An injectable hydrogel needs to possess shear-thinning and rapid recovering mechanical properties. During injection, the hydrogel will be extruded out of the syringe, disrupting its stable physical structure. The rheological properties under the shearing force are an important indicator of the ability of the hydrogel to maintain a physical structure upon disruption [23,24].
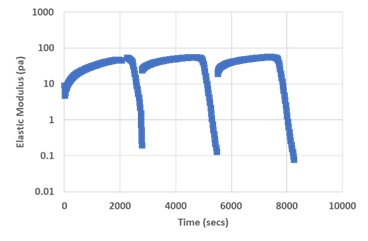 Figure 6: G’ of DMEM hydrogel showing the shear-thinning and rapid recovery property.
Molecular Diffusion Test
To evaluate the molecular diffusion within the hydrogel, we utilized four types of molecules (phenol red, trypan blue, BSA, and IgG) with different sizes. The following different hydrogel conditions were also considered: 1) molecule diffusion during hydrogel formation and after hydrogel stabilization, 2) molecule diffusion in different hydrogel concentrations. Figure 7a shows that initial trypan blue diffusion was faster in a hydrogel incubated for 30 min than overnight (e.g. 40% of trypan blue can pass though the 30 min hydrogel vs. 15% passing through the overnight hydrogel, after the first 30 mins of the experiment). Despite initial low diffusion rates in overnight hydrogels, molecules eventually complete diffusion after 200 min in both hydrogel conditions. Figure 7b shows an inverse relationship between the trypan blue diffusion rate and hydrogel concentrations. Figure 7c shows that the diffusion rate is highly dependent on the diffusion particle size. For example, phenol red reaches a diffusion endpoint within 1 hour and maintains a 74% concentration. Trypan blue is completely diffused after 3 hours. Moreover, BSA reaches a stabilized concentration of 54% within 4 hours, whereas, within 2 hours, IgG reaches a stabilized concentration of about 28%. Drug screening and cell therapy studies are dependent on the ability of a 3D system to promote absorption, distribution, metabolism, and excretion of cellular interacting molecules [19,22,24]. These findings illustrate that this hydrogel system is suitable for such studies.
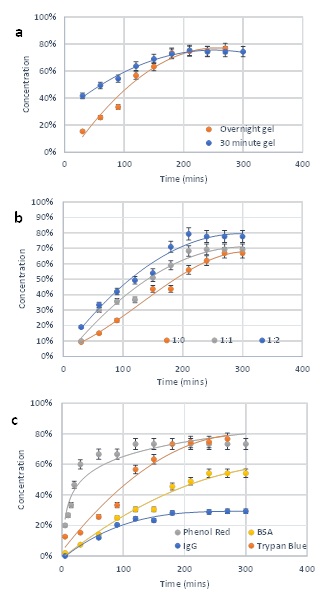 Figure 7: Molecular diffusion of hydrogel system. (a) Diffusion of trypan blue through hydrogels with 30 minutes stabilization and overnight stabilization. (b) Diffusion of trypan blue in hydrogels at 1:0, 1:1 and 1:2 dilutions after overnight stabilization. (c) Diffusion of phenol red, trypan blue, BSA and IgG in hydrogel.
3D Cell culture on hydrogel system
U-87 MG cells were embedded within the hydrogel (unmodified and modified with the RGD integrin-binding ligand). The hydrogels were prepared at 1:3 dilution (with dilution solution) and 4:1 mixing to attain a stable enough elastic modulus to support the glioblastoma cells. The 4:1 mixing ratio was selected since the gel formation tests showed stable formation for different ranges of cell culture mediums. The dilution ratio, 1:3 was selected to create a soft environment to mimic the texture of the human brain, enabling more realistic growth of the glioblastoma cells. Figures 8a-8c demonstrate that V-3D (hydrogel not containing any peptide modifications) can support the growth and proliferation of U-87 MG cells. Interestingly, typical epithelial (U87 MG) morphologies were not observed in this system (Figure 8c). However, hydrogel modified with an integrin-binding ligand, RGD, supported the development of cell type-specific morphologies (Figures 8d-8f)). The RGD modification was performed to introduce bioactivity to the tunable hydrogel and examine the influence it would have on cell growth and morphology. RGD promotes endothelial and fibroblast cell adhesion to the extracellular matrix, thereby driving cell-matrix and cell-cell interactions. These results illustrate the ability of hydrogels modified with different functional binding ligands to stimulate specific cell reactions (Figure 8f). This quality will allow researchers to manipulate the biochemical properties of the system, promoting the study of cell behaviors in more complex and physiologically relevant ways [25-28].
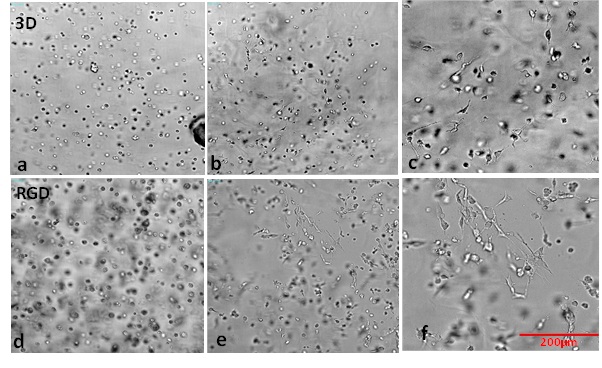 Figure 8: Showing day 1 and day 7 (10x magnification) of U87 MG (embedded in unmodified hydrogel, V-3D (a, b & c) and modified hydrogel with integrin binding ligand, V-RGD (d, e & f). Day 1 images are a & d while day 7 images are b & e. c & f are enlarged images of day 7 images (b & e respectively) to show the morphology of the cells. The hydrogels were prepared at 1:3 dilution with type 1 dilution solution and 4:1 mixing with αMEM and 10% FBS.
CONCLUSION
Undefined components, temperature instability and batch-to-batch matrix inconsistencies can make 3D cell culture difficult. The VitroGel® system overcomes these obstacles as it is xeno-free, room temperature stable and reproducible. The results show that the ions present in cell culture media modulate hydrogel cross linking to produce a wide range of matrix stiffnesses. The shear-thinning property of the hydrogel makes it injectable, allowing for droplet retention during in vivo studies. The hydrogel can also be functionally modified to induce cell-matrix interactions allowing the researcher to explore cellular responses in more complex and physiologically relevant contexts. Altogether, the hydrogel allows for the development of robust 3D cell models for drug discovery, cancer cell biology, stem cell research, and many other cell-based applications.
REFERENCES
- Antoni D, Burckel H, Josset E, Noel G (2015) Three-Dimensional Cell Culture: A Breakthrough in Vivo. Int J Mol Sci 16: 5517-5527.
- Caliari SR, Burdick JA (2016) A Practical Guide to Hydrogels for Cell Culture. Nature Methods13: 405-414.
- The Well Bioscience (2019) Why 3D Cell Culture? Comparing 2D vs 3D Cell Culture. The Well Bioscience, USA.
- The Well Bioscience (2018) Long-Term Neuron Culture Maturation in 3D Hydrogel Constructs. The Well Bioscience, USA.
- The Well Bioscience (2017) VitroGel® 3D. TheWell Bioscience,
- The Well Bioscience (2019) VitroGel® Cell Recovery Solution (100 mL). TheWell Bioscience, USA.
- Edmondson R, Broglie JJ, Adcock AF, Yang L (2014) Three-Dimensional Cell Culture Systems and Their Applications in Drug Discovery and Cell-Based Biosensors. ASSAY and Drug Development Technologies 12: 207-218.
- Kim EJ, Yang C, Lee J, Youm HW, Lee JR, et al. (2020) The new biocompatible material for mouse ovarian follicle development in three-dimensional in vitro culture systems. Theriogenology 144: 33-40.
- Thanindratarn P, Li X, Dean DC, Nelson SD, Hornicek FJ, et al.(2020) Establishment and Characterization of a Recurrent Osteosarcoma Cell Line: OSA 1777. J Orthop Res 38: 902-910.
- Ma H, Seebacher NA, Hornicek FJ, Duan Z (2019) Cyclin-dependent kinase 9 (CDK9) is a novel prognostic marker and therapeutic target in osteosarcoma. EBioMedicine39: 182-193.
- The Well Bioscience (2019) 3D Cell Culture of Bone Marrow Stroma Cells (OP9) on VitroGel® Hydrogel System. The Well Bioscience, USA.
- The Well Bioscience (2018) 3D Cell Culture of Human Colon Cancer Cells (HCT116) on VitroGel® System. The Well Bioscience, USA.
- The Well Bioscience (2018) 3D Cell Culture of Human Pancreatic Cancer Cells (PANC-1) on VitroGel® System. The Well Bioscience, USA.
- The Well Bioscience (2018) Long-Term Neuron Culture Maturation in 3D Hydrogel Constructs. TheWell Bioscience, USA.
- The Well Bioscience (2019) VitroGel® Dilution Solution TYPE 1 (100 mL). The Well Bioscience, USA.
- The Well Bioscience (2019) VitroGel® Dilution Solution TYPE 2 (100 mL). TheWell Bioscience, USA.
- Wang F, Nan LP,Zhou SF, Liu Y, Wang ZY, et al. (2019) Injectable Hydrogel Combined with Nucleus Pulposus-Derived Mesenchymal Stem Cells for the Treatment of Degenerative Intervertebral Disc in Rats. Stem Cells Int Article ID: 8496025.
- Borzi C, Calzolari L, Ferretti AM, Caleca L, Pastorino U, et al. (2019) c-Myc shuttled by tumour-derived extracellular vesicles promotes lung bronchial cell proliferation through miR-19b and miR-92a. Cell Death & Disease10: 759.
- Di Donato M, Cernera G, Migliaccio A, Castoria G (2019) Nerve Growth Factor Induces Proliferation and Aggressiveness in Prostate Cancer Cells. Cancers (Basel)11:
- Xiao M, Qiu J, Kuang R, Zhang B, Wang W, et al.(2019) Synergistic effects of stromal cell-derived factor-1α and bone morphogenetic protein-2 treatment on odontogenic differentiation of human stem cells from apical papilla cultured in the VitroGel 3D system. Cell Tissue Res 378: 207-220.
- Li X, Seebacher NA, Xiao T, Hornicek FJ, Duan Z (2019) Targeting regulation of cyclin dependent kinase 9 as a novel therapeutic strategy in synovial sarcoma. J Orthop Res 37: 510-521.
- Huang J (2019) 3D Cell Culture on VitroGel System. J Cytol Tissue Biol 6: S1001.
- Powell K (2017) Adding depth to cell culture. Science AAS, Washington DC, USA.
- Mahauad-Fernandez WD, Naushad W, Panzner TD, Bashir A, Lal G, et al.(2018) BST-2 promotes survival in circulation and pulmonary metastatic seeding of breast cancer cells. Sci Rep 8:
- Bellis SL (2011) Advantages of RGD peptides for directing cell association with biomaterials. Biomaterials 32: 4205-4210.
- Yoshida N, Ishii E, Nomizu M, Yamada Y, Mohri S, et al. (1999)The laminin-derived peptide YIGSR (Tyr–Ile–Gly–Ser–Arg) inhibits human pre-B leukaemic cell growth and dissemination to organs in SCID mice. Br J Cancer 80: 1898-1904.
- Boateng SY, Lateef SS, Mosley W, Hartman TJ, Hanley L, et al.(2005) RGD and YIGSR synthetic peptides facilitate cellular adhesion identical to that of laminin and fibronectin but alter the physiology of neonatal cardiac myocytes. Am J Physiol Cell Physiol 288: 30-38.
- Mazzeo MS, Chai T, Daviran M, Schultz KM (2019) Characterization of the Kinetics and Mechanism of Degradation of Human Mesenchymal Stem Cell-Laden Poly(ethylene glycol) Hydrogels. ACS Appl Bio Mater2: 81-92.
Citation: Haruna NF, Huang J (2020) Investigating the Dynamic Biophysical Properties of a Tunable Hydrogel for 3D Cell Culture. J Cytol Tissue Biol 7: 030.
Copyright: © 2020 Nana-Fatima Haruna, et al. This is an open-access article distributed under the terms of the Creative Commons Attribution License, which permits unrestricted use, distribution, and reproduction in any medium, provided the original author and source are credited.