Isolation of AspergillusFlavusfrom Dairy Cattle Feed and Assessment of Aflatoxin M1 in Milk from Small Dairy Farms around Harare, Zimbabwe
*Corresponding Author(s):
Gufe ClaudiousDepartment Of Veterinary Services, Central Veterinary Laboratory, P. Bag CY551, Harare, Zimbabwe
Tel:+263 773 202 158,
Email:claudiousgufe3@gmail.com
Abstract
There is a direct association between the concentration of aflatoxin M1 (AFM1) in milk and of aflatoxin B1 (AFB1) in feed for dairy cattle leading to AFM1 to be found in the milk of animals that are fed on AFB1 contaminated feed. The aim of this study was to determine the occurrence of Aspergillusflavus contamination in dairy cattle feed and quantify the amount of AFM1 in raw cow's milk. The presence of Aspergillusflavus in dairy cattle feed and the levels of aflatoxin M1 in raw milk was noted from four smallholder dairy farms. A total of 40 feed samples and 49 raw milk samples were collected. Feed samples were cultured on Sabouraud Dextrose Agar and Aspergillusflavus was identified using its macro and microscopic features whereas the levels of aflatoxin M1 in the milk samples was determined using High Performance Liquid Chromatography (HPLC). Aspergillusflavus was present in all the feed samples collected and aflatoxin M1 was detected in 45 out of the 49 milk samples (91.8% of the tested milk samples) and the aflatoxin M1 (AFM1) concentrations in the milk ranged from 0.1 to 4.3μg/L. There was a positive correlation between A. flavus detected in feed and aflatoxin M1 detected in milk (r=0.758) and there was no statistical significant difference in terms of aflatoxin M1 in milk among the tested farms (p-value = 0.071). The samples contaminated with AFM1 did not adhere to the maximum residue limit for aflatoxin M1 in raw milk set by the European Union (?0.05μg/L). The high percentage occurrence of Aspergillusflavus in feeds and high aflatoxin M1 contamination rate in milk indicate a public health hazards that require better feed management systems in the dairy production industry.
Keywords
Aflatoxins contamination; Aspergillusflavus; Small dairy farms
INTRODUCTION
Aflatoxins (B1, B2, G1, G2, M1 and M2) are a group of mycotoxins (secondary metabolites compounds) produced by certain strains of Aspergillusflavus group (Aspergillusflavus, Aspergillusparasiticus, and Aspergillusnomius) in a range of foods, dairy products and feeds, which are toxic, carcinogenic, mutagenic, and immunosuppressive agents [1,2]. Aflatoxins contamination of agricultural and dairy products is a global economic and public health concern [3-5]. There is a direct association between the concentration of AFM1 in milk and of AFB1 in feed for dairy cattle leading to AFM1 to be found in the milk of animals that are fed on AFB1 contaminated feed. The presence of aflatoxin B1 in the feed is due to feed contamination from Aspergillus species like A. flavus, A. nomiusandA.parasiticus. Aflatoxin B1 is a metabolite produced by Aspergillusflavus group and aflatoxin M1 is metabolized from aflatoxin B1 by the liver to a reactive hydroxylated intermediate. Aflatoxin M1 levels in contaminated milk remains unchanged even during the pasteurization process of milk, heat sterilization and cold treatment and therefore, there is need to monitor and control AFM1 levels in commercially sold milk to ensure the welfare of the milk consuming population[6,7]. Milk and milk products can be contaminated with aflatoxins either through cows ingesting aflatoxin contaminated feeds or subsequent contaminated with aflatoxin producing fungi [8,9]. Different environmental factors such as temperature, pH, humidity, and moisture content of the feed influence the occurrence of aflatoxins.
Milk production is one segment in the integrated agriculture based economy of Zimbabwe and dairy farmers make use of feeds generated from maize, cotton and soya production and by-products from downstream industries like grain milling, molasses and brewers grains[10]. Due to the prevailing economic challenges in Zimbabwe, small-holder dairy farmers lack resources that should be used to reduce microbial contaminants and their metabolites in milk production [11]. Knowledge on the hazards that come with farm produce which has not gone under a proper process of traceability lacks among the farm owners, managers and workers[12]. The factors that affect levels of aflatoxin contamination in milk are; the source of animal feeds, and lack of laboratory, human and economic resources on the dairy farm. Moreover, the type of the animal feed and the harvesting time and temperature are also effective parameters of concern in milk contamination by AFM1[13,14]. Improper/poor agricultural practices like insect infestation and poor post-harvest storage conditions of feed promote occurrence of AFM1 in cattle milk [15].
The biggest problem with AFM1 is that it is difficult to detect in milk using human senses because it is odourless, invisible and a very stable compound which is hardly degraded by bio-chemical processes in the bodies of humans and animals [16]. This increases the chances of consumption of AFM1 which is associated with human health problems like cancers and hepatitis, especially in developing and underdeveloped countries [17]. Aflatoxins (which includes AFM1) along with hepatitis B are considered as risk factors of Human Hepatocellular Carcinoma (HCC) in China and North Africa, with an estimated 250 000 deaths annually [13]. Adverse health effects of toxigenic moulds and mycotoxinshavebeen recognized for centuries following environmental exposures and ingestion of contaminated foods [18]. Over 25% of the world’s production of cereals and raw materials for human and animal consumption are contaminated with various kinds of toxins of fungal origin (mycotoxins). The worldwide pollution of milk and milk products with aflatoxin M1 varies between 40% and 60%. In developed countries, grains infected with Aspergillus are disposed but in Africa where food is in short supply, they are consumed and this causes severe health problems, including high cases of certain cancers [14]. The European Union Commission set a standard regulation limit for aflatoxin M1 permitted in bovine milk at 0.05μg per litre[19]. Milk and milk products are reported to be contaminated with AFM1 in many countries such as Slovenia, North Africa, Turkey, Brazil, Portugal, Pakistan and Iran [20-24]. The presence of AFM1 in milk is under-looked in Zimbabwe due to public ignorance, lack of governing mechanisms and consumption of contaminated food products due to economic instability and droughts. The aim of this study therefore, is to determine the occurrence of Aspergillusflavus contamination in dairy cattle feed, isolate Aspergillusflavus from dairy cattle feed and assess the levels of AFM1 in raw milk from smallholder farmers around Harare, Zimbabwe[25-28].
MATERIALS AND METHODS
Study area
Dairy feed and milk samples were collected from four smallholder dairy farms around Harare over a period of three months (November 2017 to January 2018).
Study design and sample collection
A cross sectional observational study was done on animal feed and milk. A total of 40 feed samples and 49 milk samples were collected. Collection of both feed and milk samples was done once for each farm and all samples were aseptically transported to Central Veterinary Laboratory for analysis. Milk samples were collected according to the number of lactating cows at the farms (number of samples= number of lactating cows). From each cow, 100ml of milk was collected into sterile labelled universal glass tubes through milking and placed into a cooler box with ice packs. The 49 milk samples were collected as follows: 11 milk samples from Farm A in Chitungwiza, 10 milk samples from Farm B in Beatrice, 11 milk samples from Dairy farm D and 17 milk samples from Farm X. The actual farm names were not disclosed due to confidential reasons. Ten (10) hand full feed samples from different sacks were collected randomly from each of the four farms and sealed into sterile labelled plastic bags. The raw materials used to make the feeds were recorded as shown in (Table 1).
|
Farm Name |
Types of feed collected |
Ingredients used to make the feed |
|
Dairy Farm D |
Agrimol feed (Agrifoods) |
Not known |
|
Brewers grain (Masese) |
Barley |
|
|
Farm made feed A |
Maize (cobs and grains), Soya beans, fish meal (matemba) |
|
|
Farm B |
MIDLAK 18% Dairy Meal (National Foods) |
Not known |
|
Dairy Farm A |
Farm made feed A |
Molases, maize grains, ground nutshells and soya beans |
|
Brewers grain (Masese) |
Barley |
|
|
Farm X |
Brewers grain (Masese) |
Barley |
|
Farm made feed A |
Maize (plant,cobs and grains), soya beans and cotton seed |
Table1: Types of feed collected from the four farms.
Isolation of Aspergillusflavus
Apparatus and agar were autoclaved before use and culturing of the feed samples was done in a disinfected fume cabinet and all laboratory windows and doors were kept closed. One plate of Sabouraud Dextrose Agar (SDA) was used for each feed sample, thus each plate was labelled with the name of the farm from which the feed was collected and sample number. During inoculation a few particles of each feed sample were picked using forceps and placed onto its respective SDA plate. The particles were gently spread over the surface of the media and dipped inside the media to a very shallow depth using forceps. The forceps were sterilised after every inoculation by heating dipping in methylated spirit and flamed on a burner between the samples. After inoculation, the plates were incubated at 37? for 1 to 5 days. Each day, changes were noted and recorded until the 5th day. Aspergillus species were identified using their colonial morphology and colony colour. Sub-culturing of fungal where there was a mixture to have a pure culture was done by cutting and discarding a small block of SDA agar to be used as sub-culturing plate using a sterile scalpel. A similar-sized block of agar including fungal hyphae, from the edge of the colony to be sub-cultured was cut and transferred to the subculture plate and placed fitted closely, mould-side up, into cut hole. The cut hyphae regenerated and grew out from the surface of the block after 1-3 days of incubation.
Controls
Controls were prepared using two sterile SDA plates, one plate was left open in the fume cabinet and the other was left open in the incubator for 15 minutes and were incubated along with the test samples. These two sterile plates were used to test contamination of the incubator as well as the fume cabinet. Morphological charts from Clinical Veterinary Microbiology book was used to compare morphological features with the Aspergillus species observed after incubation.
Microscopic Identification
Microscopic identification of A. flavus was done using the sticky tape preparation technique according to Markey and the Mycology Proficiency Testing Program [29]. A clear sellotape (6cm length by 2cm width) was taken between the thumb and middle finger, with the index finger in the centre of the loop that held the sticky side downwards [30]. The adhesive side was pressed firmly down with the index finger on the centre of the colony to be examined. The fruiting heads and spores stuck to the tape and were gently pulled from the mat of the mycelium. The inoculated tape was placed over a drop of lactophenol blue on a microscope slide. The tape was pulled taut and the free sticky ends were folded over each end of the slide. The tape acted as a cover slip and the slides were examined under light microscope using power 10 and power 100 and photographs were taken[31].
Preparation of the milk samples for HPLC
10ml each of milk sample was measured into a clean 50ml polypropylene centrifuge tube using a micropipette. To each sample, 10ml of acetonitrile was added and the mixture was shaken on a vortex mixer for 1 minute. A pre-weighed mixture of 4 grams Magnesium Sulphate (MgSO4) and 1 gram Sodium Chloride (NaCl) was added to each tube and shaken vigorously for 5 minutes. The tubes were then centrifuged at 3500rpm for 12 minutes at 4°C. The clear supernatant was then transferred into 15ml polypropylene centrifuge tubes containing a mixture of 1gram magnesium sulphate and 0.5grams PSA bonded silica and shaken vigorously for 1 minute. These tubes were then centrifuged for 12 minutes at 3500rpm and 4°C. 5ml of the clear supernatant were transferred to clean 15ml borosilicate test tubes. 200μl of dimethylsulfoxide was added to each test tube and the extracts were evaporated in a Dri-Block Sample Concentrator overnight under a steady stream of nitrogen at 45°C. 300μl of the mobile phase (55:45 0.1% formic acid: acetonitrile) were then added to each sample and the tubes vortexed for 30 seconds. Each sample was filtered through 0.2μm PVDF filters into amber HPLC vials ready for analysis using HPLC-FLD.
Detection of Aflatoxin M1
The quantitative analysis of aflatoxin M1 in the milk samples using HPLC was done by isocratic elution using 55:45 0.1% formic: acetonitrile mixture as the mobile phase. A flow rate 0.8ml/min and an Agilent Eclipse XDB C18 column (4.6 x 150mm, 5μm) were used for chromatographic separation and a column temperature of 40°C was maintained. In the Fluorescence Detector, an excitation wavelength of 360nm and an emission wavelength of 435nm were used. A calibration curve was created using matrix matched calibrators in the range 2 – 50 μg/L.
Data analysis
Statistical analysis was performed using R-software version 3.3.3. Chi-square test was used to determine if there was a statistical significant difference among AFM1 concentrations between the farms and to determine the correlation between the isolated fungi and detected aflatoxins qualitatively. Aflatoxin M1 concentration was treated as the response variable and the farm was the factor.
RESULTS
Isolation of Aspergillusflavus: Macroscopic identification
Colonies from figure 1 appeared yellow to green and powdery after 5 days and the conidiophore vesicles observed were globose in shape.All 40 feed samples cultured were positive for the presence of Aspergillusflavus. The fungi were identified using colony morphology as in Figure 1 and using microscopic appearance as indicated in Figure 2. The conidia and conidiophores arrangement in Figure 2 are characteristic of Aspergillusflavus. Organisms like yeasts and Mucor were also present in the feed samples.
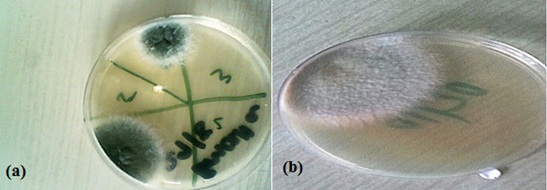 Figure1:(a) and (b) are photographs of macroscopic fungal structures.
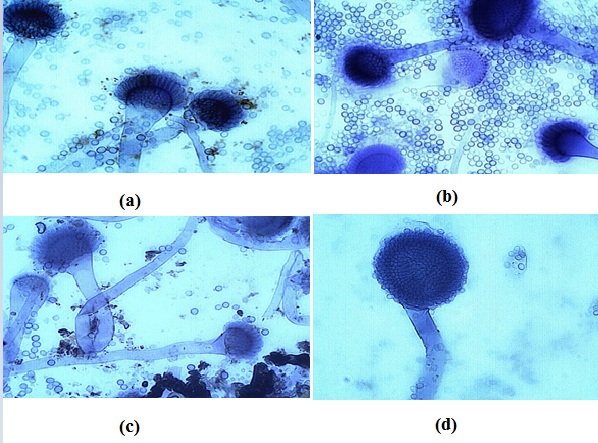 Figure 2: (a,b,c and d) are photographs of microscopic fungal structures observed from food samples.
Detection of AFM1
In 6 out of 10 milk samples from farm B, AFM1 was detected in concentrations ranging from 0.1 to 1.5μg/L as shown in figure 3 and the other 4 samples had AFM1 levels below the limit of quantification (0.005 μg/L). All the 7 milk samples had AFM1 levels higher than the maximum threshold limit (0.05 μg/L) accepted by European Union (Figure 3).
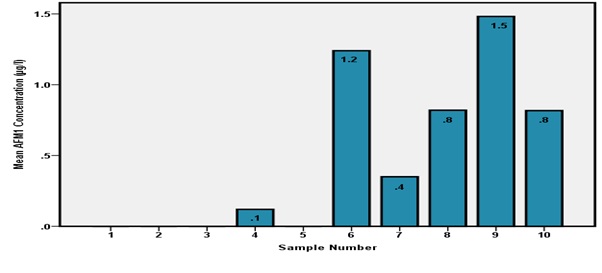 Figure 3: AFM1 concentrations for Farm B.
All 11 milk samples from dairy Farm A had aflatoxin M1 in concentrations ranging from 0.6 to 4.6 μg/L therefore they all failed to comply with European Union standards (Figure 4). Milk sample number 8 had the highest concentration of AFM1 of 4.6 μg/L as shown in figure 4.
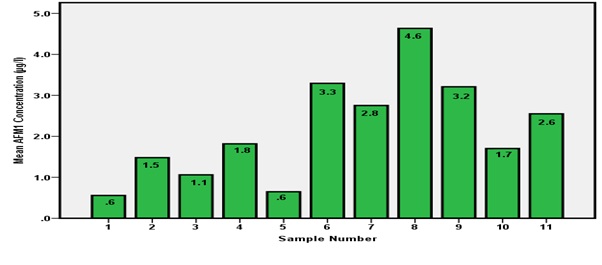 Figure 4: AFM1 concentrations from Dairy Farm A.
All 11 samples from Farm D failed to comply with European Union standards as the AFM1 concentration ranged from 1.1 to 4.3 μg/L (Figure 5). Milk sample number 2 has the highest AFM1 concentrations of 4.3 μg/L as indicated in (Figure 5).
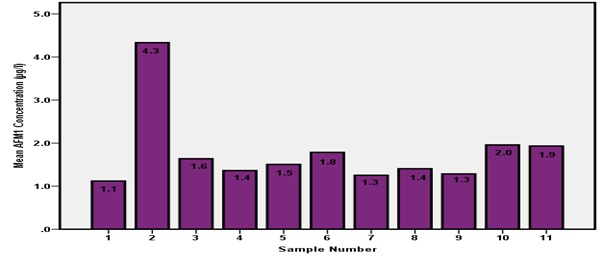 Figure 5: AFM1 concentrations from Farm D.
All 17 samples from Farm X shown in Figure 6did not comply with European Union standards with AFM1 levels ranging from 0.1 to 3.6 µg/L.
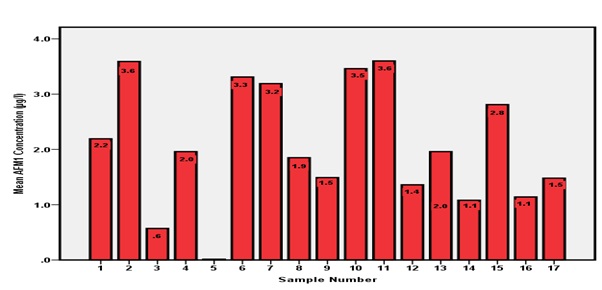 Figure 6: AFM1 concentrations from Farm X.
Inclusively, of the 49 samples tested, AFM1 was detected in 45 samples (91.8%) and mean AFM1 level at 95% confidence interval for each farm did not comply with the EU standards as indicated in Figure 7. There were no significant differences in AFM1 concentrations between farm A, farm D and Farm X but AFM1 concentration for farm B was significantly low from the other farms as shown by the error bars in Figure 7. There was no statistical significant difference in terms of the amount of aflatoxin M1 detected from the four farms in this study at 95% confidence level (p- value=0.071). The results shown that there was a positive correlation between A .flavus detected in feed and aflatoxin M1 detected in milk (r = 0.758).
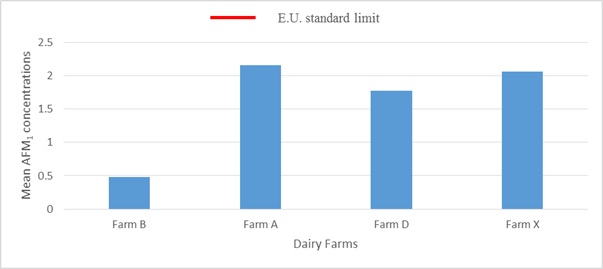 Figure 7: Mean AFM1 levels for the farms.
DISCUSSION
Detection of A. flavus in Feed
In this study, Aspergillusflavus was isolated from all the feed samples and this indicated high mould contamination of the feed thus predicting high AFM1 contamination in the milk produced at the farms. During sample collection, the researchers noticed that the feeds were not stored in an exclusively controlled environments on the farms. Due to this, the feeds were exposed to environmental conditions conducive for the spread and growth of aflatoxigenic A. flavus group such as humidity and outdoor temperatures that determine the synthesis of aflatoxin B1.
This lack of exclusive storage sites promotes mechanical agents that impair the physical state of feed such as insects, which act as vectors of fungal spores and mechanically damage the feed allowing the growth of moulds. Thus the presence of insects acting as agents for spreading microorganisms that contributes to the proliferation of Aspergillusflavus in dairy cattle feed was reported by Khilosia and Dutton. Practices such pest control can mitigate both mould and aflatoxin contamination but involve more production costs.
Another factor which could have contributed to the high incidence of A. flavus in the feed samples is that the time during which the samples were collected. The samples were collected at the beginning of the rainy season, therefore rapid environmental changes in atmospheric moisture and temperature may have promoted the growth of A. flavus. For optimum growth, Aspergillusflavus requires relative humidity ranging from 70% to 80% and a temperature range of 20ºC to 30ºC [32]. The farms sampled are in the Agro-economical region II of Zimbabwe which is characterised by conditions mentioned above and receives annual rainfall of 700 to 1050mm mainly confined to the summer season [33]. Meteorology plays a crucial role in enhancing plant-pathogen interactions and aflatoxin production between years [34].The diverse feed ingredients used at the farms promote the proliferation of the A. flavus. As the feed consumed by the cattle of made from a wide array of ingredients (molasses, soya meal, groundnut meal and maize etc.), these ingredients require different storage conditions, and this contributes to the high incidence of A. flavus. The farms sampled in the study practise zero grazing in which the cattle do not graze in pastures but are rather feed with prepared feed. Ingredients used to manufacture feed may contain A. flavus spores from the pre-harvest and post-harvest periods and these spores become viable when favourable conditions are experienced during storage before and after the feed has been manufactured on the farms. In the case of commercial feed tested, contamination could have occurred before the feed was purchased (during manufacture or during storage in the shops) or after purchase (during transportation to the farm and during storage at the farms, thus contamination of feed with aflatoxigenic moulds can occur at different stages.
Ndungu showed that Aspergillus species are the most ubiquitous groundnut fungi whereas Dutta and Das showed that A. flavus was more aggressive when contaminating peanut more frequently than its Section Flavi counterparts like A. parasiticus. Accensi also reported that A. flavus was the most predominant member of Aspergillus in mixed feeds[35-37]. Aspergillusflavus is variably adapted to different geographical locations and the percentage of aflatoxigenic fungi isolated from animal feeds is depend on the type of feed and environmental conditions with A. flavus as the most common species [38].
The high incidence of A. flavus in the feed samples suggests that dairy farms around Harare are lacking hygienic practises that reduce mould contamination in feed, thus AFM1 contamination of the milk produced. It is therefore important to screen feed commodities for aflatoxigenic fungal contaminants as a way to reduce aflatoxin M1 contamination in milk. Mould contamination of feeds accounts for significant economic losses in animal husbandry and undesirable trade barriers for raw materials and consumable products like milk [39].
Detection of Aflatoxin M1
In this study, AFM1 was detected in 45 (91.8%) of the 49 milk samples tested ranging between 0.1 to 4.6 μg/L. Elzupir and Elhussein obtained similar results in Sudan where AFM1 was detected in 95.5% of milk samples with concentrations ranging from 0.2 to 6.9 μg/L[40]. The four samples in which AFM1 was not detected were from farm B (Figure 3) and this may have been as a result of the feeding regime practised at the farm during the time of sample collection. Although A. flavus was isolated from all feed samples collected from farm B, the use of one type of feed (MIDLAK 18% Dairy Meal manufactured by National Foods) (Table 1) may have influenced the detection of no AFM1 in 40% of the samples, suggesting that the use of different types of feed may influence high incidence of AFM1 in milk from individual cows as found from the other farm. Feed susceptibility to A. flavuscontamination is dependent on the different ingredients used in feed manufacture.
The highest recorded AFM1 level in this study was 4.6 μg/L from farm D and this could have been as a result of the use of three types of feed (Agrimol feed manufactured by Agri-foods, Brewers grain and Farm made feed) giving A. flavus a wide variety of substrates for the production of AFB1 which leads to AFM1 in milk produced by the cattle. The magnitude of aflatoxins contamination varies with geographical setting, farming practices, and the vulnerability of produces to aflatoxigenic fungi invasion during storage and processing periods [41,42]. As there were no significant differences in the AFM1 concentrations between farmD, farm A and Farm X, AFM1 concentrations from farm B was significantly different to the other farms (Figure 7), but the mean AFM1 levels for each farm were way above the EU standard suggesting that milk produced by smallholder dairy farms around Harare is not safe for human consumption. Most of the milk samples tested (91.8%) in this study did not comply with the European Union maximum residue limit for AFM1 (0.05μg/L) in raw milk therefore people consuming this milk are prone the acute and chronic effects of aflatoxin M1. The milk production conditions prevailing at the farms had an effect on influencing AFM1 levels in the milk, therefore smallholder dairy farms around Harare need to assess these conditions for the production of quality milk safe for consumption.
CONCLUSION
Presence of AFM1 in milk poses a serious public health concern especially high risk age groups (infants, old people) and immunocompromised people who consume milk frequently. It is also extremely important to reduce animal feed from contamination from aflatoxigenic fungi and maintain low levels of AFB1 in the feeds of dairy animals. Moreover, since AFM1 is well known to be mutagenic and carcinogenic, farmers should try by any means necessary to reduce AFM1 production in milk at the same time regulatory authorities strictly monitoring standards for this toxin and inform both farmers and dairy companies about the importance of AFB1 and AFM1 and the consequences of AFM1 presence in their products.
RECOMMENDATIONS
- There should be strict AFM1 surveillance systems for milk produced by smallholder dairy farms around Harare and Zimbabwe as a whole to ensure the welfare of the milk consuming population.
- There is need to educate farm personnel on the lethal effects of AFM1 and hygienic precautions that can reduce proliferation of aflatoxigenic fungi during feed storage.
- Further studies should be carried out which cover the whole country and focus should also on large scale dairy farmers which are major producers of milk and milk products.
- The research in this case focused on raw milk we recommend that future researches should extend to milk products and effects of contaminated feeds on the dairy cows.
REFERENCES
- Galofaro V, Ritieni A, Bognanno M, De-Angelis A, Galvano G (2001) Survey of the occurrence of aflatoxin M1 in dairy products marketed in Italy: Second year of observation. Food AdditContam 18:644-646.
- Lanyasunya TP, Wamae LW, Musa HH, Olowofeso O, Lokwaleput IK (2005) The risk of mycotoxins contamination of dairy feed & milk on smallholder dairy farms in Kenya. Pak J Nutr 43:162-169.
- Peraica M, Marija A, Domijan JZ, Cvjetkovic B (2002) Prevention of exposure to mycotoxins from food & feed. Arch IndHyg Toxic 53:229-237.
- Sugiyama K, Hiraoka H, Sugita-Konishi Y (2008) Aflatoxin M1 contamination in raw bulk milk & the presence of aflatoxin B1 in corn supplied to dairy cattle in Japan. ShokuhinEiseigakuZasshi 49:352-355.
- Yiannikouris A, Jouany JP (2002) Mycotoxins in feeds & their fate in animals: A review. Anim. Res 51:81-99.
- Bakirci I (2001) A study on the occurrence of aflatoxin M1 in milk & milk products produced in Van province of Turkey. Food Control 12:47-51.
- Nogaim QA (2014) Aflatoxins M1 and M2 in Dairy Products. J ApplChem 2:14-25.
- Celik TH, Sarimehmetoglu B, Kuplulu O (2005) Aflatoxin M1contamination in pasteurised milk. VeterinarskiArhiv 75:57-65.
- Sarimehmetoglu B, Kuplulu O, Celik TH (2003) Detection of aflatoxin M1 in cheese samples by ELISA. Food Control 15:45-49.
- National association of Dariy Farmers (NADF). (2013). The Dairy Industry in Zimbabwe A Brief Historical Overview.
- Gran HM, Mutukumira AN, Wetlesen A, Narvhus JA (2002) Smallholder dairy processing in Zimbabwe: the production of fermented milk products with particular emphasis on sanitation and microbiological quality. Food Control 13: 161-168.
- Mupunga I (2013) A comparative study of natural contamination with aflatoxins and fumonisins in selected food commodities from Botswana and Zimbabwe. University of South Africa.
- Fragoso E, David T, Romero S, Ospino H (2003) Determination of aflatoxin M1 in raw milk by HPLC marker as evidence of cattle- food storage conditions from the herd suppliers of a dairy company in the city of Valledupar. University of Santander, Valledupar, Colombia.
- Anthony MH, Francis DM, Berka NP, Ayinla GT, Haruna OG (2012). Aflatoxin Contamination in Foods and Feeds: A Special Focus on Africa.
- Alonso VA, González PML, Armando MR, Dogi CA, Dalcero AM et al (2005) Aflatoxins – Detection, Measurement andControl. Silage Contribution to Aflatoxin B 1 Contamination of Dairy Cattle Feed.
- Khilosia LD, Dutton MF (2011) A surveillance study of mycotoxins in the South African industry with specific reference to aflatoxin B 1 in feed and aflatoxin M 1 in farm gate and selected commercially available dairy milk.
- Mulunda M, Ngoma L, Nyirenda M, Motsei L, Bakunzi, F (2013) A Decade of Aflatoxin M 1 Surveillance in Milk and Dairy Products in Developing Countries. North West University.
- Udom IE, Ezekiel CN, Fapohunda SO, Okoye ZSC, Kalu CA (2012) Incidence of Aspergillus Section Flavi and Concentration of Aflatoxin in Feed Concentrates for Cattle in Jos, Nigeria. J Vet Adv 2:39-46.
- Behfar A, Khorasgani ZN, Alemzadeh ZZ, Goudarzi Z, Ebrahimi R, etal (2012) Determination of Aflatoxin M1 Levels in Produced Pasteurized Milk in Ahvaz City by Using HPLC. J Natural Pharmaceutical Products 7:80–84.
- Torkar KG, Vengus T (2008) The presence of yeasts moulds &aflatoxin M1 in raw Milk & cheese in Slovenia. Food Control 19:570-577.
- Elgerbi AM, Aidoo KE, Candlish AG, Tester RF (2004). Occurrence of aflatoxin M1 in randomly selected in North African milk & cheese samples. Food AdditContam 21:592-597.
- Tekinsen KK, Eken HS (2008) Aflatoxin M1 levels in UHT milk &kashar cheese consumed in Turkey. Food ChemToxicol 46:3287-3289.
- Unusam N (2006) Occurrence of aflatoxin M1 in UHT milk in Turkey. Food ChemToxicol 44:1897-1900.
- Garrido NS, Iha MH, Santos-Ortolani MR, Duarte-Fávaro RM (2003) Occurrence of aflatoxins M1 & M2 in milk commercialized in RibeirãoPreto-SP Brazil. Food AdditContam 20:70-73.
- Oliveira CAF, Franco RC, Rosim RE, Fernandes AM (2011) Survey of aflatoxin M1 in Mina’s cheese from the North-east region of São Paulo Brazil. Food AdditContam 4:57-60.
- Martins ML, Martins HM (2004) Aflatoxin M1 in yoghurts in Portugal. Int J Food Microbiol 91:315-317.
- Hussain I, Anwar J (2008) A studies on contamination of aflatoxin M1 in raw milk in the Punjab province of Pakistan. Food Control 19:393-395.
- Rahimi E, Bonyadian M, Rafei M, Kazemeini, HR (2010) Occurrence of aflatoxin M1 in raw milk of five dairy species in Ahvaz Iran. Food &ChemToxicol 48: 129–131.
- Raper KB, Fennel DT (1965) The genus Aspergillus. The Williams and Wilkins Co. Baltimore, USA.
- European Commission (2010) Commission regulation of 26 February 2010 setting maximum levels for certain contaminants in foodstuffs as regards aflatoxins. J European Union 50:8-11.
- Agilent Technologies Incorporated (2012) Basics Fundamentals of High Performance Liquid Chromatography (HPLC). HPLC Basics 01-37.
- Pratiwi C, Rahayu WP, Lioe HN, Herawati D, Broto W, et. al (2015) The effect of temperature and relative humidity for Aspergillusflavus BIO 2237 growth and aflatoxin production on soybeans. Int Food Res J 22:82-87.
- Food and Agriculture Organization (FAO) of the United Nations (2011). Worldwide regulations for mycotoxins in food and feed. Food Nutrition 81.
- Battilani P, CamardoLeggieri M, Rossi V, Giorni P (2013) AFLA-maize, a mechanistic model for Aspergillusflavus infection and aflatoxin B1 contamination in maize. Comput Electron Agric 94:38-46.
- Ndungu JW, Makokha AO, Onyango CA, Mutegi CK, Wagacha JM et al (2013) Prevalence and potential for aflatoxin contamination in groundnuts and peanut butter from farmers and traders in Nairobi and Nyanza provinces of Kenya. J ApplBiosci 65: 4922-4934.
- Dutta TK, Das P (2001). Isolation of aflatoxigenic strains of Aspergillus and detection of aflatoxin B 1 from feeds in India. Mycopathologia 151:29-33.
- Accensi F, Abarca ML, Carbanes FJ (2004) Occurrence of Aspergillus species in mixed feeds and component raw materials and their ability to produce ochratoxin A. Food Microbiol 21:623-627.
- Alinezhad S, Tolouee M, Kamalzadeh A, Motalebi AA, Nazeri M et al (2011) Mycobiota and aflatoxin B1 contamination of rainbow trout (Oncorhinchusmykiss) feed with emphasis to Aspergillus section Flavi. Iran J Fish Sci 10:363-374.
- Wu F (2006) Mycotoxin reduction in Bt corn: potential economic, health, and regulatory impacts. Transgenic Res 15:277-289.
- Elzupir AO, Elhussein AM (2010)Determination of aflatoxin M in dairy cattle milk in Khartoum State, Sudan. Food Control21:945-946.
- Kim EK, Shon DH, Ryu D, Park JW, Hwang HJ (2000) Occurrence of aflatoxin M1 in Korean dairy products determined by ELISA & HPLC. Food AdditContam 17:59-64.
- Fung F, Clark RF (2004) Health effects of mycotoxins: A toxicological overview. J ToxicolClinToxicol 42:217-234.
Citation: Claudious G, Sheperd M, TungamirayiMC, Prosper J, JerikiasM (2019) Isolation of Aspergillusflavus from dairy cattle feed and assessment of Aflatoxin M1in milk from small dairy farms around Harare, Zimbabwe. Adv Microb Res 3: 009.
Copyright: © 2019 Gufe Claudious, et al. This is an open-access article distributed under the terms of the Creative Commons Attribution License, which permits unrestricted use, distribution, and reproduction in any medium, provided the original author and source are credited.