Machine Learning through FMTVDM Proprietary QCA Equations
*Corresponding Author(s):
Richard M FlemingThe Camelot Foundation, FHHI-Omnific Imaging-Camelot, California, United States
Tel:+1 818 210 6930,
Email:DrRichardMFleming@gmail.com
Abstract
The primary author’s previous works on phantom studies have demonstrated an accuracy of ± 0.1 millimeter for quantitative coronary arteriography. This study investigated the clinical results of 1001 stenotic lesions to determine the variability of stenosis flow reserve and percent diameter stenosis using proprietary equations derived from that work. Stenosis flow reserve is a useful clinical measurement with Stenosis Flow Reserve (SFR) ranging from 4 to 5 for lesions with less than 40 Percent Diameter Stenosis (% DS). The mean stenosis flow reserve can be predicted on the basis of % DS alone (R = 0.98). Using proprietary equations, % DS can be derived despite lesion eccentricity and angulation of entry to and from the narrowing, with ranges from 0.1 to 0.4 millimeters (one standard deviation) depending upon the severity of the lesion in question.
This QCA work once coupled with FMTVDM, allows machine measurements, which define the extent of (CAD) without error. The integration of these two systems together produced the first truly Artificial Intelligence (AI) system capable of learning from itself, independent of human error.
Keywords
INTRODUCTION
Disease is not an all or none phenomena but rather a continuum [1,2] as genetic and environmental factors interact. Thus, to develop true AI requires the ability to accurately, consistently and reproducibly measure these transitional changes; not only for diagnostic purposes but also for assessment of treatment response.
Quantitative Coronary Arteriography (QCA) [3-6] provides an absolute measurement of the extend of coronary artery disease, defining Percent Diameter Stenosis (% DS) in two orthogonal views, Percent Area Stenosis (% AS), absolute length of lesion, entry and exit angles, density data and measured flow reserve. Flow reserve has been labeled both as Coronary Flow Reserve (CFR) and Stenosis Flow Reserve (SFR), which are the same value which merely differentiate for the uninitiated whether a coronary lumen narrowing exists or not.
The reliability and reproducibility of Automated QCA has been determined using phantoms and clinical studies, providing an accuracy of ± 0.1 millimeter [4-11]. Limitations in the value of visual qualitative interpretation of coronary arteriograms have been compared with automated quantitative coronary arteriography [4]. While it is possible to reduce, although not eliminate, the human error introduced into qualitative interpretation of coronary arteriograms [12], coronary artery disease itself is not merely a narrowing of a coronary artery but rather a limitation in the ability of the artery to maximally dilate when needed to enhance coronary blood flow; aka. reserve [13]. The limitations of qualitative evaluations of Coronary Artery Disease (CAD) have been well established [14-17].
Despite certain limitations that may affect QCA (distal lesions, inadequate contrast, poor image quality, overlapping vessels, vessel angulation), QCA has become a useful tool in detecting subtle changes in coronary atherosclerosis [3-11]. When used in conjunction with The Fleming Method for Tissue and Vascular Differentiation and Metabolism (FMTVDM), absolute quantification of the extent of CAD can be derived from FMTVDM through the use of proprietary equations, [18-24] which corrects the errors originally made in SFR-% DS using dog models [8,25].
Given the interest in the development of AI to improve both diagnostic evaluation and assessment of treatment responses, it is critical that we recognize that true AI is the development of a system, which is not qualitative and is not based upon probabilities but rather absolute quantitative measurements against which clinical decisions can be made.
The validation of FMTVDM has been well established elsewhere (patent # 9566037) in the medical literature, inter alia references [18-24]. To determine if true AI/ML can occur through the exchange of measurements made by two different machine methods, viz. FMTVDM and QCA, we need to know that the exchange of data between these machine systems represent accurate, consistent and reproducible results.
Prior QCA studies have only looked at the reproducibility of QCA on phantom images and have not closely examined the clinical variability associated with nondiscrete, eccentric lesions occurring in coronary lumens, which are not straight. This study investigates the parameters and variability associated with automated quantitative coronary arteriography and compares percent diameter stenosis with stenosis flow reserve. If we can guarantee the validity of the QCA measurement system, then the proprietary equations so derived and used with FMTVDM, provide a true means for the two machine methods teaching each other, thereby increasing diagnostic and therapeutic accuracy, devoid of human intervention and error.
METHODS
Data acquisition and analysis
Coronary arteriograms
Automated Quantitative Coronary Arteriography (QCA)
The second validated QCA system [9] also utilized end diastolic cine frames using a high resolution (2048 by 3072 pixel) Charged Coupled Device (CCD) to digitize images, which were processed and stored on an Apollo DN 3000 computer workstation.
STATISTICAL ANALYSIS
QCA TO FMTVDM RESULTS
As figure 1 [26] shows, there is no appreciable decrease in stenosis flow reserve until a 15-20 percent reduction in lumen diameter is present. For the most part, SFR remains in the 4 to 5 region until % DS reaches 35 to 40 percent, explaining why there is a delay in angina symptoms in many people whose inflammatory plaques have already impaired arterial function but have not yet impeded resting lumen flow. Consequently, this model explains why so many people experience myocardial infarctions from plaque rupture with no prior anginal warning signs.
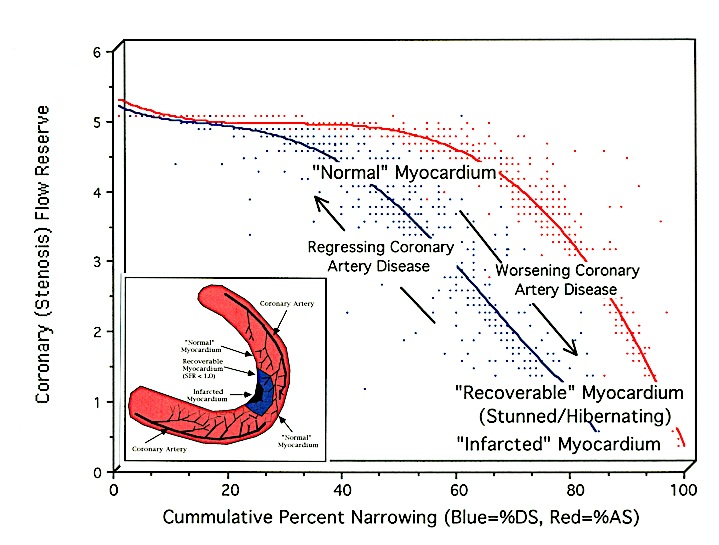 Figure 1: Comparison of Percent Diameter Stenosis with Stenosis Flow Reserve [26].
The relationship between both Percent Diameter Stenosis (% DS) and Percent Area Stenosis (% AS) and coronary (stenosis) flow reserve are different curvilinear functions. Prior studies [8,25] using a dog model incorrectly defined the % DS relationship to SFR in humans as the % AS relationship. This is due to the differences in SFR seen between species (canine vs. human). The correct relationship is shown in blue, while the actual % AS for humans is shown in red. In humans there is no appreciable decrease in SFR until a 15-20 percent reduction in lumen diameter exists. While it is not uncommon for clinicians to visually report Coronary Artery Disease (CAD) with % DS greater than 90%, such lesions actually represent changes in % AS [4,12].
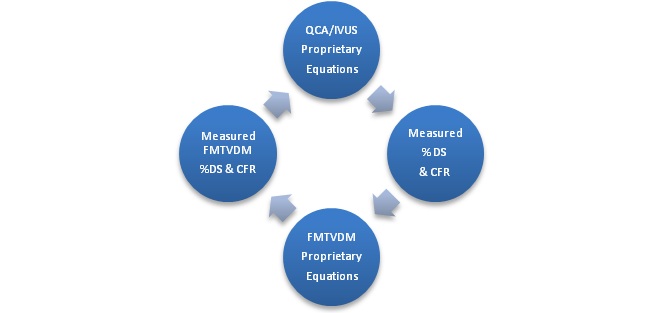
FMTVDM can measure these changes in flow reserve by measuring quantitative changes in isotope redistribution unmasking vulnerable plaques through isotope wash-in [18-24]. FMTVDM proprietary equations using this method provide SFR results obtained using automated QCA as shown in figure 2 [18,26].
ML data exchange and enhancement through proprietary equations marks the evolution of AI.
As shown in table 1 and figure 3, there is a curvilinear relationship (R = 0.98) between the mean % DS and the mean SFR. Table 2 and figure 4 further reveals how SFR decreases as the %DS increases, without any apparent increase in the standard deviation of stenosis flow reserve measurements. Figure 4 also reveals an almost linear relationship between SFR and %DS once the lumen narrowing exceeds 50 %DS, with critical reductions in SFR seen when %DS exceeds 70 percent.
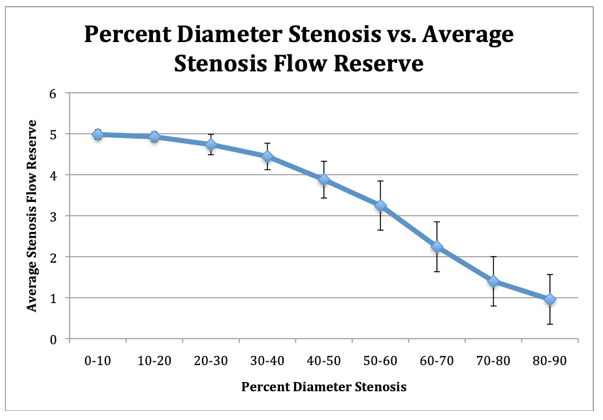 Figure 3: Comparison of average percent diameter stenosis with average stenosis flow reserve.
When the average values of stenosis flow reserve with error bars of one standard deviation is plotted against the average percent diameter stenosis, there is a strong correlation (R = 0.98) between the values obtained.
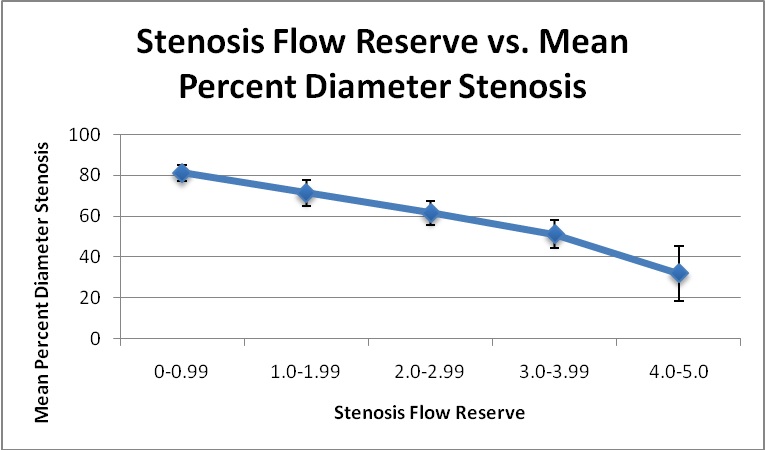 Figure 4: Stenosis flow reserve based upon percent diameter stenosis.
The results of stenosis flow reserve (SFR) and the respective standard deviations are plotted against the percent diameter stenosis (% DS). There is an inverse relationship between SFR and % DS. There is no appreciable change in the range of variance/standard deviation of SFR calculations whether one is looking at a lesion of ten or ninety % DS.
|
Percent Diameter Stenosis |
Average Stenosis Flow Reserve |
Stenosis Flow Reserve (standard deviation) |
Minimum Stenosis Flow Reserve* |
Maximum Stenosis Flow Reserve* |
|
0-10 |
4.982 |
0.114 |
4.868 |
5.096 |
|
20-Oct |
4.925 |
0.114 |
4.811 |
5.039 |
|
20-30 |
4.736 |
0.248 |
4.488 |
4.984 |
|
30-40 |
4.446 |
0.323 |
4.123 |
4.769 |
|
40-50 |
3.879 |
0.449 |
3.43 |
4.328 |
|
50-60 |
3.247 |
0.599 |
2.648 |
3.846 |
|
60-70 |
2.242 |
0.609 |
1.633 |
2.851 |
|
70-80 |
1.399 |
0.603 |
0.796 |
2.002 |
|
80-90 |
0.958 |
0.606 |
0.352 |
1.564 |
|
Stenosis Flow Reserve |
Mean Percent Diameter Stenosis |
Percent Diameter (standard deviation) |
|
0-0.99 |
81.1 |
3.7 |
|
1.0-1.99 |
71.4 |
6.4 |
|
2.0-2.99 |
61.6 |
5.9 |
|
3.0-3.99 |
51.1 |
6.8 |
|
4.0-5.0 |
31.9 |
13.6 |
DISCUSSION
However, this semi-automated approach is still associated with the need for human intervention, calibration and estimations, including determination of the normal proximal region of the artery in question, the location of vessel walls, and determination of the most stenotic region as well as determination of appropriate biplane images when orthogonal views are used.
Previously, phantom images with known concentric diameter reductions have been used to examine the reliability of QCA systems and have demonstrated QCA accuracy to within 0.1 millimeter. There are currently no phantoms available with eccentric stenoses and curvatures such as those seen in human coronaries, and the expense of reproducing human coronary arteries from autopsies after previous coronary arteriograms without intervening changes provides not only an economic problem but possibly an ethical one.
For this reason, the clinical results from these 1040 coronary arteries, which the primary author has previously analyzed provides the data base against which quantitatively conclusions can be drawn with regard to SFR, % DS results and their associated standard deviations. From this, it was possible to provide data, proprietary equations, and a graphic record of the experience to date and its potential use by clinicians. The theoretical and clinical relationship of SFR to % DS as briefly revealed here shows a curvilinear function where no apparent effect upon stenosis flow reserve until there is at least a 35-40 percent reduction in coronary lumen diameter. This plateaus off at approximately 85-90 % DS. No lesions were quantitatively reported between the range of 91-100 % DS, leading one to suspect that stenoses in this range tend to totally occlude or were not detected on arteriography.
These two variables can also be compared as average values obtained over the stenoses studied, with a strong (R = 0.98) linear correlation. This relationship allowed for the development of proprietary equations, which can be used to calculate stenosis flow reserve from percent diameter stenosis, and percent diameter stenosis from stenosis flow reserve, respectively as shown in figure 2.
The development and use of Figure one allows clinicians to estimate the stenosis flow reserve for a given lesion based upon % DS. However, the use of visual estimates of % DS cannot be improved by the simple use of Figure one and likewise, Figure one is only as useful as the accuracy of the method used to determine % DS. Based upon the results obtained by analyzing this SFR data and comparing it with the FMTVDM data, several points can be made. First, a coronary lumen narrowing alone, which has less than a 40 percent reduction in diameter stenosis due to the development of an underlying coronary artery inflammatory plaque [27-32], cannot be appreciably detected using arteriography or QCA analysis. These plaques can be detected using Intravascular Coronary Ultrasound (IVUS) once the clinician knows where to look for them. Such inflammatory plaques are extremely important clinically as they account for the majority of sudden cardiac death seen in individuals with no or few prior anginal symptoms. These plaques are measureable using FMTVDM to unmask the underlying inflammatory plaques and expose their effect upon CFR as detailed elsewhere [1-2,18-24] and provide the necessary information need by the interventional cardiologist.
Second, lesions with a greater than 40 percent reduction in diameter are associated with linearly decreasing SFR. Third, while lesions with a greater than 85 % DS have the widest variability in SFR, they all are associated with a SFR of < 1.0, revealing impaired coronary flow at rest and a further impaired ability to increase coronary blood flow when needed, thus representing significant and potentially life-threatening CAD.
The key to improved diagnostic and therapeutic CAD intervention is contingent upon accuracy. Accuracy is determined by the ability to measure and not qualitatively look for the presence or absence of disease. The human eye and brain is unable to define CAD at the level where coronary artery plaques are impairing coronary artery function. Furthermore, the reliability of qualitative imaging is associated with sensitivity and specificity errors already well established in the medical and lay literature; independent of whether we are talking about coronary arteriography or Myocardial Perfusion Imaging (MPI).
Quantification of coronary arteriography requires QCA and quantification of MPI requires FMTVDM. The development of proprietary equations (FMTVDM) provides the Artificial Intelligence (AI) language for these machines to learn from each other as shown in figure 5. The acquired information from QCA teaches FMTVDM and FMTVDM teaches QCA. The consequential refinement and ML that occurs will further enhance this quantification of CAD both for diagnostic purposes and for modification of treatment based upon measureable treatment outcomes. Systems, which do not directly measure [19-20,22-23,26] cannot provide true AI.
The birth of true AI for diagnosing and treating coronary artery disease.
REFERENCES
- Fleming RM, Fleming MR, Chaudhuri TK (2019) FMTVDM©? provides first patented quantitative method to accurately measure both heart disease and breast cancer on the “Health-Spectrum”. J Cardiovasc Med Cardiol 6: 19-20.
- Fleming RM, Fleming MR (2019) The Importance of Thinking about and Quantifying Diseases like Cancer and Heart Disease on a “Health-Spectrum” Continuum. J Compr Cancer Rep 3:1-3.
- Fleming RM., Kirkeeide RL, Taegtmeyer H, Adyanthaya A, Cassidy DB, et al. (1991) Comparison of technetium-99m teboroxime tomography with automated quantitative coronary arteriography and thallium-201 tomographic imaging. J Am Coll Cardiol 17: 1297-1302.
- Fleming RM., Kirkeeide RL, Smalling RW, Gould KL (1991) Patterns in Visual Interpretation of Coronary Arteriograms as Detected by Quantitative Coronary Arteriography. J Am Coll Cardiol 18: 945-951.
- Fleming RM, Gibbs HR, Swafford J (1992) Using Quantitative Coronary Arteriography to Redefine SPECT Sensitivity and Specificity. Am J Physiol. Imag 7: 59-65.
- Fleming RM, Harrington GM (1994) Quantitative coronary arteriography and its assessment of atherosclerosis. Part II. Calculating stenosis flow reserve from percent diameter stenosis. Angiology 45: 835-840.
- Kirkeeide RL, Gould KL, Parsel L (1986) Assessment of coronary stenoses by myocardial perfusion imaging during pharmacologic coronary vasodilation. VII. Validation of coronary flow reserve as a single integrated functional measure of stenosis severity reflecting all its geometric dimensions. J Am Coll Cardiol 7: 103-113.
- Demer LL, Gould KL, Goldstein RA, Kirkeeide RL, Mullani NA, et al. (1989) Assessment of Coronary Artery Disease Severity by Positron Emission Tomography Comparison With Quantitative Arteriography in 193 Patients. Circulation 79: 825-835.
- Büchi M, Hess OM, Kirkeeide RL, Suter T, Muser M, et al. (1990) Validation of a New Automatic System for Biplane Quantitative Coronary Arteriography. Int J Card Imaging 5: 93-103.
- Brown BG, Bolson E, Frimer M, Dodge HT (1977) Quantitative coronary arteriography: estimation of dimensions, hemodynamic resistance, and atheroma mass of coronary artery lesions using the arteriogram and digital computation. Circulation 55: 329-337.
- Klocke FJ (1987) Measurements of coronary flow reserve: defining pathophysiology versus making decisions about patient care. Circulation 76: 1183-1189.
- Fleming RM, Fleming DM, Gaede R (1996) Training physicians and health care providers to accurately read coronary arteriograms. A training program. Angiology 47: 349-359.
- Fleming RM (2001) Coronary Artery Disease is More than Just Coronary Lumen Disease. Amer J Card 88: 599-600.
- Marcus ML, Skorton DJ, Johnson MR, Collins SM, Harrison DG, et al. (1988) Visual estimates of percent diameter coronary stenosis: "a battered gold standard". J Am Coll Cardiol 11: 882-885.
- Gould KL (1988) Percent coronary stenosis: battered gold standard, pernicious relic or clinical practicality? J Am Coll Cardiol 11: 886-888.
- Vogel RA (1988) Assessing Stenosis Significance by Coronary Arteriography: are the best variables good enough? J Am Coll Cardiol 12: 692-693.
- Fleming RM (2000) Shortcomings of coronary angiography. Cleve Clin J Med 67: 450-451.
- Fleming RM, Fleming MR, Chaudhuri T, McKusick A, Dooley WC et al. (2018) Both Percent Diameter Stenosis (%DS) and Coronary Flow Reserve (CFR) can be Derived Directly from Myocardial Perfusion Imaging (MPI) using FMTVDM©? and Measurement of Isotope Redistribution. J Nucl Med Radiat Ther 9: 353.
- Fleming RM, Fleming MR, Dooley WC, Sheikh A, McKusick A, et al. (2018) FMTVDM - FHRWW & BEST ©? The First True “Quantitative” Nuclear Imaging Protocols with Proprietary Equations following The Fleming Method (TFM) for Nuclear Scintillation Equipment Quantitative Standardization. Biomed J Sci & Tech Res 4:1-4.
- Fleming RM, Fleming MR, McKusick A, Chaudhuri T (2018) FMTVDM-TFM©?: True quantification requires standardization of the tool being used to measure, with a known, unchanging standard to produce accurate, consistent and reproducible quantified measurements. J Nucl Cardiol 29923099.
- Fleming RM, Fleming MR, Harrington G, McKusick A, Chaudhuri T (2018) USVAH Study Demonstrates Statistically Significant Improvement in Diagnosis and Care of U.S Veterans Using FMTVDM - FHRWW©? “Quantitative” Nuclear Imaging. The Era of Truly Quantitative Stress- First, Stress-Only Imaging has begun! J Nucl Med Radiat Ther 9: 6.
- Fleming RM, Fleming MR, McKusick A, Chaudhuri TK (2018) Semiquantification Limitations: FMTVDM©? Demonstrates Quantified Tumor Response to Treatment with Both Regional Blood Flow and Metabolic Changes. J Nucl Med 59: 1643-1644.
- Fleming RM, Fleming MR, McKusick A, Chaudhuri TK (2018) FMTVDM©?*** Nuclear Imaging Artificial (AI) Intelligence but First We Need to Clarify the Use Of (1) Stress, (2) Rest, (3) Redistribution and (4) Quantification. Biomed J Sci & Tech Res 7:1-4.
- Fleming RM, Fleming MR, McKusick A, Chaudhuri T (2018) Multi Center Clinical Trial Confirms FMTVDM?? MPI in Seven Modern Clinical Laboratories in the USA and Asia. Artificial Intelligence (AI) with True Quantification. J Nucl Med Radiat Ther 9: 372.
- Ornish D, Brown SE, Scherwitz LW, Billings JH, Armstrong WT, et al. (1990) Can Lifestyle Changes Reverse Coronary Heart Disease? Lancet 336: 129-133.
- Fleming RM, Fleming MR, McKusick A, Chaudhuri TK, Dooley WC, et al. (2018) FMTVDM©? Stress-First/Stress-Only Imaging is here! But First We Need to Clarify the Use of What (1) Stress, (2) Rest, (3) Redistribution and (4) Quantification, Really Mean. J Nucl Med Radiat Ther 9: 5.
- Inflammation and Heart Disease; Fleming Unified Theory of Vascular Disease.1-655833842. Started 9-1-2011. Effective 9-16-2011, TX 7-451-244.
- Stenosis Flow Reserve (SFR), Coronary Flow Reserve (CFR); Quadratic Coronary Flow Reserve (QCFR). 1-655833951. Started 9-1-2011. Effective 9-16-2011, TX 7-451-241.
- Fleming RM (2000) Atherosclerosis: Understanding the relationship between coronary artery disease and stenosis flow reserve. Textbook of Angiology pg no: 381-387.
- Fleming RM (2000) The Pathogenesis of Vascular Disease. Textbook of Angiology. John Pg no: 787-798.
- Fleming RM (2003) Angina and coronary Ischemia are the result of coronary regional Blood Flow Differences. J Amer Coll Angiol 1: 127-142.
- Fleming RM (2000) The Fleming Unified Theory of Vascular Disease: a link between atherosclerosis, inflammation, and bacterially aggravated atherosclerosis (BAA). Angiology 51: 87-89.
Citation: Fleming RM, Fleming MR, Chaudhuri TK, McKusick A (2019) Machine Learning through FMTVDM Proprietary QCA Equations. J Angiol Vasc Surg 4: 026.
Copyright: © 2019 Richard M Fleming, et al. This is an open-access article distributed under the terms of the Creative Commons Attribution License, which permits unrestricted use, distribution, and reproduction in any medium, provided the original author and source are credited.