Mathematical Analysis on The Epidemic of Coronavirus Disease 2019
*Corresponding Author(s):
Bin ZhaoSchool Of Science, Hubei University Of Technology, Wuhan, Hubei, China
Tel:+ 86 130 2851 7572,
Email:zhaobin835@nwsuaf.edu.cn
Abstract
Background: The novel coronavirus (COVID-19) suddenly appeared in Wuhan, Hubei since December 2019, and quickly swept across China, then the whole world. Today, after more than 100 days of fighting against the virus, China's epidemic has been effectively controlled, but when we looking at the entire world, the novel coronavirus has rampaged globally, especially in the United States and many European countries. This paper mainly studies the impact of COVID-19 outbreaks at Hubei Province and the United States, fits the given data and predicts future trends.
Methods: Based on the theoretical basis of traditional differential equations and SIR infectious disease model, and combined with the actual situation to improve the model. Hubei Province is modelled in different time periods, and the effects of birth rate and natural mortality on the model are analysed. Since the birth rate and natural mortality in the United States in recent years cannot be found, the epidemic situation in the United States can only be analysed based on the absence of births and natural deaths. Finally, we used Netlogo to establish a closed environment (Small World), and combined with known data to conduct simulation experiments on COVID-19 infection.
Findings: Through the analysis of given data through the SIR model, it is found that before the Chinese government has taken comprehensive measures to cure patients (before 10 February), the number of patients in Hubei Province will reach the peak at the end of February, and will gradually decline thereafter, and on 20 March, the epidemic will be effectively controlled in the future, which coincides with the fact that Wuhan closed the last mobile cabin hospital on 10 March. On the other hand, after the Chinese government tried its best to cure the patients (after 21 February), the number of patients continued to decline over time and will reach 0 in mid-April, which is also consistent with the actual data. According to the factors of birth and natural death, the sensitivity analysis of the above model found that when the epidemic situation is at its peak, it has little effect on the curve, but when the epidemic situation gradually flattens, it still has a certain effect on the trend of the curve. Finally, looking at the situation in the United States, due to the high transmission rate, the number of patients in the United States continues to rise and is expected to reach its maximum in mid-June. We also use Netlogo to simulate the environment in which the virus spread, and find that the general trend of the curves is also consistent with the actual curves.
Interpretation: The Chinese government has taken various measures to deal with the novel coronavirus pneumonia, including the establishment of two temporary hospitals and dozens of sheltered hospitals, the temporary transformation of university dormitories into isolation rooms, the closure of Wuhan, the ban on the movement of people and so on. These measures have helped to reduce the spread of the virus and greatly increased the patient's cure rate. But the US government’s actions are not as effective as China’s, not only because the government’s actions are inappropriate and untimely, and the people’s opposition to isolation has not subsided. As a result, the virus has spread widely in the United States. More than one million people have been infected with the virus, and tens of thousands of people have died from COVID-19.
Keywords
COVID-19; Curve fitting; Netlogo; Parameter optimization; SIR model
INTRODUCTION
With the outbreak and spread of the COVID-19 [1], the Chinese government decided to suspend work and schools, and closed down the entire Hubei Province [2]. With the active cooperation of the central leadership and people [3-5], we take strong measures to prevent and control the epidemic [6], although to our country's economic development and people's lives have brought a great impact. But in the current situation, COVID-19 [7] has been effectively controlled in China.
Although the epidemic of China has been effectively controlled, COVID-19 is rampaging around the world by now, with the United States affected the worst. Therefore, the current study of the epidemic situation will not only have a significant influence on the future development of our society, but also through theoretical thinking, accumulate more important experiences and lessons, and provide a good reference value for the future outbreak of the virus, creating conditions for the prediction and control of the spread of infectious diseases.
At the same time, the analysis of foreign epidemic situation, confirm the truth of the Human Community of Destiny. Only to understand the epidemic situation abroad, can better prevent and control foreign imports and avoid the domestic re-outbreak of the COVID-19 infection.
In fact, there are many imminent questions about the spread of COVID-19. How to analyse the development trend of epidemic situation in China and the United States? When will the inflection point of the infection rate appear in the United States? Can existing interventions effectively control the COVID-19? What kinds of mathematical models are available to help us answer these questions?
METHODS
Data
The data source of Hubei Province is based on the authoritative data released by Health Commission of Hubei Province on its official platform starting from 20 January, 2020. The Hubei Province’s data collected in this paper is from 23 January, 2020 to 28 April, 2020, including cumulatively diagnosed cases, cumulative deaths, and cumulative cures [8]. And we got the natural mortality, birth rate and total population of Hubei Province in 2019 from the official [9]. The data sources in the United States are limited. Only the domestic data platforms can be used to know the cumulative cases of the diagnosed, cumulative deaths, and cumulative cures (the corresponding time period is 23 February, 2020 to 28 April, 2020), and the total population of the United States in 2019, whereas we have no way to know the birth rate and natural mortality in the United States in recent years.
The model
Based on all the data we have, since COVID-19 is a pandemic, we establish a model of Epidemic [10].
However, due to the limited data we have collected, in particular the number of asymptomatic infections that were not officially announced until 31 March, we can only model based on known data, including cumulatively diagnosed cases, cumulative deaths, and cumulative cures. Therefore, we choose the SIR model as the basic mathematical model, and combine with some other factors to modify the differential equation system to make it more realistic [11]. By analysing the realistic events happened in Wuhan after the outbreak of COVID-19, we decide to divide it into 3 time periods, including before control period (23 January, 2020 to 10 February, 2020), transition period (10 February, 2020 to 23 February, 2020) and after control period (23 February, 2020 to 28 April, 2020). The models we establish are before and after control period.
The same is true in the United States, where the SIR model can only be built with limited data. However, we do not decide to divide time periods like what we do to analyse the data of Hubei Province, because America is not able to control the situation by now, there is no point to do that.
At last, by the data we analyse in Hubei Province and America models, we create a closed community to simulate virus spread through Netlogo.
SIR-based method for estimation
As shown in the following table 1, based on the data we know about COVID-19, plus the official total population of Hubei Province in 2019. We divide the population of Hubei Province into three categories, of which those who are not infected with COVID-19 are classified as S(t), the daily number of people who are diagnosed currently is classified as I(t), and the cumulative cures and deaths of the novel coronavirus pneumonia is classified as R(t) (assuming the people who are cured would not infect COVID-19 again).
|
Classes |
Explanations for different classes |
|
S(t) |
People who may be infected by the COVID-19 |
|
I(t) |
People who are infected with the virus currently |
|
R(t) |
People who are cured after infection and would not be re-infected by COVID-19 and people who died because of the COVID-19 |
Table 1: Classification and definition of population under transmission of COVID-19.
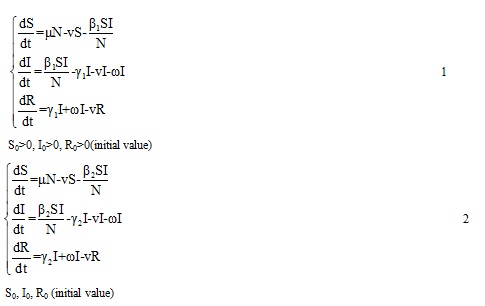
As the (Figures 1& 2) show below, when we model Hubei Province, we decide to identify two parameters (spread rate β and cure rate γ) in different time period by subscripting. Then we analyse the given data and conclude a moderate rate ω that died owing to COVID-19. We also intend to conduct a sensitivity analysis of the effects of birth and natural death on the curve. So, when we design the equations, one group does not consider the effects of birth and natural death, while the other group considers it. The birth population is based on the total number of populations, while the natural death toll is based on the S(t) value. And when people have cured pneumonia, assume they won't be infected with the virus again.
On the other hand, as it is discussed earlier in the paper, we have not collected birth and natural mortality in the United States, so when modelling the United States, we can only assume that no one is born and died naturally. Because the situation in U.S. is not optimistic, we decide that we model it in just one period, and the rest of which is the same as Hubei Province.
The symbols we use to establish the model are followed in Table 2.
|
Classes |
Explanations for different symbols |
|
N |
Population in total |
|
μ |
Birth rate |
|
ν |
Natural mortality |
|
ω |
The novel coronavirus pneumonia mortality |
|
β |
Spread rate |
|
β1 |
Spread rate in before control period |
|
β2 |
Spread rate in after control period |
|
γ |
Cure rate |
|
γ1 |
Cure rate in before control period |
|
γ2 |
Cure rate in after control period |
Table 2: Mathematical symbols used in SIR model.

Figure 1: SIR model diagram in Hubei Province (consider births and natural deaths).
 Figure 2: SIR model diagram in Hubei Province and U.S. (not consider births and natural deaths) Through the above two figures, we can get the corresponding differential equation expression. The amount of change of the infected person during this period of time (t+Δt) .
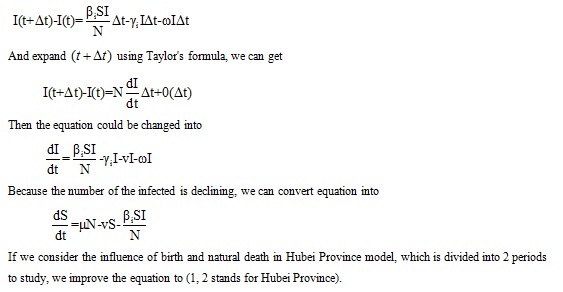
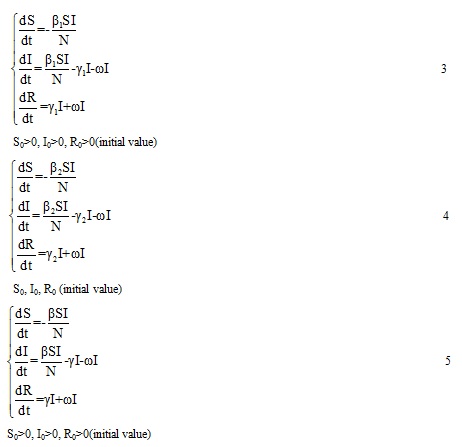
If we do not consider the influence of birth and natural death, the equations would be changed to (3,4 stands for Hubei Province, 5 stands for America).
 SIR-based simulation for estimation
By using a simulation software called Netlogo, we create a SIR model that simulates virus transmission using the built-in simulation repository. The parameters that are set, including total number, virus transmission rate, cure rate, initial number of cases, etc. We set these parameters based on the actual data, the specific parameters are set as follows 6.
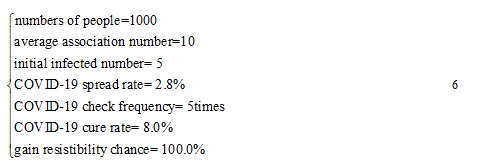 This simulation takes place in a closed environment (Small World) and assumes that no one is born and died naturally. But unlike the SIR model above, R(t) at this time represents the number of people who are cured, which is not included the number of deaths due to COVID-19.
Simulation
This paper uses the known data, takes days as the basic time unit, and determines the parameters (spread rate β and cure rate γ) values. We preset the initial value of the parameter, its upper and lower limit. Optimize the parameters by calling the MATLAB's built-in fmincon function, and call ode45 function to find the numerical solution of the differential equations, thus, fitting the curves [12].
The values of the remaining coefficients (e.g. birth rate and natural mortality) are determined based on known data and the degree to which the curves fit. According to known data from Hubei Province, the number of deaths due to COVID-19 accounts for about 4% of the total number of cases, while the birth rate is about 0.1% and the natural mortality is about 0.07%. For convenience, we assume that the natural mortality is equal to the birth rate, both of which are valued at 0.1%. In the United States, the mortality due to COVID-19 is still 4%, as we thought that the mortality is only related to the human body, which has no relation with medicine or others. On the other hand, since the birth rate and natural mortality in the United States cannot be checked; we assume that the outbreak in the United States occurs without anyone being born or dying.
The specific parameters and coefficients settings are shown below. (7 stands for considering births and natural deaths, 8 stands for not considering births and natural deaths). 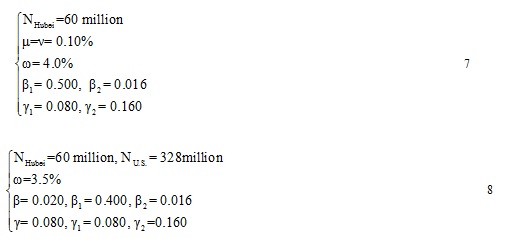
RESULTS
The result of Hubei Province (consider birth rate and natural mortality)
The final fitting results are shown in the (Figures 3 & 4) below. The figure 3 shows the first period in Hubei Province, and the other shows the second period. The graphs contain curves composed of actual data, and curves formed by the calculated data. The deduced curves not only fit the curve composed of actual data, but also predict the future.
 Figure 3: 2020.1.23-2020.2.10 Data fitting result (consider birth rate and natural mortality).
 Figure 4: 2020.2.21-2020.4.28 Data fitting result (consider birth rate and natural mortality).
As the figures 3 & 4 above show, the effect of Model 1 is not fitting well-the fitting curve of the Susceptible has a large deviation from the actual during the period of 21 February to 28 April (the degree of deviation increases with time). Therefore, we consider to simplify the above model, which is without considering the impact of birth rate and natural mortality, then the model 2 is established.
The result of Hubei Province (not consider birth rate and natural mortality)
The final fitting results are shown in the Figure 5, 6 below. The meanings of the curves are the same as in figures 3 & 4.
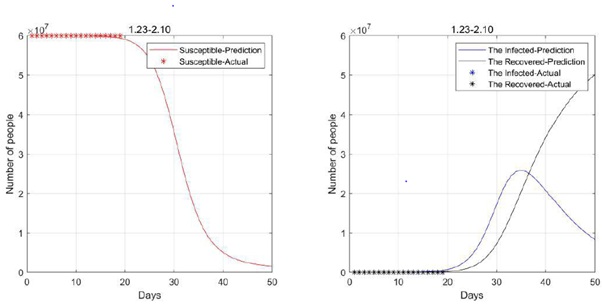 Figure 5: 2020.1.23-2020.2.10 Data fitting result (not consider birth rate and natural mortality).
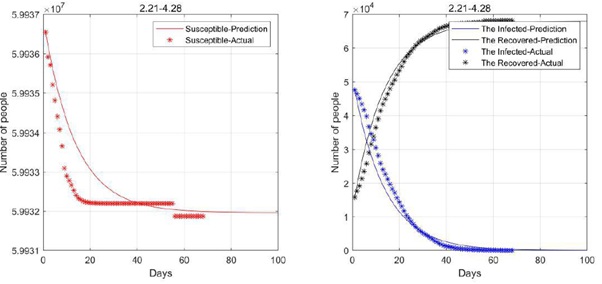 Figure 6: 2020.2.21-2020.4.28 Data fitting result (not consider birth rate and natural mortality).
As can be seen from the above figures, the simplified model fitting effect is much better. And according to the analysis of the figure, the turning point will be reached in about 35 days from 23 January, and the infected will gradually decline thereafter. According to the predicted curves, around 20 March, under the effective control of the country, there will be no major changes in the future, which is quite consistent with the fact that the last mobile cabin hospital of Wuhan was closed on 10 March and the epidemic has been effectively controlled [13].
The result of the United States (not consider birth rate and natural mortality)
The final fitting result of the United States is shown in the figure 7 below. The meanings of the curves are the same as the Figures above.
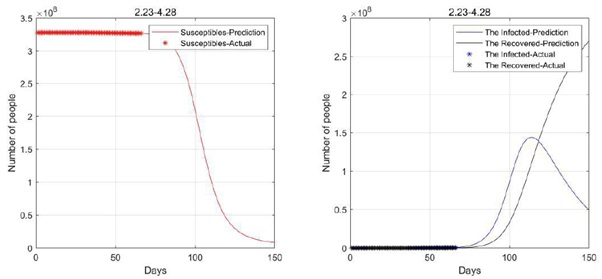 Figure 7: 2020.2.23-2020.4.28 Data fitting result (not consider birth rate and natural mortality).
It can be seen from the figure 7 that the turning point of the U.S. epidemic will not appear until mid-June. This is because the United States initially paid little attention to this epidemic, and the government and citizens did not even take corresponding preventive and control measures. If the U.S. government can strengthen control like the Chinese government, then the inflection point of the U.S. epidemic will appear earlier.
The result of SIR-based simulation estimates (By Netlogo):
The final simulation fitting result is shown in the figure 8 below. The meanings of the curves are the same as the figures above.
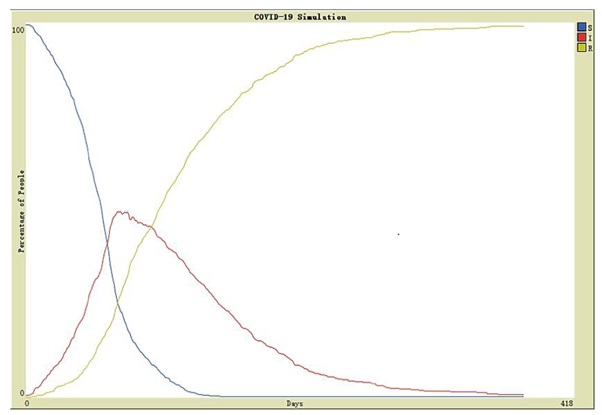 Figure 8: Simulation fitting result from Netlogo.
We used the parameters listed in Methods section for simulation. It is found that the simulation curves are consistent with the trend of the curves that we use the calculated values, and also coincide with the trend of the actual curves. As shown in the figure 8 that according to the given parameters, this virus will disappear after more than 1 year. So, we can conclude that if we do not give comprehensive control to the spread of COVID-19, the realistic situation will be worse than the simulation.
DISCUSSION
There is no doubt that the propagation of COVID-19 in the population will be affected by the intricacies of many factors. In the establishment of the epidemic model in Hubei Province, we divide the time of the use of the mobile cabin hospitals into two periods: before and after control. And we provide the data of spread rate and cure rate for comparison, based on the actual situation of the novel coronavirus during transmission. At the beginning of modelling, the birth rate and natural mortality are taken into account, and there are some deviations with the actual data. Therefore, a simpler model is selected later. The birth rate and natural mortality are not taken into consideration, and the predicted results are more consistent with the actual data. Thus, it is concluded that the impact of births and natural deaths on the curves is more and more obvious with time.
For all models, although parameters such as spread rate and cure rate are difficult to determine, we estimate them roughly based on the early data, and then realize the parameter optimization with the fmincon function in MATLAB, and obtain the most realistic predicted values. At the same time, when analysing I(t), the case of death due to illness is taken into account, and the people who died of illness is attributed to R(t), which is more in line with the actual situation and can reduce the setting of unknown coefficients.
Our model of infectious disease which is established by ordinary differential equations has a wide range of operating prospect, except for infectious disease itself (e.g. COVID-19 and SARS) of the prediction, prevention and control, there are a lot of social behaviours and incidents in our life follow the rule similar to the model of the spread of infectious disease. The infectious disease model can be widely used in the diffusion of innovation, the network public opinion spread, the spread of financial risk, and other areas of the social science research [14,15]. The diffusion process of management accounting matters, which is shown in the table 3 and figure 9 below, clearly uses the familiar infectious disease model for analysis.
|
Classes |
Corresponding infectious disease model |
Explanations for different classes |
|
Management Accounting Practice |
Source of infection |
Enterprises introduce new management accounting practices |
|
Neutral(s) |
People who are possible to be infected by COVID-19 but not yet |
The learning cost, information collection cost, business adjustment cost and income balance caused by the new management accounting practice, and the net income will affect the employee group with less impact |
|
Supporter(I) |
People who are infected by the virus currently |
The group of employees with increased tangible and intangible benefits |
|
Opponent(R) |
People who are cured after infection and would not be re-infected by COVID-19 and people who died because of the COVID-19 |
The group of employees whose cognitive costs and information collection costs become larger, their benefits become smaller, and their overall net income are negative |
Table 3: Management accounting practice diffusion system and infectious disease model.
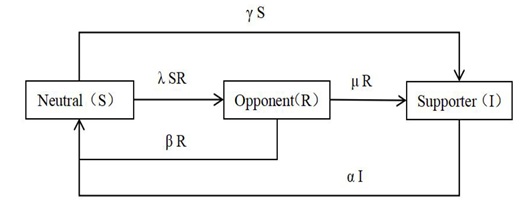
Figure 9: Process of management accounting matters.
LIMITATIONS
For the analysis of the epidemic situation in Hubei Province, only divide the time line into two periods, which are before and after control, is not enough at all. The parameters will definitely change with time in the actual situation, whereas it is hard to determine the equations of those parameters. Besides, because the data of asymptomatic infected persons are released late, we cannot establish SEIR-based model for fitting and prediction.
When fitting the model of Hubei Province, it is obvious that there is a sudden deviation between the actual Susceptible number and the estimated value. This is because the data released on the day by Health Commission of Hubei Province on its official platform has been revised [16], resulting in a forecast that does not match the actual situation.
In the analysis of the U.S. epidemic, because of insufficient data, the impact of the birth rate and mortality on the U.S. epidemic is not considered.
In addition, none of the established models divide infected people into isolated and un-isolated individuals, or whether they receive effective treatment after being isolated. This is because in the early stage of the outbreak, countries are not fully prepared for epidemic prevention, thus leading to the future to the failure of some patients to receive timely treatment.
CONFLICT OF INTEREST
We have no conflict of interests to disclose and the manuscript has been read and approved by all named authors.
ACKNOWLEDGEMENT
This work was supported by the Philosophical and Social Sciences Research Project of Hubei Education Department (19Y049), and the Staring Research Foundation for the Ph.D. of Hubei University of Technology (BSQD2019054), Hubei Province, China.
REFERENCES
- Jiang Q (2019) Mathematical models. Higher education press.
- https://baike.so.com/doc/7026173-7249077.html.
- http://wjw.Hubei.gov.cn/bmdt/ztzl/fkxxgzbdgrfyyq/fkdt/202002/t20200201_2017239.shtml.
- http://wjw.hubei.gov.cn/bmdt/ztzl/fkxxgzbdgrfyyq/fkdt/202002/t20200220_2142219.shtml.
- http://wjw.hubei.gov.cn/bmdt/ztzl/fkxxgzbdgrfyyq/fkdt/202002/t20200208_2021721.shtml.
- https://k.sina.com.cn/article_5787187353_158f17899019010nld.html?from=news&subch=onews.
- http://www.nhc.gov.cn/xcs/ptpxw/202001/8005b53f000f4f1185ec0175d6543fbf.shtml.
- http://wjw.Hubei.gov.cn/bmdt/ztzl/fkxxgzbdgrfyyq/xxfb/.
- http://calendar.hexun.com/area/dqzb_420000_D0070000.shtml.
- Ming W, Huang J, Zhang CJP (2020) Breaking down of healthcare system: Mathematical modelling for controlling the novel coronavirus (COVID-19) outbreak in Wuhan, China, J. bioRxiv 12: 627-630.
- Kui SiS (2015) Mathematical modelling algorithm and application. National defense industry press.
- Wei Pan (2019) Simulation modelling and MATLAB practical tutorial. Tsinghua University press.
- http://wjw.hubei.gov.cn/bmdt/mtjj/mtgz/202003/t20200312_2179786.shtml.
- http://xueshu.baidu.com/usercenter/paper/show?paperid=1p7b06u0tx330vx0pt4u0e80436399.
- Zhao G, Zhong Y (2007) Management accounting practice. Tsinghua University press.
- http://wjw.hubei.gov.cn/bmdt/ztzl/fkxxgzbdgrfyyq/fkdt/202004/t20200419_2234552.shtml.
Citation: Wang Z, Yu Z, Tian C, Jiang X, Cao J, et al. (2020) Mathematical analysis on the epidemic of Coronavirus Disease 2019. J Pharmacol Pharmaceut Pharmacovig 4: 014.
Copyright: © 2020 Bin Zhao, et al. This is an open-access article distributed under the terms of the Creative Commons Attribution License, which permits unrestricted use, distribution, and reproduction in any medium, provided the original author and source are credited.