Mathematical Modeling of Blood Flow to Evaluate the Hemodynamic Significance of Peripheral Vascular Lesions
*Corresponding Author(s):
David ShavelleMemorial Care Heart And Vascular Institute, Long Beach Medical Center, Long Beach, CA, United States
Tel:+1 5629333317,
Email:dshavelle@memorialcare.org
Abstract
Background: Evaluating the severity of peripheral artery lesions is challenging. Image-based blood flow modeling from peripheral Computed Tomographic Angiography (pCTA) may provide a non-invasive method to determine the hemodynamic significance of lesions. This pilot study evaluates the performance of pCTA-based blood flow modeling in diagnosing functionally significant peripheral lesions in comparison with Digital Subtraction Angiography (DSA).
Methods: Ten patients undergoing DSA and pCTA were included. The peripheral arteries were divided into 8 segments per extremity and stenosis severity was graded by visual estimation from DSA. Each segment was graded 0 to IV (normal, mildly-stenotic, moderately-stenotic, severely-stenotic, occluded) or non-evaluable. Independent from DSA review, a Resting Pressure Drop (RPD) and an Exercise Pressure Drop (ExPD) for each segment was calculated from pCTA-based blood flow modeling. A functionally significant (FS) lesion was defined as grade III or IV by DSA and RPD > 5 mmHg from pCTA-based modeling. Analysis was repeated with an ExPD > 20 mmHg. Sensitivity, specificity and accuracy were calculated for RPD > 5 mmHg and ExPD > 20 mmHg using DSA as the standard.
Results: Mean age was 52±16 years, 4 patients were male, 8 patients presented with critical limb ischemia, mean ankle brachial index was 0.60±0.29, and 66 arterial segments were available for both assessment methods. Twenty-two segments had FS lesions by DSA. Using an RPD > 5 mmHg, sensitivity was 80%, specificity was 85% and accuracy was 79%. Using an ExPD > 20 mmHg, sensitivity was 84%, specificity was 89% and accuracy was 88%.
Conclusion: Use of a resting pressure drop > 5 mmHg and an exercise pressure drop > 20 mmHg, measured by blood flow modeling from CT angiography, can accurately identify functionally significant stenosis in patients with peripheral vascular disease. This information motivates the need for a larger-scale prospective imaging trial to further validate this novel non-invasive approach.
Introduction
The prevalence of Peripheral Vascular Disease (PVD) continues to increase, is a major cause of morbidity and mortality and poses a significant financial burden on health care systems [1-3]. Treatment options are based upon the presence and severity of symptoms, evidence of rest pain and/or non-healing ulcers or gangrene and clinical tests to evaluate disease severity [4]. Revascularization, either with surgical bypass or Peripheral Vascular Intervention (PVI), reduces symptoms in those with intermittent claudication and improves wound healing in those with critical limb ischemia if applied to flow limiting lesions [5,6]. Evaluating the severity of lesions in peripheral arteries can be challenging due to lesion eccentricity, adjacent vessel calcification and imaging artifacts [7]. Conventional imaging techniques include arterial duplex ultrasound, Computed Tomographic Angiography (CTA), and Digital Subtraction Angiography (DSA). These methods are useful for anatomic assessment but cannot determine the functional significance of lesions. Invasive measurement of trans-lesion pressure drop can provide functional hemodynamic information, but it is under-utilized due to the risk, complexity, and cost [7]. Therefore, a non-invasive method for evaluation of the hemodynamic significance of lesions can potentially improve diagnosis and treatment planning in patients with PVD. Image-based computational modeling of blood flow has shown to be a powerful tool to extract relevant hemodynamic information from non-invasive medical image data such as CTA. For example, the FFRCT method has recently emerged as the de facto standard to non-invasively compute coronary Fractional Flow Reserve (FFR) and has demonstrated high diagnostic performance against invasive FFR measurement for identification of patients with coronary lesions causing ischemia [8-10].
In this pilot study, we evaluate the sensitivity, specificity and accuracy of a non-invasive method based on image-based Computational Fluid Dynamic (CFD) simulation, integrating anatomical, physiological and hemodynamic information, as a novel tool to determine if peripheral arteries lesions are hemodynamically significant and to estimate the number of patients needed for a properly sized validation study. The diagnostic performance of this method is evaluated against visual assessment of invasive DSA imaging.
Methods
From January 2019 to February 2020, 212 patients undergoing lower extremity DSA for clinical indications at Los Angeles County USC Medical Center were identified from the Cardiac Catheterization Laboratory database. All patients had critical limb ischemia or intermittent claudication and were referred for peripheral CTA and DSA as part of their routine clinical care. Peripheral CTA was done prior to elective DSA in all patients. Only patients having peripheral CTA within 20 days of the DSA were included, yielding 10 patients. This retrospective study was approved by waiver of consent by the Institutional Review Board at USC. Independent research personnel blinded to the objectives of the study obtained all the pre-specified demographics and variables. Variables were entered into a dedicated study database for analysis.
For both DSA and peripheral CTA data sets, the peripheral arteries were divided into 8 segments per extremity (common iliac, external iliac, common femoral, superficial femoral, popliteal, anterior tibial, posterior tibial and peroneal arteries). For DSA, stenosis severity was graded by visual estimation as normal (grade 0), mildly stenotic (grade I), moderately stenotic (grade II), severely stenotic (grade III) or occluded (grade IV). If a segment could not be appropriately visualized, it was not analyzed for stenosis severity and was classified as nonevaluable. An investigator (MM) blinded to the results of DSA calculated a Resting Pressure Drop (RPD) and Exercise Pressure Drop (ExPD) for each segment from image-based blood flow modeling described below.
Figure 1 shows the standard steps for image-based modeling of blood flow in a representative patient. SimVascular was used to construct an image-based computer model of the peripheral arteries by creating paths along each vascular segment and segmenting the lumen along each path (Figure 1, panel 2) resulting in 3D computer model (Figure 1, panel 3) [11]. Steady state blood flow and pressure were modeled according to the reduced order modeling procedure described in [12], which considers various sources of pressure losses in vascular domains including turbulence in stenotic lesions. This procedure required specification of a constant flow rate at the model inlet and resistance boundary conditions at the model outlets. The inflow rate was estimated as a fraction of each patient’s cardiac output (Qin = ∝ × cardiac output, ∝<1). The cardiac output was approximated form a recent study [13]: cardiac output = 2.4 × body surface area. The value of ∝ is defined based on in vivo flow measurements. Namely, it was assumed that roughly 2/3 of cardiac output reaches the supraceliac aorta [14], from which approximately 30% goes to the infrarenal aorta [15], resulting in an ∝ ≈ 0.2 . Resistance values were set so that computed mean blood pressure at the inlet matched clinical target values.
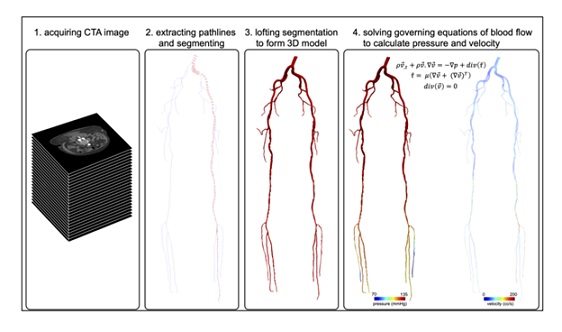 Figure 1: Image-based modeling procedure. A vascular model is constructed by segmenting the peripheral arteries from a computed tomographic angiography image volume. Computational fluid dynamics are used to compute flow and pressure throughout the model.
The degree to which a lesion is flow limiting depends on the flow rate itself; i.e., pressure drop is a function of not only lumen reduction but also flow rate. Generally, peripheral flow is maximal during exercise, therefore we aimed to estimate hemodynamic significance based on a simulated exercise condition in addition to a nominal resting condition. For this purpose, we assumed cardiac output increased due to change in heart rate and stroke volume (i.e., cardiac output = stroke volume × heart rate). Exercise heart rate was approximated by HR ex = 0.85 (220 - age), and the left ventricular stroke volume index (ml/m2 ) changed based on age according to Ref. [16]. The increase in diastolic and systolic pressure due to exercise was approximated based on age and gender for each patient according to Ref. [17].
The computed pressure fields enabled assessment of pressure reduction through each artery or arterial segment. In order to isolate the effect of disease, we differentiated how much pressure reduction occurred due to disease versus ordinary pressure reduction occurring in the absence of disease. This was accomplished by first constructing a 3D computer model of the arteries from the image data. This model was considered the “source model”. A corresponding “benchmark model” was created by replacing stenotic (diseased) segments with idealized segments. Blood flow and pressure were simulated in the benchmark model using the methods described above to compute reference pressure drops. An “assay model” was then generated by replacing an idealized artery (or arteries) of interest in the benchmark model with the actual stenotic geometry of the artery (or arteries) from the source model, and then recomputing pressure drops. Reference pressure drops calculated from the benchmark model were differenced from the pressure drops computed from the assay model. This was performed for both rest and exercise conditions. A cutoff value for the deviation in RPD and ExPD between the benchmark and assay models was used to classify the functional significance of a diseased artery (or arteries). An in-house Python framework was developed to automate the whole computational procedure described above. The results of this procedure are presented in Figure 2 for the representative patient-specific model shown in Figure 1.
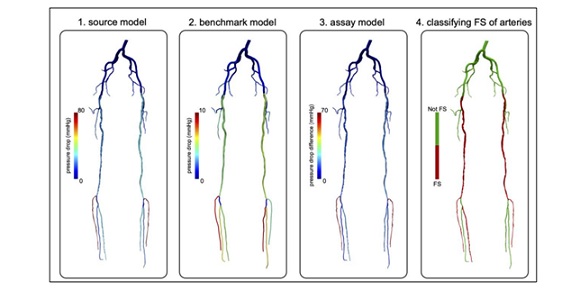 Figure 2: Representative modeling results. Pressure drops are computed in a source model representing the in-vivo conditions (left). Pressure drops are computed in benchmark model in which all stenotic segments are virtually corrected (middle left). Pressure drops computed in an assay model (middle right), which re-introduces disease segment(s) of interest to the benchmark model. By comparing the pressure drops between the assay model and benchmark model, the functional significance of the diseased segment(s) of interest can be evaluated.
A functionally significant (FS) lesion was defined as grade III or IV by DSA. From peripheral image-based blood flow modeling, a FS lesion was defined as an RPD > 5 mmHg. Analysis were repeated defining a FS lesion as an ExPD > 20 mmHg. Categorical variables are standard±presented as number and percentage. Continuous variables are presented as mean deviation. Sensitivity, specificity and accuracy were determined using an RPD > 5 mmHg and an ExPD > 20 mmHg assuming visual classification by DSA as the standard.
Results
Ten patients with symptomatic PVD were evaluated with both peripheral CTA and DSA (Table 1). Mean age was 52 ± 16 years, 4 were male, 8 presented with critical limb ischemia and 2 presented with intermittent claudication. There was a high prevalence of diabetes mellitus (50%), hypertension (60%) and chronic kidney disease (50%). Mean ankle brachial index was 0.60±0.29. Sixty-six segments were evaluable by both imaging methods.
|
Age, years, mean ± SD |
52 ± 16 |
|
Gende |
|
|
Men |
4 (40%) |
|
Women |
6 (60%) |
|
Critical limb ischemia |
8 (80%) |
|
Hypertension |
6 (60%) |
|
Hyperlipidemia |
2 (20%) |
|
Diabetes mellitus |
5 (50%) |
|
Tobacco use |
1 (10%) |
|
Coronary artery disease |
1 (10%) |
|
Congestive heart failure |
1 (10%) |
|
Chronic kidney disease |
5 (50%) |
|
Ankle brachial index, mean ± SD |
0.60 ± 0.29 |
Table 1: Patient demographics.
Twenty segments (30%) were classified as FS and forty-six segments (70%) were classified as not FS by DSA assessment. Using an RPD > 5 mmHg, sensitivity was 80%, specificity was 85% and accuracy was 79% (Table 2). Using an ExPD > 20 mm Hg, sensitivity was 84%, specificity was 89% and accuracy was 88%.
|
Sensitivity (%) |
Sensitivity (%) |
Accuracy (%) |
|
|
Resting pressure drop > 5 mm Hg |
80 |
85 |
79 |
|
Exercise pressure drop > 20 mm Hg |
84 |
84 |
84 |
Table 2: Sensitivity, specificity and accuracy of blood flow modeling of peripheral computed tomography compared to digital subtraction angiography.
Segmentation of the peripheral arteries from the CTA and geometric model construction (steps 1-3 in Figure 1) took 196 ± 24 minutes. Automated generation of the reduced order model, calculations of pressure drop and determining functional significance took 134 ± 36 seconds on a 3.2 GHz Quad-Core Intel Core i5 notebook computer.
Discussion
In the current study, we evaluated a novel, non-invasive method to evaluate the functional significance of lesions within the peripheral vasculature. We found relatively high diagnostic accuracy using both resting and exercise pressure drops. These findings have implications for the treatment of PVD if they can be replicated in a larger number of patients.
Physiologic lesion assessment in the coronary vasculature is well validated and widely accepted into routine clinical practice [18]. The traditional approach requires the use of a 0.014- inch wire that is placed distal to the lesion, measurement of a resting drop and then use of medications to induce maximal hyperemia. A FFR value of 0.8 or less under hyperemia identifies a coronary lesion with a high likelihood of causing ischemia. This methodology is based upon a pressure-derived index of the maximal achievable myocardial blood flow in the presence of an epicardial stenosis. More recently, resting pressure indices using the instantaneous wave-Free Ratio (iFR) have been developed [19]. Rotational angiography alone, without the use of a pressure wire or medications to induce maximal hyperemia, have also been developed and are referred to as virtual FFR [20]. More relevant to the current study is the use of CT data sets to estimate FFR, referred to as CT-derived FFR, FFRCT [21].
Similar to coronary disease, the ability to accurately assess the functional significance of peripheral vascular lesions can have relevance for pre-procedural planning. Surgical bypass or PVI could then be targeted to only those lesions that are hemodynamically significant.
Currently, there are no standardized methods or techniques to assess the functional significance of lesions located in the peripheral vasculature. The measurement of pressure drops using catheters and/or wires placed into the peripheral vasculature is cumbersome and time-consuming and therefore, is not routinely performed. However, our approach provides noninvasive measurements of pressure drops from CT images. Similar to FFRCT technique, the method that we proposed here is based on image-based blood flow modeling. However, to measure FFR it is assumed that the reference pressure drop in a non-diseased artery is negligible. This is generally not a valid assumption in extensive peripheral arteries (cf. benchmark model in Figure 2). Moreover, there is significant inter-patient and inter-segment variability in the amount of reference pressure drop in the peripheral arteries. A novelty of the presented framework is the ability to efficiently account for this effect by rapidly creating a benchmark model and computing pressures in that model and subsequently in the assay model for each patient to better elucidate the functional significance of a lesion or abnormality. We also note that the number of simulations required to determine functional significance of N lesions is N+2 as two simulations are needed to compute pressure distribution in the source and benchmark models. This is prohibitively expensive using 3D CFD. However, the reducedorder modeling method employed here significantly reduces the cost of computation and enables this information in a more efficient and timely manner [12].
Because patient-specific flow rate measurements were not available in our study, we utilized population-based data to estimate an infrarenal aortic flow rate, and morphologybased laws to model downstream circulation at terminal arteries. If flow rate measurements were available, these data could be alternatively used. However, infrarenal aortic flow rate can vary considerably based on normal activities. Like coronary FFR, this can be moderated by simulating a hyperemic condition; but data to support such modeling in PAD is currently sparse. Standardization of boundary conditions for testing hemodynamic significance of lesions in PAD populations is ongoing.
We note that the FS RPD and ExPD cut points of 5 mmHg and 20 mmHg, respectively, were not calibrated or set based on any knowledge of FS classification from DSA. It is possible that more optimal cut points could be derived to produce higher sensitivity, specificity or accuracy for the given data. However, this was not performed as the data is too small to make such inferences. Moreover, such cut points would more ideally be based on not only on more data, but also on clinical outcome. Indeed, as has been demonstrated for coronary lesions, clinical outcome is better predicted by hemodynamics assessment (e.g. FFR) than geometric assessment [22]. Indeed, it is expected that the methods herein could potentially identify functionally significant (or non-significant) lesions that would be misclassified by visual/angiographic assessment.
Limitations
There are several limitations for the current study. There were relatively few patients included because of the protocol requirement for completion of both DSA and peripheral CTA within 20 days. Moreover, of the 10 patients included, peripheral CTA of both lower extremities was performed in only 2 patients. The limited number of patients undergoing imaging of both lower extremities reduced the number of segments evaluated by both imaging methods. The study population included only patients with symptomatic PVD with either intermittent claudication or critical limb ischemia. Therefore, these results cannot be applied to other patient groups, including asymptomatic patients identified via screening questionnaires and/or screening ankle brachial index studies.
Conclusion
Use of a resting pressure drop greater than 5 mm Hg and an exercise pressure drop greater than 20 mm Hg measured by blood flow modeling from peripheral CTA accurately identifies FS stenosis in patients with PVD. This information will be useful to determine the number of patients needed for a prospective imaging trial to further validate this novel noninvasive approach.
Conflict of Interests
Mehran Mirramezani PhD and Shawn Shadden PhD have a patent pending related to computational methods described in this work.
Funding Acknowledgement
This work was supported in part by the American Heart Association, Award No. 18EIA33900046.
References
- Allison MA, Ho E, Denenberg JO, Langer RD, Newman AB, et al. (2007) Ethnic-specific prevalence of peripheral arterial disease in the United States. Am J Prev Med 32: 328-333.
- Fowkes FG, Rudan D, Rudan I, Aboyans V, Denenberg JO, et al. (2013) Comparison of global estimates of prevalence and risk factors for peripheral artery disease in 2000 and 2010: a systematic review and analysis. Lancet 382: 1329-1340.
- Mahoney EM, Wang K, Cohen DJ, Hirsch AT, Alberts MJ, et al. (2008) One-year costs in patients with a history of or at risk for atherothrombosis in the United States. Circ Cardiovasc Qual Outcomes 1: 38-45.
- Kullo IJ, Rooke TW (2016) CLINICAL PRACTICE. Peripheral Artery Disease. N Engl J Med 374: 861-71.
- Sobieszczyk P, Eisenhauer A (2013) Management of patients after endovascular interventions for peripheral artery disease. Circulation 128: 749-757.
- Conte MS, Pomposelli FB, Clair DG, Geraghty PJ, McKinsey JF, et al. (2015) Society for Vascular Surgery. Society for Vascular Surgery practice guidelines for atherosclerotic occlusive disease of the lower extremities: management of asymptomatic disease and claudication. J Vasc Surg 61: 2-41.
- Shabani Varaki E, Gargiulo GD, Penkala S, Breen PP (2018) Peripheral vascular disease assessment in the lower limb: a review of current and emerging non-invasive diagnostic methods. Biomed Eng Online 17: 61.
- Taylor CA, Fonte TA, Min JK (2013) Computational fluid dynamics applied to cardiac computed tomography for noninvasive quantification of fractional flow reserve: scientific basis. J Am Coll Cardiol 66: 2233-2241.
- Koo BK, Erglis A, Doh JH, Daniels DV, Jegere S, et al. (2011) Diagnosis of ischemia-causing coronary stenoses by noninvasive fractional flow reserve computed from coronary computed tomographic angiograms. Results from the prospective multicenter DISCOVER-FLOW (Diagnosis of Ischemia-Causing Stenoses Obtained Via Noninvasive Fractional Flow Reserve) study. J Am Coll Cardio 58: 1989-1997.
- Min JK, Leipsic J, Pencina MJ, Berman DS, Koo BK, et al. (2012) Diagnostic accuracy of fractional flow reserve from anatomic ct angiography. JAMA 308: 1237-1245.
- Updegrove A, Wilson N, Merkow J, Lan H, Marsden AL, et al. (2017) Simvascular: An open source pipeline for cardiovascular simulation. Ann Biomed Eng 45: 525-541.
- Mirramezani M, Shadden SC (2020) A Distributed Lumped Parameter Model of Blood Flow. Ann Biomed Eng 48: 2870-2886.
- Evans JM, Wang S, Greb C, Kostas V, Knapp CF, et al. (2017) Body size predicts cardiac and vascular resistance effects on men’s and women’s blood pressure. Front Physiol 8: 561.
- Reymond P, Merenda F, Perren F, Rufenacht D, Stergiopulos N (2009) Validation of a one-dimensional model of the systemic arterial tree. Am. J. Physiol. Heart Circ 297: 208-222.
- Cheng CP, Herfkens RJ, Taylor CA (2003) Comparison of abdominal aortic hemodynamics between men and women at rest and during lower limb exercise. J Vasc Surg 37: 118-123.
- Pandey A, Kraus WE, Brubaker PH, Kitzman DW (2020) Healthy aging and cardiovascular function: Invasive hemodynamics during rest and exercise in 104 healthy volunteers. JACC: Heart Failure 8: 111-121.
- Jaeschke H, Wielemborek-Musial K, Szmigielska K, Leszczynska J, Jegier A (2016) Blood pressure response to submaximal exercise test in adults. BioMed Research International Page no: 5607507.
- Johnson NP, Gould KL, Di Carli MF, Taqueti VR (2016) Invasive FFR and Noninvasive CFR in the Evaluation of Ischemia: What Is the Future? J Am Coll Cardiol 67: 2772-2788.
- Sen S, Escaned J, Malik IS, Mikhail GW, Foale RA, et al. (2012) Development and validation of a new adenosineindependent index of stenosis severity from coronary wave-intensity analysis: results of the ADVISE (ADenosine Vasodilator Independent Stenosis Evaluation) study. J Am Coll Cardiol 59: 1392-1402.
- Morris PD, Ryan D, Morton AC, Lycett R, Lawford PV, et al. (2013) Virtual fractional flow reserve from coronary angiography: modeling the significance of coronary lesions: results from the VIRTU-1 (VIRTUal Fractional Flow Reserve From Coronary Angiography) study. JACC Cardiovasc Interv 6: 149-157.
- Nørgaard BL, Leipsic J, Gaur S, Seneviratne S, Ko BS, et al. (2014) Diagnostic performance of noninvasive fractional flow reserve derived from coronary computed tomography angiography in suspected coronary artery disease: the NXT trial (Analysis of Coronary Blood Flow Using CT Angiography: Next Steps). J Am Coll Cardiol 63: 1145-1155.
- Pijls NH, van Son JA, Kirkeeide RL, De Bruyne B, Gould KL (1983) Experimental basis of determining maximum coronary, myocardial, and collateral blood flow by pressure measurements for assessing functional stenosis severity before and after percutaneous transluminal coronary angioplasty. Circulation 87: 1354-1367.
Citation: Mirramezani M, Cimadomo P, Ahsan E, Shavelle D, Clavijo LC, et al. (2021) Mathematical Modeling of Blood Flow to Evaluate the Hemodynamic Significance of Peripheral Vascular Lesions. J Angiol Vasc Surg 6: 076.
Copyright: © 2021 Mehran Mirramezani, et al. This is an open-access article distributed under the terms of the Creative Commons Attribution License, which permits unrestricted use, distribution, and reproduction in any medium, provided the original author and source are credited.